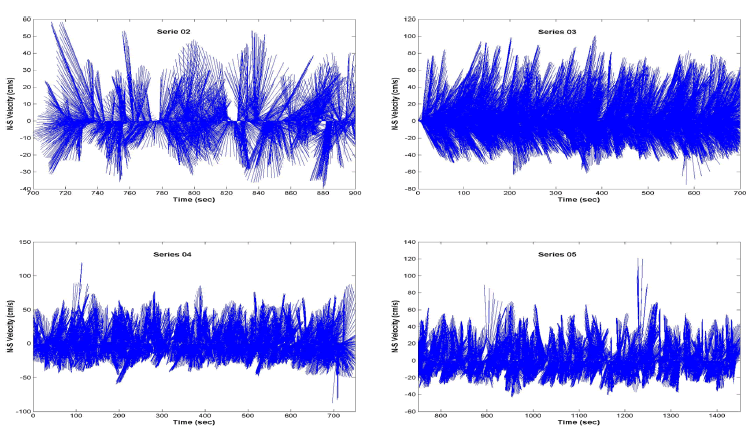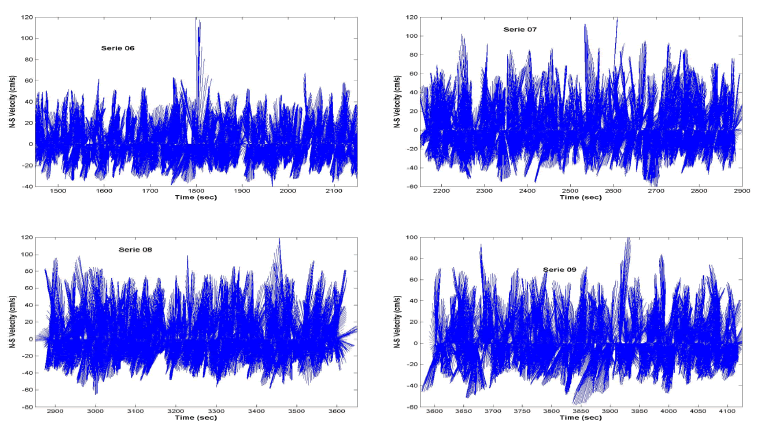

Figure 7. Vector plots for the eight runs determined with the ADV coincident with the period of grid inundation. The series show the time variation of the flows intensity and directions. Peak velocities reached up to 120 cm s-1 for the swash and 75 cm s-1 for the backswash.