


 Inglés (pdf)
 Articulo en XML
 Referencias del artículo
 Enviar articulo por email
 Citado por SciELO
  Similares en
SciELO
Similares en
SciELO 
 Permalink
INTRODUCTION
The number of adult patients requiring orthodontic treatment has increased noticeably in recent decades and Clear Aligner Therapy (CAT) has become an option for patients requiring comfort and esthetics consistent with current lifestyle1, 3.
The relationship between orthodontic treatments and periodontal health has always been a matter of concern to orthodontists and periodontists, whether as a result of the forces applied or due to the changes produced by orthodontic movement in both the bone and the soft tissues4,5. Mild or moderate dental crowding, narrow arches or crossbites can be resolved by dentoalveolar expansion. The literature has shown that dentoalveolar expansion is the movement that most compromises the buccal bone 6, 9. Technological advances in imaging have enabled detailed evaluation of facial bone by using cone beam computed tomography (CBCT)3, 10,12.
The effects on alveolar bone and soft tissues in patients treated with fixed orthodontic appliances were extensively evaluated with two-dimensional radiographs until the advent of computed tomography4. Mandelaris mentioned that the American Academy of Periodontology Consensus of 2017 agreed that CBCT is the only radiographic mode that enables objective detection and prediction of changes in the facial bone and the general structure ofthe alveolar bone10. While there is limited evidence supporting routine use of CBCT in orthodontic-periodontal therapy, experts agree that its use should be considered in various scenarios, including adult patients with dentoalveolar deficiencies (crowding and/or transverse discrepancies) which require expansion, thin periodontal phenotype and recessions, among others8.
Considering that there is plentiful evidence of the presence of bone dehiscence and fenestrations in patients who have never undergone orthodontic treatment, it is very important to diagnose these conditions in order to minimize risk during expansion13, 14. Some studies have shown that maxillary facial alveolar bone decreases after dentoalveolar expansion when fixed appliances are
used15.
There are several studies on the thickness of the buccal plate of maxillary incisors and canines, but relatively few on the thickness of the facial plate of premolars. Results vary according to the method used for measuring. The facial plate is significantly thinner for the upper first premolar than for the upper second premolar, due to root morphology and more anterior position in the arch, among other factors5, 11, 12,16-22. Average alveolar bone thickness in the premolar zone is 1.13 mm measured at 1 mm apical to the crest, and 1.03 mm at mid-root23. Although CBCT can provide plentiful information, it is also essential to record gingival-periodontal clinical parameters periodically. The treatment plan should evaluate the risk of alterations at gingival level as well as attachment loss. Periodontal health should be considered as an important factor in the success of an orthodontic treatment.
Oral hygiene procedures have major impact on periodontal health during orthodontic treatment. The literature supports the link between increase in bacterial plaque indexes and decline in oral health conditions in patients under orthodontic treatment, especially when fixed appliances are used. CAT can minimize the negative orthodontics-related effects on health by enabling simpler oral hygiene procedures2, 24-27.
The aim of this study was to evaluate changes in periodontal status and alveolar bone in a series of cases by considering clinical and tomographic parameters during the first year of orthodontic expansion with Invisalign® aligners.
MATERIALS AND METHODS
This study was approved by the Ethics Committee of the Argentine Society of Orthodontics on August 1, 2016. All patients signed the informed consent form accepting to participate voluntarily in the clinical study. The study protocol was in agreement with the Helsinki declaration of 1975, reviewed in 2013. Twenty-three patients with orthodontic expansion indication and high esthetic demand, who were referred by the Admissions Department of the Argentine Society of Orthodontics from 2016 to 2018, were evaluated for treatment with Invisalign® aligners. Nineteen of these patients met the inclusion criteria and were selected to participate in the study: 16 females and 3 males, 15 to 50 years of age. Inclusion criteria were: complete dentition, mild or moderate tooth crowding, with indication of expansion, with healthy or normalized periodontium, non-smokers. Exclusion criteria were: crowns in the upper jaw, extensive restorations, presence of carious lesions, pregnancy, presence of systemic diseases contraindicating orthodontic treatment, history of head and neck radiation, regular use of steroids or any other medication affecting bone turnover.
All patients received an oral hygiene protocol: Bass Technique with soft toothbrush (Colgate® Slimsoft) use of dental floss, interdental brushes or picks. Use of electric toothbrush was not allowed. Recommended frequency for tooth cleaning was twice a day.
After recording periodontal indexes and performing tomographic studies, orthodontic treatment with aligners was begun. Patients were scheduled once a month for follow-up. Aligners were to be used 22 hours a day and changed every 15 days.
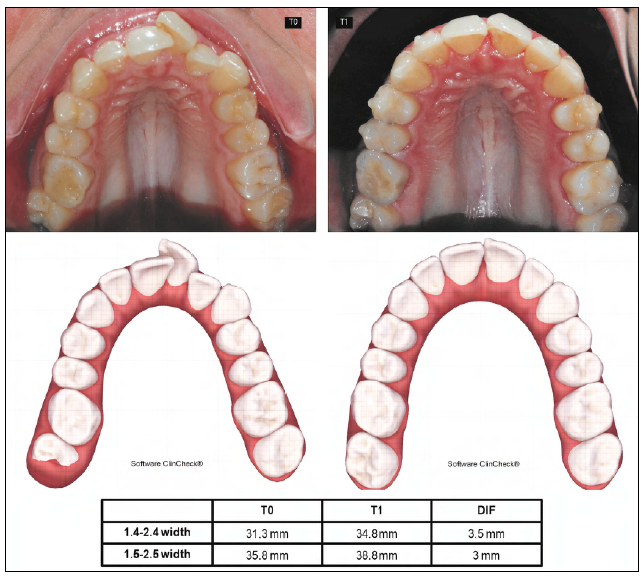
For this study, in the 19 selected patients, the upper first (1PM) and upper second (2PM) premolars were analyzed. Clinical and tomographic measurements were taken before beginning expansion treatment (T0) and at 12 months (T1).
Clinical records
The following indexes were recorded for buccal and proximal surfaces of upper first and second premolars:
Measurements were taken with a periodontal probe marked in millimeters (North Carolina; Hu Friedy®, Chicago IL) and rounded to the nearest millimeter on the probe scale.
Analysis of tomographic images
Facial bone thickness and height in maxillary premolars were examined by using CBCT, which provides 0.123 mm image resolution, enabling precise linear measurements with low exposure to radiation. Thicknesses under 0.12 mm might not be detected. Tomographic images were taken with 3D Accuitomo (J. Morita MFG Co., Kyoto, Japan). The scans were taken in a single 360-degree rotation at a scan time of 17 seconds, 90 Kvp, 0.125 mm voxel size and 60 x 60 mm field of view (FOV). Patient head was positioned locating Camper's Plane parallel to the ground and the midsagittal plane perpendicular to it. Position was held by headrest, headband and chinrest.
After the CBCT scans, a protocol was established to capture pre- and post-treatment images of selected teeth (1.4, 1.5, 2.4 and 2.5) using One Volume software (J Morita MFG Co. Kyoto, Japan) in order to evaluate any changes in height and thickness of the facial bone.
Standardization of positioning of the tooth to be evaluated
A standardized orientation was established, and a protocol was followed.
Axial-guided navigation was used as reference to locate landmarks.
On the axial section, the image was positioned such that the vertical was tangential to the vestibular surface of the selected teeth, while the major axis coincided with the horizontal
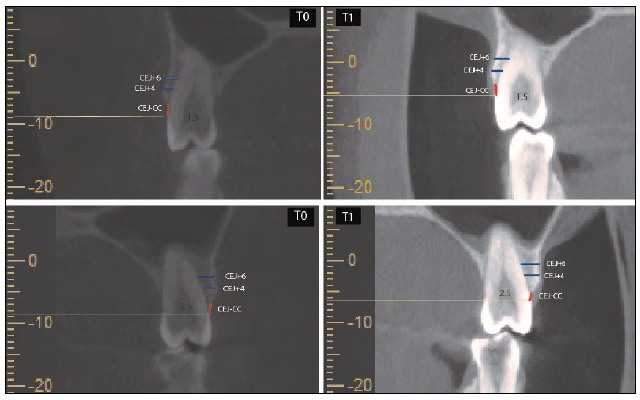
On the coronal plane, the image was positioned such that the line passing through the buccal and palatal cementoenamel junctions coincided with the horizontal axis
Both sections were adjusted simultaneously (Fig. 1).

Measurements
Image files were processed in a conventional computer using Image J (NIH) software on a Lenovo monitor with 1280 x 1024 pixel resolution. All measurements were taken by a single examiner (VM).
The following measurements were taken on the coronal section (Fig 2):
Distance from the cementoenamel junction (CEJ) to the alveolar crest (CC): CEJ-CC
Thickness of facial bone 4 mm apical to the CEJ: CEJ+4
Thickness of facial bone 6 mm apical to the CEJ: CEJ+6

RESULTS
The average expansion was 1.93 mm (range 0.5 to 5.1 mm) for 1PM and 1.67 mm (range 0.3 to 3.9 mm) for 2PM. Seventy-six teeth (n=76), corresponding to upper 1PM and 2 PM were evaluated in the 19 patients.
Arithmetic mean distance CEJ-CC in 1PM was 3.05 mm (range 1.09 mm to 4.99 mm) at T0, and remained at 3.05 mm at T1 (range 0.41 mm to 5.57 mm). Arithmetic mean distance CEJ-CC in 2PM was 2.06 mm (range 1.04 mm to 4.66 mm) at T0 and 2.31 (range 1.07 to 5.23) at T1.
For a descriptive analysis of the distance CEJ-CC, results were grouped into two categories (Table 1):
Positive response (difference between T0 and T1 <0.5mm)
Negative response (difference between T0 and T1 >0.5 mm).

Ofthe 38 1PM, 31 (81.6%) showed a difference <0.5 mm between T0 and T1. This variation indicates that the distance CEJ-CC remained the same or decreased, a positive response. Seven 1PM (18.4%) showed a difference >0.5 mm between T0 and T1, a negative response. Of the 38 2PM, 26 (68.4%) showed a difference <0.5 mm between T0 and T1 and 12 2PM (31.6%) showed a difference >0.5 mm between T0 and T1.
Initial facial bone thickness for 1PM ranged from 0.00 mm to 2.04 mm (average 0.80 mm) at CEJ+4 and from 0.40 mm to 2.85 mm (average 0.88 mm) at CEJ+6. For 2PM, it ranged from 0.00 mm to 3.06 mm (average 1.59 mm) at CEJ+4 and 0.60 mm to 3.94 mm (average 1.61 mm) at CEJ+6.
For analysis of bone thickness, the following categories were established (Table 2):

Analysis of the post-expansion bone thickness showed the following: Of the 38 1PM, at CEJ+ 4, of 31 sites with thickness >0.5 mm (T0), 28 remained in that group and in 3 sites no detectable wall was found. One site with thickness <0.5 mm (T0) increased its thickness to >0.5 mm. Of 6 sites with no detectable wall (T0), 1 increased its thickness. At CEJ+ 6, of 34 sites with thickness >0.5 mm (T0), 32 remained in that group and at 2 sites the thickness decreased to <0.5 mm. Of the 4 sites with thickness <0.5 mm (T0), 2 increased their thickness to >0.5 mm. In 2PM, at CEJ+ 4, of 36 sites with thickness >0.5 mm (T0), only one site had an undetectable wall. Of 2 sites with undetectable thickness (T0), one increased its thickness to >0.5 mm. In CEJ+ 6, of the 38 sites with thickness >0.5 mm (T0), 32 remained in that group, 5 became <0.5 mm thick and one was not detectable.
Figs. 5 and 6 provide data for bone height and thickness at the beginning of treatment and postexpansion.

Fig 5 Tomographic measurements in 1PM at T0 and T1 for all teeth studied. A) Distance CEJ-CC. B) Facial plate thickness at CEJ+4. C) Facial plate thickness at CEJ+6.

Fig 6 Tomographic measurements in 2PM at T0 and T1 for all teeth studied. A) Distance CEJ-CC. B) Facial plate thickness at CEJ+4. C) Facial plate thickness at CEJ+6.
The minimal changes in the clinical records (GI, PI, PPD and CAL) between T0 and T1 were compatible with the maintenance of gingival-periodontal health (Figs. 7 and 8). Regarding CAL, of the 76 evaluated sites, 6 lost insertion (4 of them lost 1 mm and the other 2 lost 2 mm).

Fig 7 Clinical records in 1PM at T0 and T1 for all teeth studied. A) Gingival index (GI). B) Plaque index (PI). C) Probing pocket depth (PPD). D) Clinical attachment level (CAL).

DISCUSSION
The aim of this study was to analyze the changes in periodontal health status and the effects on maxillary facial bone after the first year of orthodontic expansion using the Invisalign® clear aligner therapy. Although we found some studies that analyzed alveolar bone height and/or thickness, none of them correlated this information with clinical parameters7,15.
The presence of facial bone - both height and thickness - is crucial because it supports the gingival margin, providing it with stability over time, and determines its esthetic outline. If this wall is lost, bone dehiscence or gingival recessions may develop. It is therefore essential to evaluate its dimensions prior to beginning orthodontic therapy with expansion (either bodily or tipping movement).
Information provided by CBCT is useful for making the diagnosis and designing an appropriate treatment plan with an expansion requirement. The thickness of the bone plate that covers teeth in buccal and palatal aspects is one of the limiting factors of tooth movement4.
In our study, facial bone thickness and height in maxillary premolars were examined by using CBCT, which provides 0.123 mm image resolution, enabling precise linear measurements with low exposure to radiation. Thicknesses under 0.12 mm might not be detected.
Ali et al.9 reported that the range of dental expansion should be 2-3 mm per quadrant to reduce the risk of gingival recession. In the present study, the prescribed amount of expansion for each participant was customized based on measurements of the dentition and CBCT, in order to be within a safe range and to design an accurate treatment plan. The average expansion was 1.93 mm for 1PM (range 0.5 to 5.1 mm) and 1.67 mm for 2PM (range 0.3 to 3.9 mm).
In our study, facial bone height was measured by evaluating the distance from the CEJ to the CC, and its thickness was measured at two levels: CEJ+4 and CEJ+6, in 38 first upper premolars and 38 upper second premolars. For 1PM, our average value for the CEJ-CC distance was 3.05 mm at T0, similar to the value found in a study by Vera23 (2.79 mm), who analyzed facial bone wall dimensions in anterior maxillary arch between and including 1PM. Wang et al.5 also analyzed facial bone wall dimensions of maxillary anterior teeth and premolars using CBCT, and their findings were lower than Vera's and ours. Height was measured from CEJ to CC and ranged from 0.1 mm to 4 mm; the mean distance was 2.2 ±0.7 mm for 1PM and 2.0 ±0.6 mm for 2PM.
Post-expansion for 1PM, the CEJ-CC distance remained unchanged or diminished at 31 of the 38 evaluated sites, meaning that the level of insertion remained the same or increased at these sites, considered to be a positive response. However, it increased at 7 sites, reflecting a decrease in the level of insertion. For 2PM, there were 26 sites with a positive response, while 12 showed a decrease in level of insertion. According to Castro et al.3, the association between orthodontic treatment and changes in the distance between CEJ-CC has been widely studied, but the difference in orthodontic techniques, the various criteria for radiographic evaluation, and the several methods of diagnostic imaging used in the different studies have limited the comparison of results12.
For facial bone thickness, Vera23 reports that the median buccal alveolar bone thickness 1 mm apical to the alveolar bone crest was 1.13 mm; and at the midroot it was 1.03 mm in the premolar area. Temple et al.18 analyzed the thickness at 1mm, 3mm and 5mm apical to CC of the posterior teeth, finding an average of 0.72 mm for 1PM at 3mm and 1.24mm for 2 PM. In our study, the initial values for 1PM (average 0.80 CEJ+4 and 0.88 CEJ+6) and for 2PM (average 1.59 CEJ+4 and 1.61 CEJ+6) agree with Temple et al.18, being lower than 1 mm, with many of them having a wall thinner than 0.5mm.
Braut et al.11 analyzed the thickness of buccal bone of anterior teeth including 1 PM at two locations: 4mm and midroot. They found absence of buccal wall in 17.5% of the cases for 1PM measured at 4mm to the CEJ. Average thickness was 0.73mm at 4mm and 0.75mm at midroot. Similarly, in our sample, no buccal wall was detected in 15.8% of 1PM, and the thickness measurements were similar. Cattaneo et al.15 assessed transverse changes in upper arch as a result of using passive and active self-ligating brackets. They performed greater transversal increase in the interfirst premolar width (4.3 mm and 4.5 mm) and intersecond premolar width (4 mm and 3.3 mm) respectively; thus, they found the buccal bone area for 2PM decreased on average 14 to 20% post-dentoalveolar expansion. The buccal bone for 1PM was so thin that the error of the method surpassed the mean measured value, for which reason only the bone in the 2PM region was evaluated.
In our study, for 2PM, there was a slight increase in thickness at CEJ+4 (2.7% improvement), while there was a reduction of 13.1% at CEJ+6 at T1. The different measurement methods, statistical evaluation, appliances and expansion amounts limit the comparison of the results of these two studies. Ibiapina et al.7 evaluated changes in transverse dimensions of upper arch and thickness of the buccal bone plate in patients undergoing orthodontic treatment with conventional and self-ligating brackets, at CEJ+3mm and CEJ+6mm.The expansion was 1.57mm and 1.77mm for interfirst premolar, and 1.08 mm and 1.88mm for intersecond premolar. They observed that a small decrease of the buccal bone occurred similarly in both groups. Our study presents an average expansion similar to Ibiapina's and the results are in agreement with that study, having found a slight decrease of only 5.2% for first PM at CEJ+4mm.
Karkhanechi et al.2 report that treatments with fixed orthodontic appliances increase plaque accumulation and can interfere with oral hygiene procedures. A shift is observed from Gram+ aerobic species (associated with periodontal health) to Gram- anaerobic or facultative species (associated with periodontitis). In agreement with the study by Levrini et al.27, which claims that CAT facilitates adequate oral hygiene, thereby reducing the risk of gingival-periodontal complications, our study showed that PI, GI, PPD and CAL remained stable. Regarding PI, for 1PM, 2 sites scored 1 at T0 and at T1. The same was true for 2PM. Regarding GI, for 1PM, at T0 the score was 0 at 37 sites and 2 at one site, while at T1 it was 1 at four sites. For 2PM, it was 0 at all sites at both times. Average PPD for 1PM was 1.16 at T0 and 1.32 at T1, while for 2PM it was 1.26 at T0 and 1.53 at T1, which evidences the maintenance of periodontal health. Average clinical CAL was 0.68 mm at T0 and 0.47 at T1 for 1PM, and 0.21mm at T0 and 0.11 mm at T1 for 2PM. In both groups, CAL declined, which is considered to be a clinical improvement.
With regard to the association between attachment loss and increase in distance from CEJ to CC, only one site showed positive correlation. At the sites where the CEJ-CC distance was found to increase, it could be a due to thin periodontal phenotype and the very thin initial buccal bone thickness. Nevertheless, no clinical correlation was found, possibly due to the formation of a long junctional epithelium and/ or gingival contraction which prevented probe penetration.
Despite the risk of expansion in patients with a very thin buccal bone and crowding, this treatment was chosen because it provides improvements for oral hygiene and a decrease in the accumulation of bacterial plaque, guaranteeing the health of periodontal tissues for the future.
Further studies are needed to observe the behavior of periodontal tissues using larger samples and a longer follow-up period.

