


 English (pdf)
 Article in xml format
 Article references
 Send this article by e-mail
 Cited by SciELO
  Similars in
SciELO
Similars in
SciELO 
 Permalink
KEY POINTS
Current knowledge
• Respiratory muscle weakness in Duchenne dystrophy is due to the degenerative myopathic process of the disease. Although known, the dependence on the lung volume at which the maximal inspiratory and expiratory maneuvers are performed is often not considered. It can lead to misinterpretation, especially when relating the generated pressure as a percentage of the predicted values.
Contribution of the article to current knowledge
• In subjects with Duchenne muscular dystrophy, intrinsic respiratory muscle weakness and mechanical disadvan tage lead to inadequate peak static pressure genera tion. Our results suggest that these values should be interpreted cautiously, as they overestimate respiratory muscle weakness compared to the predicted values ob tained in TLC and RV. Our results provide additional data supporting absolute values use rather than predicted values.
Duchenne muscular dystrophy (DMD), an X-linked disorder, affects one in 5,000 boys and presents proximal muscle weakness in early childhood. Untreated boys become wheelchair users by the age of 12 years and die of cardiorespiratory complications in their late teens to early 20s1,2. With current medical advances, many DMD patients can now expect to live into their forties3. It is char acterized by progressive loss of skeletal muscle strength, respiratory muscle weakness, and respiratory failure. In addition, lung volumes are almost invariably diminished due to respiratory muscle weakness and progressive thoracic deformities4.
Measurement of respiratory function and muscle strength are part of its routine assessment, allowing clinicians to predict which patients will require assisted coughing and ventilation5-7. Spirometry, specifically forced vital capacity (FVC), is a simple measure of lung function and can help predict certain features of clinical outcomes. However, it is nonspecific and fails to distinguish inspira tory from expiratory muscle weakness and restrictive syndromes caused by chest wall or parenchymal abnor malities8-10.
Maximal static pressures measurement at the mouth is a simple test that allows quantification of inspiratory and expiratory muscle strength. However, it depends not only on muscle strength but also on the elasticity of the thora copulmonary system. Thus, in normal subjects, maximal inspiratory pressure (MIP) is reached at residual volume (RV), and can decrease as a consequence of expiratory weakness, preventing RV from being reached. In contrast, maximal expiratory pressure (MEP) is achieved at total lung capacity (TLC) and can decrease if weakened inspira tory muscles cannot inflate lungs up to TLC11.
In DMD, low MIP and MEP values may result from muscle weakness and low lung volumes. However, inter pretation of MIP and MEP, intrinsic factors and operative lung volume have not been specifically reported. There fore, the present study objective was to compare maximal static pressures in subjects with DMD concerning the static lung volumes at which MIP and MEP manoeuvres were performed. The implications of using predicted values at TLC and RV could be relevant and may allow for an alternative interpretation of respiratory muscle weakness in DMD patients.
Materials and methods
Subjects
A retrospective search was made on our database for DMD patients that had performed spirometry, lung volumes de termination and measurement of maximal static respiratory pressures. Diagnosis was based on a combination of clinical findings, muscle enzyme levels, electromyogram and muscle biopsy, as well as DNA testing, when available. Clinical status and motor functional capacity (MFC) were gathered from clinical records for each patient12. Pulmonary function testing manoeuvres were reviewed and those patients whose tests didn´t fulfil acceptability criteria were excluded. Since most patients were in a wheelchair or had spinal deformities, arm-span was used to estimate subject’s height. In those with upper extremity contractures, the sum of each arm segment was used13,14.
Pulmonary function testing
Spirometry was performed with a volumetric spirometer, ac cording to the standard method and lung volumes were mea sured with the helium dilution technique (Collins GS-PFT, Warren E. Collins, Inc. Braintree, Massachusetts, USA) using standard methodology15,16. Maximal static pressures at the mouth (MIP and MEP) were measured according to standard methodology using a flanged mouthpiece connected to a pressure transducer (MP45, Valydine Engineering, Northridge, CA, USA). MIP was performed by having subjects emptying their lungs as much as possible and then perform a maxi mum inspiratory manoeuvre; MEP was performed by having the subjects inspire maximally and then perform a maximum expiratory manoeuvre17. The values were digitally recorded (MP100 Workstation, BIOPAC Systems Inc, Goleta, CA, USA).
Measurements are expressed in absolute values and as percent of predicted values16,18. Cook et al. values for MIP and MEP at different lung volumes were used to establish a comparison with expected pressures at actual lung volumes achieved for three age-matched subgroups19. According to Cook, the diagrams pressure volumes were created as fol lows: Group A: 7-11 years, Group B: 12-16 years and Group C: 17-20 years19.
Statistical analysis
Mean and standard deviation or median values and interquar tile ranges are reported according to distribution. Student’s t-test and analysis of variance were done according to distri bution for comparisons.
The study was approved by the local Institutional Review Board, protocol #216, CUDAP-TRI-UBA 0051153/2018.
Results
Data from 43 DMD patients (range 7-20 years) were ana lyzed: Group A, n = 15; Group B, n = 19; Group C, n = 9. Anthropometric, clinical and functional characteristics are summarized in Table 1. Twenty-one subjects were MFC grade 9 and 10 (subject in a wheelchair, elbows flexed in the anti-gravity position or unable to move against gravity). Thirty-five subjects exhibited TLC below the lower limit of normality, while 31 had RV/TLC ratio above the upper limit of normality.
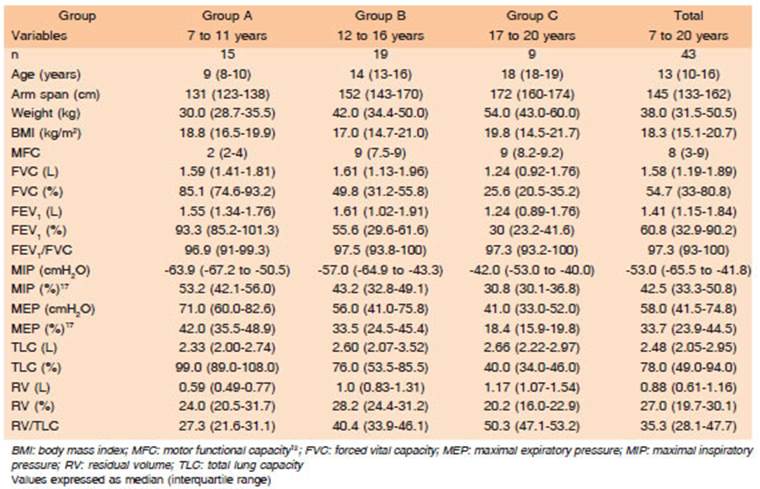
Figure 1 shows the relationship between lung volumes and maximal static pressures (connected dots with whis kers) for normal subjects in three age ranges, according to Cook et al.19. Open (MEP) and closed (MIP) circles show values obtained in our patients.

Fig. 1 Charts represent the lung volume (in % of TLC) and maximal static pressures at the mouth. Lung volumes (Y-axis) are expressed as a percent of predicted values. Maximal static pressures (X-axis) are expressed in cmH2O. The curved lines to the left and right represent the mean values ± SD for maximal static pressures for each lung volume19. Panel Charts: Group A: age 7 to 11 years; Group B: age 12 to 16 years; and Group C: age 17 to 20 years. It is evident that many subjects with DMD were unable to reach their expected RV and TLC. Most of the MIP and MEP values were outside the expected value for each lung volume. Points (a), (b), and (c) in panel B denote an example from a patient: (a) is the predicted value, taken from normal subjects capable of reaching TLC = 167 cmH2O; (b) is the MEP va lue obtained from the patient = 64 cmH2O at 50% predicted TLC; (c) is the predicted value at the same volume reached by the patient in point (b) = 128 cmH2O at 50% TLC. If (b) is compared against (a), the percent predicted is 38.3%. If it is compared against (c), the percent predicted is 50%
In the Group C, greater thoracic restriction (i.e., low TLC) and greater respiratory muscle weakness (i.e., low MIP and MEP) were found. It is possible to observe that 3/15 patients from Group A and 9/9 from Group C could not reach the predicted TLC to perform the MEP. While 10/15 patients from Group A and 7/9 from Group C did not reach the RV predicted to perform MIP. Moreover, 91% (4/43) of MIP and MEP values were below standard deviation (whiskers) of the reference value for the lung volumes at which the manoeuvre was performed.
When MIP was compared to predicted values at RV, MIP in % predicted had a median of 53, 43 and 31% for Group A, B and C respectively (Fig. 2 upper panel). Compared to % predicted for the reached lung volume (the true RV for each patient), a median of 75, 52 and 34% was obtained in those Groups. There was a significant statistical difference for Group A (p < 0.025).
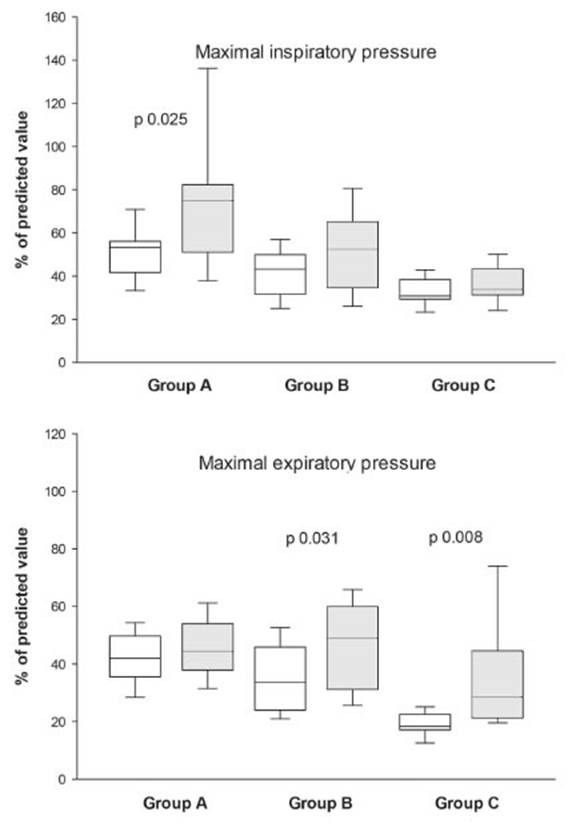
Fig. 2 Comparison of percentages of the predicted value (white boxes) when predicted RV and TLC are considered and when corrected to the real RV and TLC of each patient (grey boxes)
Conversely, when MEP was compared to predicted values at TLC, MEP in % predicted had a median of 42, 33 and 18% for Group A, B and C respectively (Fig. 2 lower panel). Compared to the percentage predicted for the reached lung volume, (the true TLC for each patient) a median of 44; 49 and 28% was obtained in those Groups. There was a significant statistical difference for Groups B (p < 0.031) and C (p < 0.008).
Discussion
This study provides data for an alternative interpreta tion of force generation in subjects with DMD beyond muscle weakness. We found that the intrinsic weakness of respiratory muscles and mechanical disadvantage lead to inadequate maximal static pressure generation. Data expressed in percent of predicted values should be interpreted cautiously.
Measuring the maximum static pressures (MIP and MEP) is a simple way to gauge inspiratory and expira tory muscle strength. However, interpretation of low results, such as in neuromuscular diseases, can be problematic20.
In normal subjects, maximal static pressures in the mouth are not strictly indicative of the force developed by the respiratory muscles. The passive elastic recoil pres sure of the respiratory system (lung and chest wall) counts for the pressure generated by respiratory muscles20. Only at functional residual capacity (FRC), when the forces of the collapsing lung and the expanding force of the rib cage are equal (and opposites), the static pressure measured in the mouth is virtually equivalent to the force developed only by the respiratory muscles. However, at residual volume (RV), where MIP is usually measured, the pas sive elastic recoil pressure of the respiratory system may be as much as 30 cmH2O and thus makes a significant contribution to MIP of up to 30%. Similarly, since MEP is measured at TLC, the respiratory system recoil pressure can be up to 40 cm H2O20. Then, as FRC is difficult to establish, and MIP and MEP are maximal forces, they are measured after complete exhalation at or near RV and full inhalation at or near TLC respectively21, 22. It is usual practice to report MIP and MEP values in % predicted of reference values obtained with this technique17. Our results suggest that using this comparator may lead to overestimation of respiratory muscle weakness.
When providing a trend of lung function data over multiple visits, the serial display of absolute values is recommended21, especially in adults. Our results provide additional data supporting the use of absolute values instead of predicted ones.
The implications of these results on cough assistance manoeuvres should be also discussed. Predicted values for maximal static pressures at the mouth are established from measuring normal subjects, who can satisfactorily reach RV and TLC [for example, point (a) in Fig. 1B]. Ab solute values obtained during testing are usually compared to them. But because of respiratory muscle weakness, and in some cases thoracic deformities, most of our DMD subjects failed to reach RV and TLC. As can be seen in the example shown in Figure 1, expected MEP value for that patient is 167 cmH2O [point (a) in panel B]. As the patient had a MEP value of 64 cmH2O [point (b)], it is considered to be 38.3% of predicted (obtained value/predictive value × 100 = 64 cmH2O/167 cmH2O x 100 = 38.3%). But the patient reached only 50% of TLC [point (c)], lowering the contribution of elastic recoil to the MEP value obtained. Then, a new percent predicted can be calculated as 50% (obtained value/predicted value at that volume × 100 = 64 cmH2O/128 cmH2O × 100 = 50%). As such, percent predicted values of maximal static pressures lack strength in clinical interpretation of MIP and MEP.
The difference between both predicted percentages (Fig. 2) can be attributed to pressure generating capacity of elastic recoil of the thoracopulmonary system. From a practical point of view, this can be appreciated when air-staking manoeuvres are performed, as they inflate the lungs, increasing elastic recoil and improving cough strength and airway clearance23,24. The extent to which MEP and peak expiratory flow values are affected by changes in lung volume with air application warrants further investigation.
There were limitations to our study, the first of which was that the data were retrospectively collected. Respira tory function in patients with DMD is monitored by routine measurement of FVC, MIP, and MEP9. The limitations and the difficulties associated with these volitional measures were considered8,9. Some subjects find it difficult to per form truly maximal efforts due to a lack of motivation or genuine problem with the manoeuvre.
As could be expected from the natural evolution of the disease, reached volume was lower in the older patients (Fig. 1C). This is probably an expression of the large con tribution of thoracic rib cage deformity to the mouth pres sures generation than from weakening of the respiratory muscles. Although our study includes only DMD patients, its findings could be extrapolated to other neuromuscular diseases, especially when progressive thoracic deformity is present, such as spinal muscular atrophy, limb-girdle muscular dystrophy and others.
In conclusion, maximal static pressures should be inter preted cautiously as they overestimate respiratory muscle weakness when compared to predicted values obtained at TLC and RV. Our results provide additional data sup porting absolute values use rather than predicted values.

