


 English (pdf)
 Article in xml format
 Article references
 Send this article by e-mail
 Cited by SciELO
  Similars in
SciELO
Similars in
SciELO 
 Permalink
INTRODUCTION
Nitrogen (N) is the main nutrient affecting yield and grain quality in sunflower (Helianthus annuus L.) (Alberio et al., 2015). An efficient N management could help to reduce yield and quality gaps. However, N fertilization is not a common practice for farmers (Hall et al., 2013). In addition, N plays an important role in determining grain oil concentration (OG) and protein concentration (PG) (Alberio et al., 2015). From a commercial point of view, OG determines oil industrial yield and PG determines the quality of by-products as pellets and meals (Dauguet et al., 2016). Although an adequate N availability is necessary to obtain grains with high OG and PG, excessive concentration of this nutrient could reduce OG (Alberio et al., 2015). However, our previous work showed a positive effect on NG and, therefore, on PG without decreasing OG even with N rates up to 160 kg N ha-1 (Diovisalvi et al., 2018). Therefore, it is essential to determine not only OG but also NG. There are various methodologies to quantify NG. One of the first methods used is the Kjeldahl method (Jones Jr, 1991), which is based on the digestion of the sample with sulfuric acid and catalyzers at > 250 ºC. Then, the distilled product is titrated with a solution of standardized sulfuric acid to determine N content. The disadvantages of this method are that it requires corrosive and-or toxic products, takes a long time, and its several steps can lead to errors (Jung et al., 2003).
The Dumas method is an alternative to Kjeldahl method because it is faster (less than five minutes per sample), precise, and it can be semi-automatic and avoids using corrosive or toxic products, being a relative secure method (Jung et al., 2003). It consists of a dry combustion of the sample at 950 ºC (converting all N forms into N oxides and reduction to gaseous N), and then the conductivity is measured with a TruSpec CN analyzer (LECO, 2021). Several works analyzed the effectivity of the Dumas method compared with to Kjeldahl method. Only in cases with high nitrate concentrations, the analysis by Dumas produced higher NG values because this method measures some N forms not quantified by the Kjeldahl method (Simonne et al., 1997). Moreover, for soybean protein meals, cereal grains and dairy products both methods presented similar behavior. However, in most cases, laboratories use the Kjeldahl method as it is cheaper than the Dumas one (Jung et al. 2003).
Near infrared spectroscopy (NIRS) represents other method for determining NG. This technique is widely used for the analysis of different traits of food quality and farm products because it is non-destructive, fast, and simple, and it allows working with a sample size more representative than in other methods (Batten, 1998). The NIRS technique is based on the analysis of the spectrum of the light reflected by the sample (wavelength 1100-2500 nm), which provides information of the product composition (Murray, 1993; Batten, 1998). It is an indirect or secondary method because it requires calibration with reference samples estimated with other method (chemical or physical) (Sáez-Plaza et al., 2013), so it depends on the accuracy of the reference method, even though its precision may be superior (Batten, 1998). Under correct use, NIRS can be more profitable than traditional methods of wet chemistry (Manley, 2005). In sunflower, it was not developed as in other grains mainly because the spectrum of the hull does not represent the whole grain composition (Sato et al., 1995; Perez-Vich et al., 1998). However, calibrations for estimating OG and fatty acid composition were developed with milled grains using this technique (Velasco et al., 2004), but there is limited information about determining NG in those grains. In addition, with NIRS technology no chemical products are used as in the Kjeldahl method and the cost per sample is lower than Dumas method. For these reasons, NIRS represents and interesting alternative to be used as a routine method in routine analysis (Velasco et al., 2004).
Knowing PG is useful to estimate protein in by-products (PM) (González-Pérez, 2015; Dauguet et al., 2016). Differences up to 1-2% in PG could represent differences up to 5% in PM, so it is essential to obtain grains with high PG (Merrien et al., 1988; Diovisalvi et al., 2018). In the by-products market, pellets with PM> 36% have better prices than with lower protein (De Figueiredo et al., 2015, Dauguet et al., 2016). According to Dauguet et al. (2016), with PM of 36%, prices would be equivalent to 70% of the price of soybean pellets, while at 29% of PM, prices were equivalent to just 43%. Thus, it is essential to have methods to accurately determine NG.
The objective of work was to compare the methods of NIRS, Kjeldahl and Dumas to quantify NG in sunflower grains and to adjust models to estimate PM from NG.
MATERIALS AND METHODS
Genetic material and experimental design
Eighty-four samples of sunflower grains were selected from experiments conducted during the 2013-14 and 2014-15 growing seasons in the southeastern Buenos Aires Province (from 37°45´ S, 58°17´ W to 38°40´ S, 60°08´ W). The experiments included 14 sites and 5 N rates (0, 60, 90, 120 and 150 kg N ha-1) applied as surface-broadcasted urea at crop emergence in each site (Table 1). All sites, with different farming histories, were conducted under no-tillage system. Predominant soils are Petrocalcic Argiudoll (series fine, mixed, thermic) and Typic Argiudoll (series fine, mixed, thermic) (Soil Taxonomy) (United States, 1975) with a slope < 2%. The characteristics of this region are: mean annual rainfall of 955 mm, potential evapotranspiration of 950 mm, and mean temperature of 13.9°C. Different conventional and high oleic hybrids were sown (Table 1), but with similar characteristics: high yield potential and OG, resistant to lodging, and good behavior to diseases (ASAGIR, 2021). Planting date were within the recommended ones for each site. The experimental design was a randomized complete block with three replications. Soil analysis before sowing, as reported at Diovisalvi et al. (2018), is shown in Table. (Table 1).
Sunflower grain samples were dried in an oven at 50ºC during 24 h, milled (particle size < 1mm), and homogenized. Milled samples were dried at 60ºC until constant weight for NG analysis. The results of NG were expressed in dry basis.
Determination of NG with Kjeldahl method
Dry and milled sample (0.1 g) was placed in a 70 mL test tube, and 1.1 g of catalyzer and 4 mL of concentrated H2SO4 were added. The mixture heated in a digester (270ºC) until the sample became light green (approx. 1 h and 45 minutes). Once cold, the tubes were made up to 50 mL with distilled water and mixed. Ten mL NaOH at 45% were added to an aliquot of the sample and the mix was distilled. The distilled (35-40 ml) was recovered on 5 mL of H3BO3 indicator solution. Finally, it was titrated with H2SO4 0.005 N until the sample shifted from green to pink. The N concentration was calculated as follow:
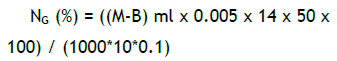
where M and B are milliliters (ml) of H2SO4 used in the titration of the sample (M) and the control (B); 0.005 is the normality of H2SO4; 14 is the equivalent weight of the N; 50 is the volume of the sample; 10 is the distilled volume; and 0.1 is the sample weight.
Determination of NG with Dumas method
Dry and milled sample (0.2 g) was burned at 950ºC using high purity oxygen (99.9%). The product of this reaction was filtered, dried and quantified using an infrared cell. This procedure was performed with an analyzer TruSpec CN (LECO, 2021). The equipment was calibrated with grains with high and low NG certified by Leco Company.

Table 1 Tabla Characterization of the experimental sites. OM: organic matter. Bray P: Bray extractable phosphorus. NO3-- N: available N content at a 0 -60 cm depth at sowing. PD: planting date. HO: high oleic. C: conventional. Caracterización de los sitios experimentales. OM: materia orgánica del suelo. P Bray: fósforo extractable. N- NO3-: contenido de N disponible a la siembra de 0-60 cm de profundidad. PD: fecha de siembra. HO: alto oleico. C: convencional.
Determination of N G with NIRS technology
The samples were measured in a Near Infrared Spectroscopy Equipment (InlabNIR TEC-NIR-256, Tecnocientífica). Milled samples were stabilized at room temperature, and individually placed in the equipment capsule. The conditions of the equipment were adjusted to read at least 115 spectrums of each sample to ensure the measurement representativeness. Each measurement took less than 60 sec. Those spectrums were average to obtain the N concentration of each sample. The NIRS equipment was previously calibrated using samples measured with the Dumas method as reference. The calibration method was carried out with 208 samples covering a N concentration range from 1.5 to 3.9% NG, and it was validated with 105 independent samples. The standard error of the prediction was 0.2%.
Grain oil extraction and determination of N in the meal
Twenty-two (22) samples were selected from the 84 sunflower grain samples, covering a wide range of NG (1.75-3.80%) according to the values obtained with the three methodologies. The samples were milled and the oil was extracted by using n-hexane (Soxhlet) at 80°C during 8 h. The defatted samples were dried at 60ºC until constant weight to eliminate the rest of solvent and NG was determined with the Dumas method. To calculate PM of the defatted samples, we used a factor of 5.3 (Jones, 1941), and considered the percentage of residual hull of 10% according to Peyronnet et al. (2012).
Data analysis
Precision (dispersion parameter) and accuracy (position parameter) were determined for each method. The precision is the proximity among results of independent determinations. It can be accessed via the repeatability, using the same procedure in a single sample, with the same operator, in short periods, using the same equipment in the same laboratory (OAA, 2008). This repeatability of the methods was assessed with the standard deviation (SD) and the variation coefficient (CV). The accuracy indicates the proximity between the average of measurements and the real value (OAA, 2008). It was evaluated with the bias (difference between the observed value and the reference value), and the percentage of relative difference (DRP) (INTI, 2021).
To determine the precision and accuracy of the methods, two sunflower grain standards with different NG were used (Leco Corp. NG-high = 3.36% and NG-low = 1.72%). The standards were measured 30 times with each methodology and the mean value, SD, CV, bias and DRP were calculated. The mean values of NG quantified with Kjeldahl, Dumas and NIRS were assessed with an ANOVA analysis with the procedure PROC GLM (R Core Team, 2021) and the Least Significant Difference (LSD, 5%).
Correlation and linear regression analysis between the methods were performed with all samples (n=84), and the intercept and slope of the regressions were compared with the 1:1 line with the Dummy method (5%). In addition, the absolute differences of the NG measurements with the three methods were plotted and compared with the concordance curve of Dumas-Kjeldahl and Dumas-NIRS using the test PetoWilcoxon (Raggio et al., 2003).
The relationship between PM and NG for Dumas, NIRS and Kjeldahl was described with lineal models. The slope and intercept of the three models were compared to asses if a unique equation could be developed to explain the relationship between PM and NG.
RESULTS AND DISCUSSION
Yield, oil and protein
Mean sunflower yield of the experiment was 3476 kg ha-1 (from 1804 to 5406 kg ha-1). These results are in accordance with those reported by ASAGIR (2021) for the southeastern Buenos Aires Province (mean yield 3692 kg ha-1) and by Zamora & Massigoge (2008) for south-central and western regions of the province (mean yield 3000-3200 kg ha-1). The average of OG was 50.7% (from 42.7 to 59.2%). These oil concentrations are higher than those reported for the Argentine National Trial Network of Commercial Sunflower Hybrids during the growing season 2016-2017 (43% to 53% ± 10%) (ASAGIR, 2021); probably because of the adequate hydric conditions of our experiments. Regardless of the methodology, NG ranged from 1.57 to 3.80% indicating that a wide range of N concentration was obtained (Figure 1). The NG of 79% of the samples (n= 66) were in the range 2-3% values in accordance with those reported by Echeverría (2008) for southeastern Buenos Aires Province (2.1 to 3.1%). Only 11% and 10% of the samples presented NG values lower than 2% or higher than 3%, respectively (Figure 1).
Precision and accuracy of each methodology
The estimation of N of the standard samples (Leco Corp. NG-high = 3.36% and NG-low = 1.72%), showed differences among methods (p < 0.05). These differences among methods could be attributed to the fact that each one determines different forms of N. Kjeldahl method only quantifies organic N, which passes into the ammonia form and is quantified as ammonium, whereas Dumas and NIRS methods also quantify other N forms. Dumas determines total N, including inorganic fractions as nitrite and nitrate (Daun & DeClercq, 1994; Simonne et al., 1997), and NIRS measures the light absorption by the sample due to bonds or protein bands (Wells, 2006). However, Dumas and Kjeldahl presented similar values for the N estimation of the standard NG-high, while both differed with NIRS (Table 2). Lanza et al. (2016) estimated total N for different types of meals and observed no differences in the estimation between Kjeldahl and Dumas. However, from the practical point of view, light differences were observed between Dumas and NIRS for NG-low (0.27%) and Kjeldahl and NIRS for NG-high (0.17%). These differences represent less than 1.5% PG, indicating that any of the tested methodologies could be satisfactorily used to quantify NG.
The NIRS method was the most precise (considering SD and CV), meaning that it had good repeatability in NG estimations. The second method was Dumas and the last one was Kjeldahl, which presented the highest CV values (Table 2). Unlike the results observed in this work, Mihaljev et al. (2015) reported that NIRS presented high relative standard deviation for estimations of N in meat and else, lower precision than Dumas and Kjeldahl which showed high precision and narrow variation. On the other hand, Blanco & Villarroya (2002) reported that the estimations with NIRS presented similar precision than other analytical methods because the sample is barely manipulated. Lanza et al. (2016) reported that the Kjeldahl method produced high deviations in the estimation of total N of food samples compared to those obtained with Dumas. According to these authors, the Kjeldahl method involves a high number of steps and factors where the error of the operator and the pre-treatment of the samples may result in a high dispersion of the results. However, in our evaluation, the CV for Kjeldahl was acceptable in all cases (< 5%).
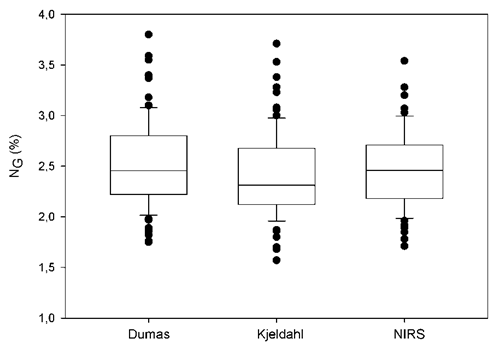
Figure 1 Figura 1 Grain Total nitrogen concentration (NG) by Dumas, Kjeldahl and NIRS methods in sunflower. Box lines are percentile 0.25, 0.50 and 0.75; whiskers are 0.10 and 0.90, and dots are 0.05 and 0.95 percentile (n= 84). Concentración de nitrógeno total en grano (NG) de girasol para Dumas, Kjeldahl y NIRS. Las líneas de cada caja son percentiles 0.25, 0.50 y 0.75; los bigotes son 0.10 y 0.90, y los puntos son percentiles 0.05 y 0.95 (n = 84).
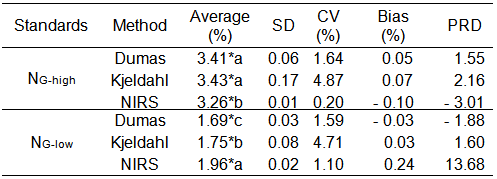
Table 2 Tabla Average (%), standard deviation (SD), coefficient of variation (CV) (%), bias (%) and percentage relative difference (PRD) for two Leco reference standards of sunflower grain with different concentration of total nitrogen (NG-high and NG- low), determined by the Dumas, Kjeldahl and NIRS methods. Promedio (%), desvío estándar (SD), coeficiente de variación (CV) (%), sesgo y diferencia relativa porcentual (PRD) para dos estándares de referencia Leco, en grano de girasol con diferente concentración de nitrógeno total (NG-alto and NG- bajo), determinado por los métodos Dumas, Kjeldahl y NIRS.
Although the NIRS method was the most precise, using both standards, the most accurate methods were Dumas and Kjeldahl, which presented lower bias and DRP than NIRS (Table 2). The NIRS tended to overestimate the N concentration of the standard NG-low and to underestimate NG-high value, probably because NIRS is an indirect method and its accuracy depends on the reference method used for calibration (Sáez-Plaza et al., 2013)
Comparison of the three methods
Figures 2a, 2b, and 2c show significant relationships between Dumas, Kjedahl and NIRS methods in determining NG. In all cases, the coefficients of determinations were higher than 0.80 and the correlation was statistically significant (p < 0.001) between the different methods. According to these results, the three methods could be used to determine NG. Esquivel-Valenzuela et al. (2018) reported that NIRS is an alternative to the traditional methods of analysis, with potential to obtain values of soil properties (e.g. organic carbon, total N) fast and with precision. Watson & Galliher (2001) reported a narrow correlation (r=0.96) between the estimations of NG of farm products (seeds, plant tissues, manure, water, etc.) with Kjeldahl and Dumas methods. Other authors reported that Dumas and Kjeldahl methods showed similar results for NG of soil and vegetable products (Simonne et al., 1997). In this study, the relationship between the NG content determined by NIRS and Dumas showed the highest degree of association (r2 = 0.93) (Figure 2a), and highest correlation coefficient (r = 0.96). The correlation between the other methods was slightly lower (r = 0.91 for Kjeldahl-Dumas, and 0.90 for NIRS-Kjeldahl).
Nevertheless, in the three relationships, the slopes between observed vs predicted data differed from 1 (p < 0.001); and the intercepts were different from 0 (p < 0.001). At high NG concentrations, the methods NIRS and Kjeldahl sub estimated NG compared to the Dumas method (Figure 2a and 2b, respectively). However, at low NG concentrations, NIRS tended to overestimate NG whereas the Kjeldahl method was similar to Dumas (Figure 2a and 2b). Jung et al. (2003) reported that the NG values of soybean by-products determined by Kjeldahl were slightly lower than those obtained with Dumas. Similar results were obtained by Daun & DeClercq (1994) in oleaginous grains (canola, soybean and sunflower), attributing that differences among methods to the inability to use

Figure 2 Figura 2 Relationship between grain total nitrogen concentration (NG) in sunflower determined by a) NIRS and b) Kjeldahl with respect to Dumas and, c) NIRS with respect to Kjeldahl. Dotted line equals the 1: 1 line. n = number of cases. Relación entre la concentración de nitrógeno total en grano (NG) de girasol determinada por a) NIRS y b) Kjeldahl con respecto a Dumas y, c) NIRS con respecto a Kjeldahl. La línea punteada es igual a la línea 1: 1. n = número de casos.
mercury as catalyzer in the Kjeldahl method. Watson & Galliher (2001) observed that the correlation between Kjeldahl and Dumas method improved to 0.99 when the samples with high nitrate concentrations were excluded. Simonne et al. (1997) observed that in products with high nitrate concentration, the Dumas method showed higher values of N because this method quantifies inorganic N form not quantified by Kjeldahl. So, for NG concentrations of sunflower grains lower than 3% approximately (Figure 2a and 2b), and considering that the most usual N concentrations in these grains are between 2.1 and 3.1% (Echeverría, 2008), NIRS or Kjeldahl methods could be a trustworthy alternative as they predict similarly to Dumas method.
On the other hand, when comparing NG determined by NIRS with respect to Kjeldahl, NIRS over- and under-estimated NG at low and high N concentrations, respectively (Figure 2c). Similar results were observed with NIRS compared to Dumas method (Figure 2a). Acuña (2005), in a study predicting the nutritional composition of foods by NIRS, pointed out that the high levels of error were a consequence of a weak relationship between the NIRS prediction and the reference values, since the data were overestimated and underestimated by the NIRS technique. Vivar (2009) comparing the protein values of hydrolyzed feather meal determined by NIRS with respect to Kjeldahl observed that the NIRS tended to underestimate and overestimate these values. Other researchers reported that this behavior could be explained because NIRS and Kjeldahl quantify different characteristics.
The concordance of the NIRS and Kjeldahl methods with Dumas from absolute differences is shown in Figure 3. NIRS presented higher agreement level with Dumas than Kjeldahl (p< 0.05). Considering a tolerance limit of 0.20%, the agreement between Dumas-NIRS and Dumas-Kjeldahl was of 90% and 60%, respectively (Figure 3). Moreover, NIRS presented a better perform respect Kjeldahl for the whole range of comparison. Therefore, NIRS could be a reliable alternative to Dumas, given the high concordance with this reference method in the determination of NG respect to Kjeldahl. In addition, NIRS has the advantage of being a low-cost method compared to Dumas (Velasco et al., 2004).
The NIRS method, presents greater accuracy, does not use chemical products, does not generates toxic waste, demands little time to analysis, it is simple and it is a non-destructive or invasive technique since it requires a minimum preparation of the sample (Blanco & Villarroya, 2002; Bosco, 2010). In addition, NIRS allowed the determination of oil concentration and fatty acid composition simultaneously with NG, representing an additional advantage over the other methodologies (Blanco & Villarroya, 2002; Velasco et al., 2004).
Figure 3 Figura 3 Discordant proportion of observations between Dumas-NIRS and Dumas-Kjeldahl. The dotted line indicates the proportion of discordance for an absolute difference between methods of 0.20. Proporción de discordancia de observaciones entre Dumas-NIRS y Dumas-Kjeldahl. La línea punteada indica la proporción de discordancia para una diferencia absoluta entre los métodos de 0,20.
Estimation of P M
The PM under the dehulling conditions, as described in materials and methods section, was estimated from NG concentrations determined by each of the methodologies (Figure 4). The NG explained 59%, 67%, and 57% of the variation in PM values for Dumas, NIRS and Kjeldahl, respectively (Figure 4a, b and c).
In addition, comparing the three models, the slopes and the intercepts were similar, thus a single model explained the relationship between PM and NG (r2 = 0.60) (Figure 4 d). For PM estimations, it is important to define the dehulling and oil extraction conditions, as the relationship between NG and PM will vary according to the oil and hull remains in the meal. The NIRS could be a better alternative to the other methods, mainly because it is fast and inexpensive. This would be of great importance within the market for the commercialization of by-products since the estimation of PM would indicate the quality of pellets. Grains with 2.1% of NG would result in by-products with 36% protein, and else, differential prices in the market (de Figueiredo et al., 2015; González-Pérez, 2015; Dauguet et al., 2016). Moreover, although any of the three methods could be used to determine NG and estimate PM, the
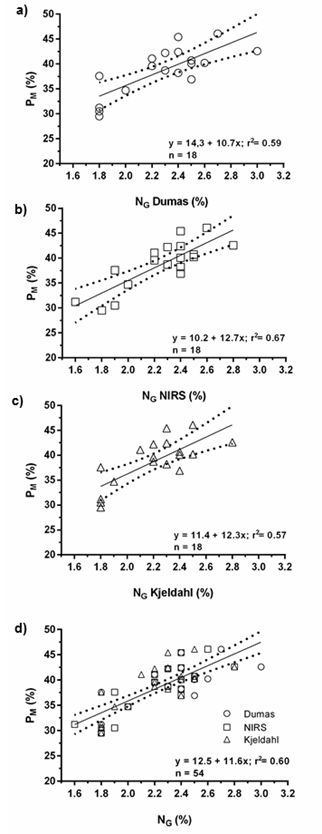
Figure 4 Figura 4 Relationship between the percentage of protein in byproducts (PM) and total grain nitrogen (NG) in sunflower determined by a) Dumas, b) NIRS, c) Kjeldahl and d) the three methodologies (global model). n = number of cases. Dotted lines indicate the 95% confidence interval. Relación entre el porcentaje de proteína en subproductos (PM) y el nitrógeno total de grano (NG) de girasol determinado por a) Dumas, b) NIRS, c) Kjeldahl y d) las tres metodologías (modelo global). n = número de casos. Las líneas punteadas indican el intervalo de confianza del 95%.
NIRS has the advantage of being a fast, economic, non-toxic, accurate and a precise method.
CONCLUSIONS
NIRS was the most precise method for the determination of NG, while Dumas and Kjeldahl were the most accurate methods. In addition, NIRS presented a greater degree of agreement with Dumas than Kjeldahl.
The PM value might be estimated from NG independently of the methodology. Although further studies are necessary to validate the proposed methods and models, they represent a significant advance to estimate PM, a character that determines the quality of by-products of the oil industry.

