Services on Demand
Journal
Article
Indicators
-
 Cited by SciELO
Related links
-
 Similars in
SciELO
Share
Revista de Ciencia y Tecnología
On-line version ISSN 1851-7587
Rev. cienc. tecnol. no.18 Posadas Jul./Dec. 2012
INGENIERÍA-TECNOLOGÍA-INFORMÁTICA
Regional analysis of the german power grid regarding the increasing penetration of photovoltaic distributed generation
Análisis regional de la red eléctrica de Alemania en relación con la creciente penetración de generación solar fotovoltaica distribuida
Andrés G. Sanchez1; Adriel M. Rizzato Lede2; Gunnar Bärwaldt3; Marcelo G. Molina1
1. CONICET, Instituto de Energía Eléctrica, Universidad Nacional de San Juan, San Juan, Argentina.
2. Instituto de Energía Eléctrica, Universidad Nacional de San Juan, San Juan, Argentina.
3. Institut für Hochspannungstechnik und Elektrische Energieanlagen, Technische Universität Braunschweig, Brunswick, Alemania
. Andrés Germán Sanchez1 Ingeniero Eléctrico graduado en la Facultad de Ingeniería -FIde la Universidad Nacional de San Juan -UNSJ-; Estudiante de Posgrado del Programa de Doctorado en Ingeniería Eléctrica de la FI de la UNSJ; Becario del CONICET en el Instituto de Energía Eléctrica -IEE- de la FI de la UNSJ; gsanchez@iee.unsj.edu.ar
. Adriel Rizzato Lede2 Ingeniero Eléctrico graduado en la FI de la UNSJ.
. Gunnar Bärwaldt3 Licenciado en Ingeniería Industrial (Dipl.-Wirtsch.-Ing.) graduado en la Universidad Técnica Carolo-Wilhelmina de Braunschweig (Technische Universität Carolo-Wilhelmina zu Braunschweig -TU Braunschweig-); Investigador dentro del Instituto Tecnológico de Alta Tensión y Sistemas Eléctricos de Potencia (Institut für Hochspannungstechnik und Elektrische Energieanlagen -elenia-) de la TU Braunschweig; g.baerwaldt@tu-braunschweig.de
. Marcelo Gustavo Molina1 Doctor en Ingeniería Eléctrica graduado en la FI de la UNSJ; Investigador Asistente del CONICET; Profesor y Consultor en el IEE de la UNSJ; mgmolina@iee.unsj.edu.ar
Abstract
The grid integration of photovoltaic (PV) solar generation systems has become the most important application of PV systems, gaining interest over traditional stand-alone systems. This trend is being increased mainly because of the strong support provided by governments of different countries, as investment subsidies and incentives that establish an economically attractive feed-in tariff (FIT) on power generated from this renewable energy source (RES). In Germany, this situation has caused the increase of the installed PV generation capacity in recent years. High penetration levels of this intermittent energy source can affect many aspects of the electric grid, and might cause undesirable effects, particularly in those moments when generation exceeds the load with reverse power flow through lines and transformers. This situation can be aggravated by the demographic behavior of some regions in Germany, with a population decreasing tendency affecting the load. This paper aims at analyzing the impact of the increasing penetration of PV generation on the grid, for the different regions in Germany, and its future behavior.
Key words: Distributed generation (DG); Renewable energy source (RES); Photovoltaic (PV) generation; Transmission system operator (TSO); Feed-in tariff (FIT); German electric grid.
Resumen
La generación solar fotovoltaica (FV) se ha implementado en dos formas representativas, como plantas de gran potencia y como generación distribuida, esta última ha crecido notablemente en la última década. La principal razón es el resultado de los sistemas de tarifas adoptados por países desarrollados. Alemania es uno de los países que mayor crecimiento ha experimentado, estableciendo un sistema de tarifas (feed-in) que hace económicamente atractiva la generación eléctrica a partir de fuentes de energía renovables (FERs). La capacidad instalada de generación FV en Alemania creció vertiginosamente, lo que podría traer problemas en la red por el exceso de generación. Un agravante a estos problemas es el comportamiento demográfico presente en Alemania, el cual tiende a decrecer en algunas zonas. Cuando la generación supera la carga se presentan efectos indeseados en la red, como por ejemplo los flujos inversos en las líneas y transformadores. En este trabajo se desarrolla un análisis a futuro de la situación en Alemania en relación con la generación FV y la carga, planteado diferentes escenarios posibles. El objetivo es determinar si existirá exceso de generación y en qué zonas.
Palabras clave: Generación solar fotovoltaica (FV); Generación distribuida (GD); Operador del sistema de transmisión (OST); Sistema de tarifa feed-in; Análisis regional de la red eléctrica alemana; Penetración de generación FV en la red; Ley de fuentes de energías renovables (LFER) en Alemania.
INTRODUCTION
During the last decades, the leading countries have strongly impelled the development of renewable energy sources (RES), mainly driven by energetic factors (petroleum crisis), ecological reasons (climate change) and financial and market regulation restrictions. Thus, countries like Germany, Japan, Spain and USA have made significant progresses on renewable and sustainable energy technologies, being wind generation and solar photovoltaic (PV) generation the most important applications [1].
The grid integration of RES applications based on photovoltaic solar systems has become the most important application of PV systems, gaining interest over traditional stand-alone systems. This trend is being increased mainly because of the many benefits of using RES in distributed generation power systems and due to the strong support provided by governments of different countries, as investment subsidies and incentives that establish an economically attractive feed-in tariff (FIT) on power generated from this RES.
In Germany, the FIT system began by the year 2000. The FITs are lucrative for the households and businesses with grid-connected PV solar systems. The German Renewable Energy Act (Erneuerbare-Energien-Gesetz, EEG) sets the bases of this market, in which households and businesses get to sell all of their PV solar power to the utility grid at attractive and guaranteed FIT rates for 20 years from the date of installation. Even though these rates are declining every year, the impact of the EEG has been dramatic. Germany's installed capacity of PV generation increased up to 435 MW in 2003, 1 960 MW in 2005, 4 060 MW in 2007, reaching 15 570 MW by October 2010 [2].
Generally, grid-connected PV generators can provide significant benefits to the power system, depending on the characteristics and operating conditions of the distribution (and transmission) network, and their allocation within it. The most important potential benefits are smoothing of demand peaks when there is a certain overlapping between the PV generation profile and the consumption demand profile, decreasing the transmission and distribution losses, voltage regulation and reactive power compensation on distribution feeders, among others.
However, high penetration levels of this intermittent energy source can affect many aspects of the electric grid, including the quality of supply, operation security, market regulation, etc., if they are not properly planned.
Moreover, the problems related to quality of supply and operation security could be aggravated under determined load profiles dependant on regional population characteristics, such as the remarked decreasing of population's tendency in some regions of Germany. Paradoxically, in these regions there is a growing amount of Grid-connected PV systems, which can cause undesirable effects on the distribution and transmission system, particularly in those moments when generation exceeds the load, with reverse power flow through lines and transformers.
Theoretical framework
Gross electricity production in Germany
Germany is a country heavily dependent on brown and hard coal to produce its electricity. Those two types of coal produced more than 40% of the total electricity in 2008. The next large source of electricity is nuclear energy, with an amount of 20% in 2008. The bulk of the additional production came from natural gas and wind plants followed by biomass.
Another pillar of electricity production is third party power plants. Due to the EEG, this production sector has grown rapidly, reaching amounts of approximately 10% in 2008 [3].
German transmission system operators
There are four Transmission System Operators (TSOs) in Germany: TenneT, Amprion, EnBW and 50Hertz, which are responsible for the operation, maintenance and further development of the electricity transmission network with voltage levels of 220 kV and 380 kV. Their control areas are shown in Figure 1.

Figure 1. Electrical regions and Transmission System Operators of Germany.
Renewable Energy Sources Act
The legislation of the Renewable Energy Sources Act came into force in 2000 and was amended in 2004. It is successor to the 1991 Electricity Feed Act (Stromeinspeisungsgesetz, StrEG) which back in the 1990s gave important impetus for the expansion of renewable energy sources, especially wind generation [4].
The goal of the EEG is to speed up the market launch of technologies for electricity production from wind, solar, biomass, geothermal power and hydropower, as well as mine gas. The core element of the legislation is the duty of grid operators to give priority to electricity from renewable energy sources, and to pay for it according to fixed tariffs [5]. The EEG guarantees each plant operator a fixed tariff for electricity generated from renewable sources which is fed into the public electricity grid. The tariff paid is basically dependent on the technology used, the year the installation was put into operation and the size of the plant. Each grid system operator is obliged to pay the statutory tariff to the plant operator.
In the EEG, the tariffs for electricity fed into the grid are fixed for a period of 20 years, plus the year it was taken into operation. The fee paid depends on the defined tariff in the year the equipment was installed. A location-specific fee was formulated for the first time in the 2004 law amending the EEG. The focus is clearly on the expansion of photovoltaic installations on buildings and those built into their facades.
The EEG has caused an undreamed boom in renewable energy sources. Within just a few years an autonomous, highly dynamic and efficient industry has come into being in Germany which covers the entire value-added chain. This is extremely remarkable, particularly in view of the radical structural shift from an industry to a service location which Germany has undergone over the past few decades.
Impacts of PV distributed generation on distribution networks.
Photovoltaic distributed generation (PV-DG), although still having a much lesser impact than other RES-based DG technologies, is increasingly being embedded into electricity distribution networks worldwide within the framework of successful regulatory state and marketing programs [6].
In a traditionally designed electricity distribution system, the power is assumed to be fed at the highest voltage level and consumed at the lower voltage levels. With the growing penetration of DG technologies, the power flow has become more complicated, and undesirable overvoltage situations in low voltage (LV) distribution systems might occur under particular circumstances (e.g. low load demand coincident with considerable DG generation).
Studies carried out within the framework of the International Energy Agency (IEA) PV Power Systems Program have shown the possibility that when a large number of PV systems are connected to voltage-regulated distribution lines, the voltage at the customers terminals can increase because of reverse power flow situations, with the increase depending up on the relative sizes of the load and PV generation [7].
There are other effects that have traditionally been considered a potential concern by the electricity industry, covering current and power effects arising from the individual or multiple operations of grid-connected PV systems, which are not mentioned in this work.
Development
Demographic analysis of Germany
The population of Germany, monitored by the "Statistisches Bundesamt" (Federal Statistical Office of Germany), is approximately 81 545 000, becoming it the 14th most populous country in the world. Germany's population is characterized by zero or declining growth, with an ageing population and smaller cohort of youths.
On 31 December 2009, Germany had about 81 802 000 inhabitants. That was 200,000 or 0.2% less than a year earlier. A study made by the Federal Statistical Office of Germany [8], reflects that in the following years, the population will further decrease. If the demographic situation continues to develop along current lines, the population will drop from about 82 million at the end of 2008 to approximately 65 million (lower limit of the "medium" population) or 70 million (upper limit of the "medium" population) in 2060.
In the present paper, it was assumed that the current demographic tendency will remain constant in the future, and based on historical data, projections of population were made using an average intercensal rate. In this way, the forecasted population in years 2010, 2020, 2030 and 2050 was appropriately calculated in every district of each electrical region of Germany.
Load estimation
Load data was obtained from each TSO [9-12], and consists of 15 minutes intervals for every day of the month. The evolution of the demographic characteristics is supposed to affect directly the electrical demand, and as the population is reducing every year, it is expected that the load would follow a similar behavior. In this sense, future energy consumption is estimated using a load per capita, which is obtained from dividing each 15 minutes interval of a representative "medium" day of each month (year 2010), into the number of inhabitants for that year. Thus, medium load profiles were done for every month from January 2010 to December 2010, for every district belonging to each electrical region.
The medium load profile for each month was calculated as an average of load in every 15 minutes interval (96 intervals a day), considering all days of the month. Using the medium load profiles, it is possible to estimate the future load, multiplying the medium load per capita of a certain month and a specified TSO, by the population of each district in the year under study. In this way, the district's load for every month of the year in every electrical region was estimated for the years 2020, 2030 and 2050. The future load is directly correlated to the demographic situation of the region, and therefore different regions presented different tendencies.
PV Power installed capacity - Present situation and future scenarios.
Based on the regional available data and trough estimations it was possible to approximate the current PV installed capacity distribution along the country. On October 2010, the total PV installed capacity was around 15 GW, and the district with the biggest PV capacity was Stuttgart, with 295 MW (EnBW TSO).
Regarding future estimations, Germany has already set a tough green target for 2050, and the goal is to gain 80% of the electricity from wind, solar and other renewable sources [13]. The Germany's National Renewable Energy Action Plan (NREAP) has its own target, reaching 52 GW by 2020. The SRU, the German Advisory Council on the Environment, told the Bundestag that 100 per cent of Germany's electricity could come from renewable sources by 2050. To be completely self-sustaining at that level, studies say Germany would need to rely on expensive options such as geothermal electricity generation, a further expansion in PV capacity up to about 110 GW, the use of more solid biomass and a massive increase in energy storage capacity.
Taking into consideration the former statements, PV installed capacities of 52 GW in 2020 and 110 GW in 2050 are adopted as the expected installed capacities in the current study. Three different future scenarios are used, lying on different hypothesis. In Scenario 1, future installed capacity is thought to become uniformly distributed throughout Germany, with the same installed power per square kilometer in every district. In the second scenario (Scenario 2), it is assumed that the current installation rates (for every district) will remain in the future, reaching in total 110 GW in 2050. Finally, Scenario 3 predicts a PV installed capacity behavior linked to the population, with an initial forecast of one kilowatt (peak, at standard test conditions) per inhabitant [14], adapted to reach the 2050's goal.
Power PV feed-in - Normalized profiles.
As done with the load data, PV feed-in data was obtained from each TSO [9-12], consisting of 15 minutes intervals for every day of the month, from January 2010 to October 2010. The medium feed-in profile for each month was calculated as an average of power in every 15 minutes interval (96 intervals a day), considering all days of the month.
Normalized profiles were used to get a complete set of curves for every TSO region, and thus to estimate the future PV feed-in, for the forecasted years (2020, 2030 and 2050). The normalized profiles were calculated using the feed-in and installed capacity data of 2010 for 50Hertz, TenneT and Amprion. It is worth mentioning that no differences among districts were considered, using a unique normalized profile for each electrical region. It is supposed that weather conditions, irradiation, temperature and other parameters affecting PV generation, are uniform within a region. The missing data made impossible to build the normalized profiles for every month and TSO (e.g. EnBW), so it was assumed that neighbor regions have a similar normalized profile.
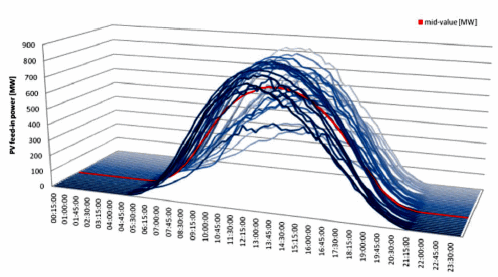
Figure 2. Medium PV feed-in profile, July 2010 - Region: 50Hertz.
Figure 3 depicts the normalized profiles for each month, referred to the most complete data set available on the sources (50Hertz) [15].
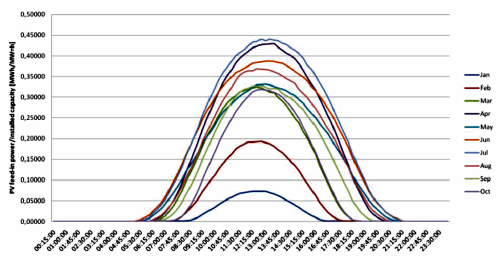
Figure 3. Monthly normalized profiles (50Hertz)
Using these normalized profiles and the estimated PV installed capacity, it was possible to estimate the future PV feed-in for every district of each region, according to the proposed scenarios. The following figure shows the resulting forecasted PV feed-in for a particular month and district, for scenario 1.
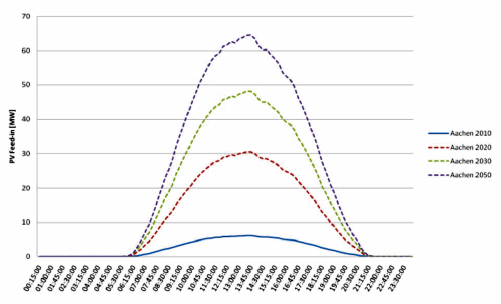
Figure 4. Estimated PV feed-in. Aachen, July. TSO: Amprion. Scenario 1.
Pv feed-in and load balance.
PV feed-in has several benefits, especially when there is a certain overlapping between load and PV generation, reducing the load peak. This situation is shown in Figure 5. However, low load demand coincident with considerable DG generation in certain regions may cause many problems. According to scenario 1, in July 2050 PV feed-in would be more than twice the load demand power, what shows the seriousness of the presented condition (see Figure 6).
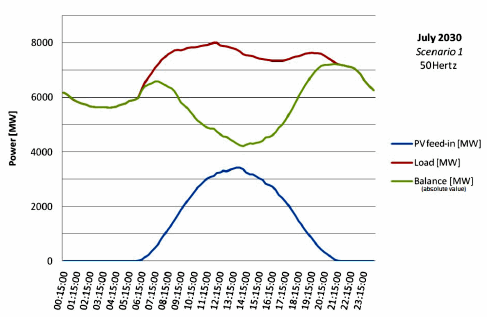
Figure 5: Load, PV feed-in and Balance curves. Forecast: July 2030, 50Hertz region, Scenario 1.
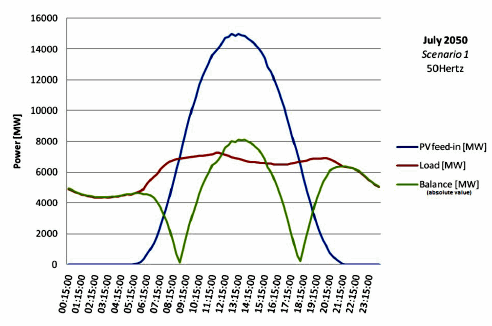
Figure 6. Load, PV feed-in and Balance curves. Forecast: July 2050, 50Hertz region, Scenario 1.
Load and feed-in values were compared to get an approach of the present and future situation by counting the number of 15 minutes intervals in which feed-in power exceeded load. This analysis was made for every typical day of each month of the years under study (2010, 2020, 2030 and 2050), and following the three proposed scenarios. The results were divided into 5 intervals of 0 hours, 0 to 1 hour, 1 to 7 hours, 7 to 16 hours, and more than 16 hours of district PV feed-in exceeding local load. Major results are shown in Figures 7 through 8, where five colors were employed to represent the former intervals in colored maps.
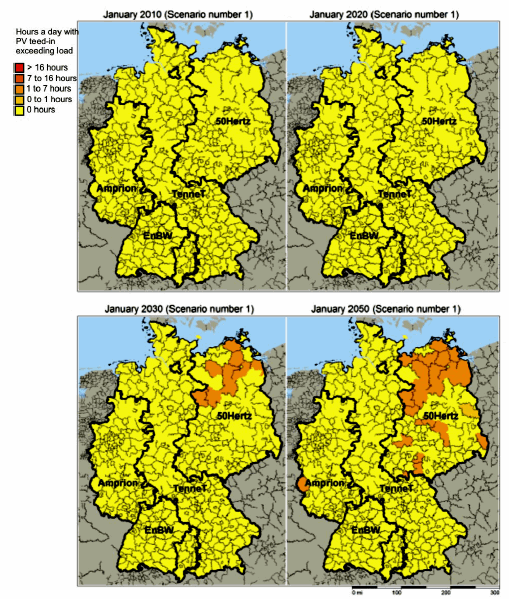
Figure 7. Evolution of the balance between PV feed-in and load. January, Scenario 1.
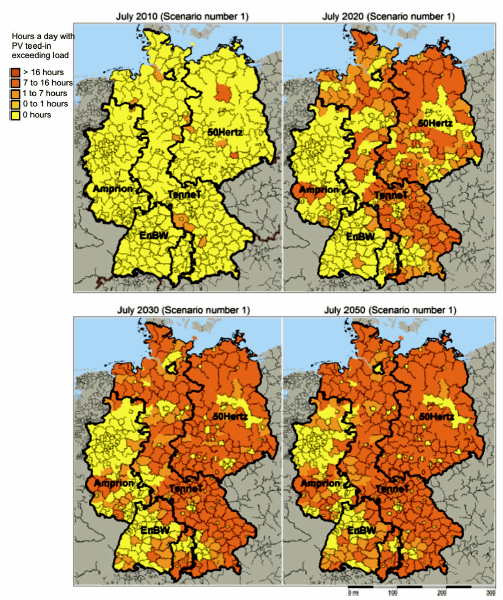
Figure 8. Evolution of the balance between PV feed-in and load. July, Scenario 1.
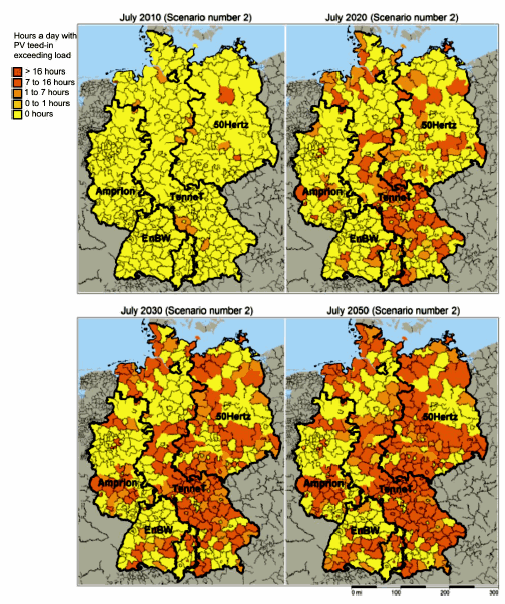
Figure 9. Evolution of the balance between PV feed-in and load. July, Scenario 2.
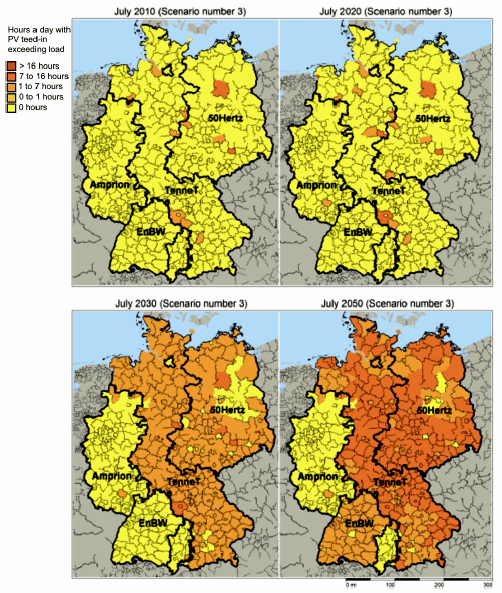
Figure 10. Evolution of the balance between PV feed-in and load. July, Scenario 3.
Conclusions
Based on real data gathered from the different TSO's as well as other official sources, it was evaluated the existence of major problems tied to the excess of PV generation by making a balance between load and PV feed-in in different districts of Germany. Nowadays, they do not seem to be problems.
For the forecasted years it was found that there would be excess of PV feed-in compared to load demand for all of the proposed scenarios from 2020 onwards, with greater incidence during summer months, such as July. The electric regions that presented more districts with excess of generation were mainly those belonging to TenneT and 50Hertz, while EnBW and Amprion only had a few of them.
Finally, it is concluded that it is strongly necessary to enclose the increase of PV installed capacity in Germany with appropriate grid studies, and to provide effective solutions to avoid further problems in the electric system.
1. Rahman S., Going green: the growth of renewable energy, IEEE Power & Energy Magazine, 1, 6, pp. 16-18, 2003. [ Links ]
2. PHOTON Europe GmbH. http://www.photon.de, July 2010. [ Links ]
3. Statistisches Bundesamt, Destatis. http://www.destatis.de, June 2010. [ Links ]
4. Bärwaldt G., The Influence of Renewable Power Generation on the Power Transmission Network of Germany, Proc. 3rd International Conference "The European Electricity Market. EEM-06", Warsaw, Poland, May 2006. [ Links ]
5. Federal Ministry for the environment, Nature Conservation and Nuclear Safety (BMU), EEG: The Renewable Energy Sources Act, Berlin, Germany, July 2007. [ Links ]
6. Caamaño-Martín E., Laukamp H., Jantsch M., Erge T., Thornycroft J., De Moor H., Cobben S., Suna D., and Gaiddon B., Interaction between Photovoltaic Distributed Generation and Electricity Networks, Progress in Photovoltaics: Research and Appl., pp. 629-643, 2008. [ Links ]
7. Eisenreich M., Balzer G., Backes J. and Maurer B., Integration of PV systems into low voltage networks using standard load profiles, Proc. International Conference on Renewable Energies and Power Quality, Granada, Spain, March, 2010. [ Links ]
8. Federal Statistical Office (Statistisches Bundesamt), Germany's Population by 2060, Wiesbaden, Germany, Nov. 2009. [ Links ]
9. TenneT TSO . http://www.tennet.eu. 2011. [ Links ]
10. Amprion GmbH TSO. http://www.amprion.net, April 2011. [ Links ]
11. EnBW AG TSO. http://www.enbw.com, April 2011. [ Links ]
12. 50Hertz Transmission GmbH TSO. http://www.50hertz-transmission.net, 2010. [ Links ]
13. Power-Gen Worldwide. Germany sets a tough green target for 2050. http://www.powergenworldwide.com, May 2011. [ Links ]
14. City Population. http://www.citypopulation.de/ Deutschland, June 2010. [ Links ]
15. Monthly total PV installed capacity in Germany. http://www.polderpv.nl, 2011. [ Links ]
Recibido: 11/06/2012
Aprobado: 07/10/2012


