


 English (pdf)
 Article in xml format
 Article references
 Send this article by e-mail
 Cited by SciELO
  Similars in
SciELO
Similars in
SciELO 
 Permalink
INTRODUCTION
The human oral cavity is a unique ecosystem with a great variety of ecological niches that can be colonized by microorganisms, including yeasts 1 . The advent of techniques based on DNA sequencing has enabled phylogenetic recognition of yeast species considered cryptic phylogenetically close. They were Candida albicans, Candida dubliniensisand Candida africana 2, 3 .
Correct identification of these cryptic species in a clinical setting is relevant from an epidemiological and medical standpoint, and to better understand evolution of antifungal resistance. Moreover, rapid identification is crucial to clinical treatment of local or systemic candidiasis. There are different phenotypic methods for distinguishing species, but they are laborious, time-consuming and do not provide definitive confirmation. In contrast, molecular methods are currently considered the gold standard since, unlike phenotypic methods, they provide appropriate sensitivity and specificity. 4,5, 6 There are still limitations associated with rupture of yeast walls to release gDNA for amplification. Due to the complex structure of fungal cell wall, it is difficult to produce cell lysis, which limits the sensitivity of PCR assays. In addition, the fungal load of Candida spp. in colonized sites is relatively low 7 . With the advent of commercial extraction kits, quality and quantity of DNA obtained has greatly improved. However, not all low-complexity laboratories can afford to purchase them for routine diagnosis.
In our experience, C. dubliniensis has been the species most frequently recovered from oral samples, probably due to the selective pressure caused by the administration of antifungal agents, since C dubliniensis has higher susceptibility profiles than C albicans. In order to identify these species correctly, we needed to find a simple method for rupturing the cell wall 4, 8 .
The aim of this study was to compare the performance of different methods for extracting gDNA from Candida albicans and Candida dubliniensis, subsequently amplifying DNA by PCR and Real Time PCR for correct molecular identification.
MATERIALS AND METHODS
This study analyzed 52 Candida albicans and Candida dubliniensis isolates obtained from subgingival biofilm from patients living with HIV with clinical signs of periodontal disease 10 , who were under high-activity antiretroviral treatment (HAART) but were not receiving antibiotic or antifungal treatment 4, 8 . Informed consent was obtained according to the Declaration of Helsinki. The project and informed consent were approved by the Facultad de Odontología, Universidad de Buenos Aires (FOUBA) Ethics Committee, 023/2019-CETICA-FOUBA.
All diagnoses and treatments were conducted at the periodontics service of the High-Risk Patients Oral Care Unit (CLAPAR I), Facultad de Odontología, Universidad de Buenos Aires; Hospital general de agudos Dr. Juan A. Fernández”, and Hospital de Infecciosas Francisco Javier Muñiz. Patients voluntarily signed an Informed Consent after receiving an explanation of dental practices and benefits of participating in the protocol. Subgingival biofilm samples were collected using the protocol described by Gliosca et al. 8 .
Phenotypic methods were compared with molecular ones to identify the isolations at species level.
Phenotypic methods
Samples were seeded on CHROMagar Candida® at 37 °C, 48 h in aerophilic conditions for presumptive identification of Candida albicans, Candida dubliniensis and Candida africana 11 . Green colonies were isolated on Sabouraud Dextrose Agar (SDA) at 37 °C, 24 h in aerophilic conditions to perform phenotypic identification tests.
Microcultures were done on:
a) Milk agar with 1% tween 80 for germ-tube production at 37 °C, 3h, and pseudomycelium-mycelium and chlamydospores at 28 °C, 48 h. 12, 13
b) Cornmeal agar with 1% tween 80 for formation of pseudomycelium-mycelium and chlamydospores at 30 °C, 48 h. 14
c) Staib agar to assess morphology of colonies and chlamydospores at 30 °C, 72 h 15 .
Growth capacity at 45 °C and in hypertonic medium were determined on SDA 48 h 16, 17 , and SDA with NaCl 6% at 37 °C, 96 h 18 .
gDNA extraction methods
Six different methods were evaluated to determine their performance in obtaining C. albicans and C. dubliniensisgDNA. In all cases (in-house and commercial kits), a single colony was taken from a 24-hour fresh culture on yeast peptone dextrose agar (YPD) to obtain the fUngal gDNA. The spectrometric quantification of gDNAs was measured by triplicate in Nanodrop Biotek® and their quality was estimated considering the ratio of the readings at 260/280 nm (acceptable values between 1.7 and 2.0). Pure DNA concentrations were normalized to 1 ng/pl for use in all PCR reactions.
In-house cell disruption methods
-
MET 1
A single colony was suspended in 100 pl of ddH2O (double distilled water), heated at 100 °C for 15 minutes, centrifuged at 14,000 g for 3 minutes, and the supernatant was used subsequently.
-
MET 2:
A single colony was suspended in 100 pl of ddH2O supplemented with zymolase 1000 U Zymoresearch®, incubated at 37 °C for 60 minutes, centrifuged at 14,000 g for 3 minutes, and the supernatant was separated to be used subsequently.
-
MET 3:
A single colony was suspended in 100 pl of ddH2O, twofold heating (100 °C) and freezing (-20 °C for 2 minutes), followed by centrifuge at 14,000 g for 3 minutes, and the supernatant was used subsequently 19 .
-
MET 4
The method described by Marko LSoke et al. 20 was applied, using lithium acetate (LiOAc) and dodecyl sodium sulfate (SDS) 1% to disrupt the cell wall.
Commercials kit methods
-
MET 5:
Yeast Genomic DNA Kit (Zymo Research®) was used following the manufacturer’s instructions.
-
MET 6:
Presto TM Mini gDNA Bacteria (Geneaid®) was used following the manufacturer’s instructions, but with some adaptations to enable it is used with oral samples and to recover both bacteria and yeasts. Zymolase 1000 U Zymoresearch® was added in the lysis step, incubating at 37 °C for 60 minutes; 20 pl of proteinase k was added, incubating at 60 °C for 20 minutes and eluting twice in a final volume of 75 pl.
Molecular amplifications
For all 6 extraction methods, two PCR amplification techniques were used: PCR and Real Time PCR (qPCR).
Multiplex qPCR of the ITS regions
Two species-specific primers derived from the internally transcribed spacer (ITS) region (comprising the ITS1, 5.8s rRNA and ITS2 regions) were used as described by Asadzadeh et al. 21 with some modifications according to Dubois et al. 20 20 4 . Master mix was adjusted to 2X SYBR Green Supermix in a 10 pl final volume, 10 pM of each primer, and 1 pl of gDNA, in a thermal cycler CFX96 C1000 Touch (BioRad®). Cycling conditions consisted of denaturation at 95 °C for 5 minutes, followed by 39 amplification cycles at 95 °C for 15 seconds, 60 °C for 30 seconds, 65 °C for 5 minutes, and 95 °C for 5 minutes. Amplification process was evaluated using MCA (melting curve analysis) for C. albicans 86 °C (+0.5) and C. dubliniensis 82 °C (+ 0.5).
Multiplex PCR of HWP1 gene
To optimize the HWP1 gene detection strategies, concentrations and final volume of protocol described by Romeo 2008 22 were adjusted in a final reaction of 25 pl: Buffer 10X, dNTPs 0.2 mM each, primers 25 uM each.
Similarly, performance was evaluated for two different polymerases (PFU polymerase DSBIO 2.5 U/pl and EasyTaq® DNA Polymerase U/pl, with added SO4 Mg++ 20mM), gDNA 1 pl in a thermocycler Aeris-BG096 (Esco Micro®). Cycling conditions consisted of denaturation at 95 °C for 5 minutes, followed by 30 amplification cycles at 94 °C for 45 seconds, 58 °C for 40 seconds, 72 °C for 60 seconds, and 72 °C for 10 minutes. PCR amplification products were separated by electrophoresis using 1.3% agarose gel in 1X TAE buffer with GelGreen™ (Biotium®) and visualization was performed using the Gel DocTM XR + Imaging System (Biorad®). Presence of alleles of the HWP1 gene was evaluated according to size of fragments for C. albicans, one of them of 941 bp fragment being homozygous for wild-type HWP1-1 allele, an other of 839 bp fragment being homozygous for novel/rare HWP1-2 allele, and the last one with two fragments of 941 and 839 bp being heterozygous for HWP1-1/ HWP1-2 allele 22, 23 .
For both phenotypic and genotypic identification, reference strains of C. albicans ATCC 10231 and C. dubliniensis CD36 were used as positive controls, and C. parapsilosis ATCC 22019 as negative control.
Statical analysis
For all isolates, an analysis of variance (ANOVA)
was performed for the 6 extraction methods and Tukey’s post hoc was applied when the results were statistically significant. In addition to means and standard deviation, the standard error and 95% confidence interval were calculated.
RESULTS
In this study, 52 yeast isolates were identified by PCR and qPCR, of which 16 were C. albicans and 36 were C. dubliniensis.
Five replicates of each gDNA extraction method were performed per isolate. Tukey’s post hoc, mean concentrations, their respective standard deviation (std) and the standard error for all methods are shown in Tables 1 and 2.
Table 1 Disruption techniques
|
n=5 replicates |
gDNA |
||
|---|---|---|---|
|
C. albicans |
C. dubliniensis |
||
|
mean CC ng/ul ± SD |
mean CC ng/ul ± SD |
||
|
Heating |
MET 1 |
4.50 ± 0.98 |
4.75 ± 0.78 |
|
Zymolase- ddH₂O |
MET 2 |
58.00 ± 0.81 |
73.22 ± 0.87 |
|
Heating-freezing |
MET 3 |
4.25 ± 0.98 |
3.09 ± 0.96 |
|
LiOAC / SDS |
MET 4 |
39.75 +0.87 |
35.75 +0.92 |
|
Kit Zymo Research® |
MET 5 |
26.45 +0.42 |
34.58 +0.33 |
|
Kit Geneaid® |
MET 6 |
22.36 +0.28 |
24.25 +0.32 |
Table 2 Molecular techniques
|
C. albicans (n=16) |
C. dubliniensis (n=36) |
||
|---|---|---|---|
|
Frequency (%) |
Frequency (%) |
||
|
MET 1 |
PCR |
0 (0.0%) |
36 (100.0%) |
|
qPCR |
16 (100.0%) |
36 (100.0%) |
|
|
MET 2 |
PCR |
16 (100.0%) |
36 (100.0%) |
|
qPCR |
16 (100.0%) |
36 (100.0%) |
|
|
MET 3 |
PCR |
8 (50.0%) |
0 (0.0%) |
|
qPCR |
16 (100.0%) |
36 (100.0%) |
|
|
MET 4 |
PCR |
16 (100.0%) |
36 (100.0%) |
|
qPCR |
16 (100.0%) |
36 (100.0%) |
|
|
MET 5 |
PCR |
16 (100.0%) |
36 (100.0%) |
|
qPCR |
16 (100.0%) |
36 (100.0%) |
|
|
MET 6 |
PCR |
16 (100.0%) |
36 (100.0%) |
|
qPCR |
16 (100.0%) |
36 (100.0%) |
|
Results of the comparisons are statistically significant (p<0.001) except for C. albicans in METI with MET3. Commercial methods were more efficient for concentrating gDNA than in-house methods, although MET 2 and MET 4 provided acceptable yields. Regarding the subsequent amplification, for C. albicans, the use of zymolase in ddH2O and LiOAc - SDS were the most effective in-house methods in PCR (100%). In qPCR, the least effective methods were heating (0%) and heating - freezing (0%) with mean melting temperature 84 °C and std 1.5, followed by LiOAC - SDS with mean melting temperature 85 °C and std 0.7.
For C. dubliniensis, statistical differences were observed in all comparisons. All in-house methods except heating followed by freezing enabled identification, though clear bands in 1.3% agarose gel were better with zymolase in ddH2O, and LiOAC - SDS in PCR. For qPCR, all methods enabled identification, but the least effective regarding melting temperature were heating followed by freezing and LiOAC - SDS, with mean 81.8 and std 0.9 and 0.3, respectively. Two commercial kits were equally effective for both species in both PCRs (Figs. 1 and 2; Table 3).
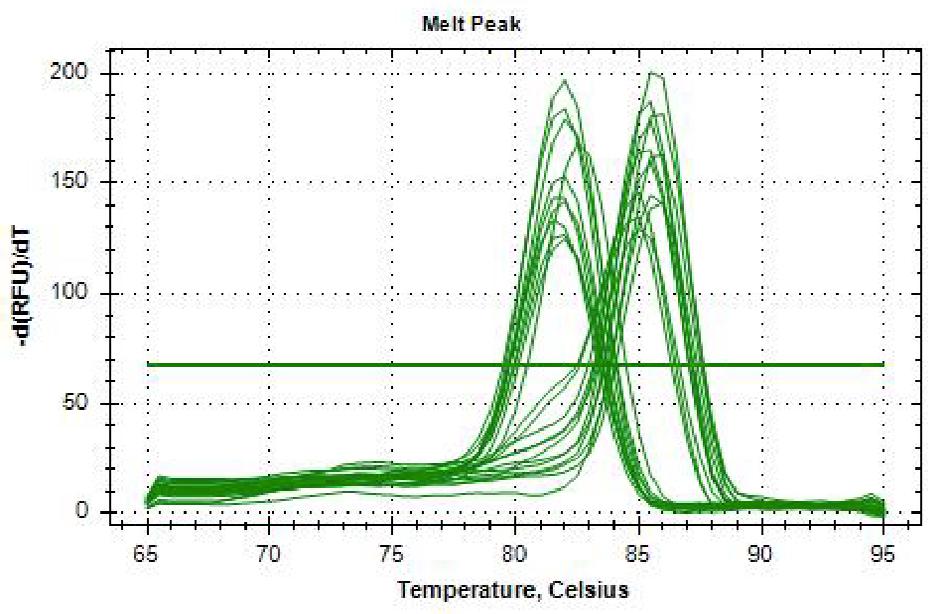
Fig. 1 Melting point of C. albicans86°C (+0.5) and C. dubliniens 82° C (+0.5) using as extraction method heating at 100°C in qPCR.
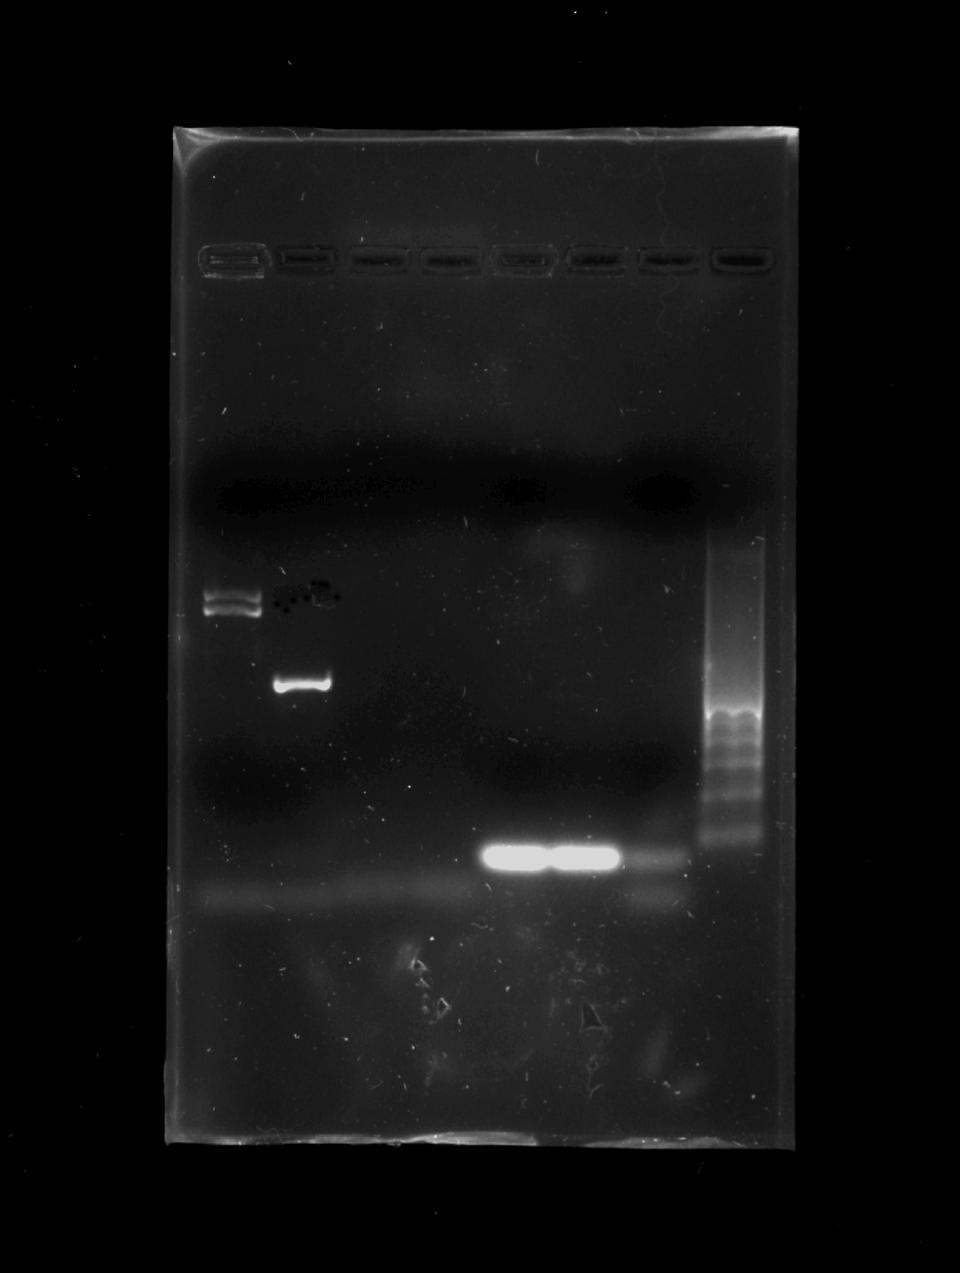
Fig. 2 1.3% agarose gel in TAE buffer (Tris, Acetic Acid, EDTA). Block 8: Ladder 100 pb. Lane 1 positive strain for Candida albicans, lane 2 positive strain for Candida dubliniensis lanes 3, 4, 5, 6 negative strains, lane 7 negative control.
Table 3
|
C. albicans |
C. dubliniensis |
||
|---|---|---|---|
|
Frequency (%) |
Frequency (%) |
||
|
Heating PCR |
Yes |
0 (0.0%) |
36 (100.0%) |
|
No |
16 (100.0%) |
0 (0.0%) |
|
|
Heating-freezing PCR |
Yes |
8 (50.0%) |
0 (0.0%) |
|
No |
8 (50.0%) |
36 (100.0%) |
|
|
Kit Zymo Research® PCR |
Yes |
16 (100.0%) |
36 (100.0%) |
|
No |
0 (0.0%) |
0 (0.0%) |
|
|
Kit Geneaid® PCR |
Yes |
16 (100.0%) |
36 (100.0%) |
|
No |
0 (0.0%) |
0 (0.0%) |
|
|
Zymolase- ddH₂O PCR |
Yes |
16 (100.0%) |
36 (100.0%) |
|
No |
0 (0.0%) |
0 (0.0%) |
|
|
LiOAC PCR |
Yes |
16 (100.0%) |
36 (100.0%) |
|
No |
0 (0.0%) |
0 (0.0%) |
|
|
Heating qPCR |
Yes |
16 (100.0%) |
36 (100.0%) |
|
No |
0 (0.0%) |
0 (0.0%) |
|
|
Heating-freezing qPCR |
Yes |
16 (100.0%) |
36 (100.0%) |
|
No |
0 (0.0%) |
0 (0.0%) |
|
|
Kit Zymo Research® qPCR |
Yes |
16 (1) |
36 (100.0%) |
|
No |
0 (0.0%) |
0 (0.0%) |
|
|
Kit Geneaid® qPCR |
Yes |
16 (1) |
36 (100.0%) |
|
No |
0 (0.0%) |
0 (0.0%) |
|
|
Zymolase- ddH₂O qPCR |
Yes |
16 (100.0%) |
36 (100.0%) |
|
No |
0 (0.0%) |
0 (0.0%) |
|
|
LiOAC qPCR |
Yes |
16 (100.0%) |
36 (100.0%) |
|
No |
0 (0.0%) |
0 (0.0%) |
Alíeles of HWP1 gene in C. albicans
EasyTaq® polymerase enzyme performed best for genotyping alleles. Of 16 isolates, 10 were positive for HWP1-1 / HWP1-2 allele, with 2 bands of 941 and 839 bp fragments, being heterozygous for this allele.
One isolate gave a band of 941 bp, being homozygous for Wild Type HWP1-1 allele, and the other 5 gave a band of 839 bp, being homozygous for novel/rare HWP1-2 alíele. Reference C. albicans 10231 presented two fragments, 941 and 839 bp, being heterozygous for HWP1-1/HWP1-2 allele.
Regarding presumptive phenotypic identification methods, only microculture in Staib agar enabled differentiation of C. dubliniensis isolates (Table 4).
Table 4 Phenotype techniques
|
C. albicans n= 16 |
C. dubliniensis n= 36 |
||||
|---|---|---|---|---|---|
|
Frequency |
% |
Frequency |
% |
||
|
CHROMagar Candida® |
light green |
11 |
68.75% |
18 |
50.0% |
|
dark green |
5 |
31.25% |
13 |
36.1% |
|
|
white |
0 |
0.00% |
5 |
13.9% |
|
|
Milk agar 3 h Germ-tube |
yes |
16 |
100% |
32 |
88.9% |
|
no |
0 |
0.00% |
4 |
11.1% |
|
|
Milk agar 3 h mycelium |
yes |
0 |
0.00% |
6 |
16.7% |
|
no |
16 |
100% |
30 |
83.3% |
|
|
Milk agar 24 h mycelium |
yes |
10 |
62.5% |
32 |
88.9% |
|
no |
6 |
37.5% |
4 |
11.1% |
|
|
Milk agar 24 h chlamydospores |
yes |
7 |
43.75% |
29 |
80.6% |
|
no |
9 |
56.25% |
7 |
19.4% |
|
|
Milk agar 48 h mycelium |
yes |
12 |
75.0% |
33 |
91.7% |
|
no |
4 |
25.0% |
3 |
8.3% |
|
|
Milk agar 48 h chlamydospores |
yes |
9 |
56.25% |
32 |
88.9% |
|
no |
7 |
43.75% |
4 |
11.1% |
|
|
CMA agar 24 h mycelium |
yes |
15 |
93.75% |
36 |
100% |
|
no |
1 |
6.25% |
0 |
0.0% |
|
|
CMA agar 24 h chlamydospores |
yes |
11 |
68.75% |
28 |
77.8% |
|
no |
5 |
31.25% |
8 |
22.2% |
|
|
CMA agar 48 h mycelium |
yes |
15 |
93.75% |
36 |
100% |
|
no |
1 |
6.25% |
0 |
0% |
|
|
CMA agar 48 h chlamydospores |
yes |
12 |
75.0% |
29 |
80.6% |
|
no |
4 |
25.0% |
7 |
19.4% |
|
|
Staib agar 24 h |
rough colonies |
1 |
6.25% |
35 |
97.2% |
|
smooth colonies |
15 |
93.75% |
1 |
2.8% |
|
|
Staib agar 48 h |
rough colonies |
1 |
6.25% |
36 |
100% |
|
smooth colonies |
15 |
93.75% |
0 |
0% |
|
|
SDA 45°C |
yes |
11 |
68.75% |
19 |
52.78% |
|
no |
5 |
31.25% |
17 |
47.22% |
|
|
NaCl 6.5% |
yes |
12 |
75.0% |
27 |
75.0% |
|
no |
4 |
25.0% |
9 |
25.0% |
|
DISCUSSION
C. albicans and C. dubliniensis share many phenotypic and biochemical characteristics. Presumptive identification by these methods used routinely in low-complexity laboratories continues to be a problem because they do not provide definitive identification data. Distinction between these two species is important in terms of treatment, in order to understand the clinical and epidemiological significance of the role played by C. dubliniensis in human infections 4,5,22, 24-27 .
Although C. dubliniensis is often isolated from oral samples in Argentina 4,8,24, 26 , phenotypic characterization underestimates it, and it is reported mostly as C. albicans. In agreement with Livério et al. 2017, none of the phenotypic tests alone, proved to be highly effective for conclusive identification of these species 27 .
Molecular techniques are more sensitive and specific, but cell wall lysis is the main obstacle to efficient gDNA recovery. Conventional methods using enzymes for chemical rupture or glass beads for physical rupture, generally followed by lysis with detergents, are time-consuming and costly for application to many samples. Moreover, methods that use phenol-chloroform are hazardous to health unless used in suitable conditions 20 .
Most phenotypic methods provide unsatisfactory results (false positives and negatives), so the most appropriate methods are polymerase chain reaction (PCR), mass spectrometry (MALDI-TOF) and sequencing genomics 18 .
It is important to bear in mind that one of the main limitations in the use of PCR techniques to identify Candida spp. is that there is no consensus on the methods for cell wall rupture 29 . However, molecular methods provide conclusive identification, and are fast and accurate, though they are more expensive and require specific equipment 27 .
Routine identifications, such as different phenotypic methods and amplification of the ITS regions, do not discriminate properly among the 3 species, underestimating C. africana and C. dubliniensis. However, due to polymorphism of the HWP1 gene, its amplification by PCR enables these species to be distinguished with greater certainty 30 .
The qPCR technique based on melting curves analyzed with SYBR Green is a simple, fast method to distinguish C. albicans from C. dubliniensisthrough the ITS1 and ITS2 regions, but not for C. africana 21 . Our study did not isolate C. africanafrom subgingival samples.
In 2009, a second allele for the HWP1 gene with 850 bp was described in C. albicans 23 . Shan et al. reported that C. albicans produced two DNA fragments, demonstrating that C. albicans isolates were heterozygous at the HWP1 locus 31 . Fontecha et al. 2019 found that most of their isolates were heterozygous, concluding that the HWP1 gene could be considered a good marker for identifying cryptic species in this complex 5 , while a study in 2017 reported found 5 different genotypes 30 , which provides a pattern of polymorphism presented by this gene.
CONCLUSIONS
This study aims to provide simple, inexpensive strategies for phenotypic identification and molecular confirmation of Candida albicans and Candida dubliniensis for non-reference laboratories with low complexity and/or low budgets.
The advantages of in-house extraction methods used in this study are based on their simplicity, use of minimal amounts of reagents, shorter identification time and avoiding the use of enzymes, phenol and glass beads.
The simplest, cheapest and most effective methods were heating at 100 °C for qPCR and the use of LiOAc - SDS for PCR.

