


 English (pdf)
 Article in xml format
 Article references
 Send this article by e-mail
 Cited by SciELO
  Similars in
SciELO
Similars in
SciELO 
 Permalink
Introduction
Throughout the Brazilian territory, sheep production chains have demonstrated growth in production and consumer acceptability of sheep meat. The supply chain has shown flock growth rates due to the expansion of domestic and foreign markets. To maintain market supply, the feedlot management system has often been used by producers mainly due to the low availability and quality of forages during the drought season 24.
Research has shown satisfactory results from this system, mainly as a strategy to minimize the impacts of forage shortage, but also to allow animal fattening during the off-season. In addition, this system enables a reduction in slaughter age and improves meat supply during the off-season 11,13,17,31. However, the costs of finishing lambs in this system are linked to productivity and are directly associated with high costs of energy and protein concentrates. Therefore, the search for feeds that can improve productivity and economic indices in livestock farming systems without affecting animal performance has been a continuous challenge among researchers.
In general, cereal grains, especially corn, are the main source of energy in animal diets. However, the greater availability of by-products has increased the interest for these alternative sources to substitute corn, with the aim of lowering the cost per kilogram produced 26. Nonetheless, it is necessary to study the effects of these by-products on the final product to be delivered to consumers. Therefore, the objective of this study was to evaluate the effects of by-products as corn substitutes in feedlot lamb diets on carcass characteristics and meat quality.
Material and Methods
The work was conducted in accordance with ethical standards and approved by the ethics and biosafety committee, protocol number 987, of the University of Western São Paulo, in the municipality of Presidente Prudente, São Paulo, Brazil, latitude 22°07 North and longitude 51°23’, with an average annual temperature of 28°C and with an average annual precipitation of 1400 to 1500 mm, characterized by a hot climate with dry winter (Unoeste -Metrological Station-SP).
Twenty-four intact ram lambs, Highlander crossbreed, with an average weight of 18 kg + 1,61, were randomly distributed in four dietary treatments (T): corn (TC - control), citrus pulp (TCP), rice bran (TRB), and soybean hulls (TSH). All diets were isoenergetic (71% NDT) and isoproteic (21% CP) (Table 1, page 245), Animals were housed in individual pens (1.20 x 1.0 m), with concrete floor covered with wood shavings, equipped with individual feeder and drinker and mineral salt ad libitum.
Table 1: Tabla 1: Percentage of ingredients and proximate composition of diets used in the feedlot of crossbreed Highlander ram lambs. Porcentaje de ingredientes y composición aproximada de las dietas utilizadas en los cebaderos de corderos cruzados Highlander.

1 Total digestible nutrients estimated according to Cappelle et al. 2001.
1 Nutrientes digeribles totales estimado según Cappelle et al. 2001.
Endoparasite control was done with ivermectin, 1 mL per 50 kg body weight, during the entire stay of animals in the feedlot strategically using test of counting the eggs per gram of feces (OPG). Adaptation to diet and facilities lasted 14 days and the experimental period an average of 53 days.
Animals were weighed every 14 days to obtain daily weight gain and, consequently, to adjust the feed offered. The lambs were slaughtered when they reached 30 kg of body weight.
Prior to slaughter, body condition (BC) was determined by the method developed in England by Russel et al. (1969) that is based on palpation of the lumbar region to determine the amount of fat and muscle observed in the angle formed by the dorsal and transverse processes. Values from 1 to 5 were assigned, in which 1 represented a cachectic animal and 5 denoted an obese animal.
After solid fasting for 16 h, the animals were weighed to obtain pre-slaughter body weight (PSBW) and then stunned by an electric discharge of 0.50 A for eight seconds, according to the methodology proposed by Gomide and Ramos (2006) and following the standards for humane slaughter.
After evisceration, carcasses were weighed to obtain hot carcass weight (HCW) and transferred two hours later to a cold chamber at 4°C, where they remained for 24 h. Carcasses were hung from the tendons on appropriate hooks, maintaining the tarsometatarsal joints at a distance of 17 cm. At the end of this period, cold carcass weight (CCW), carcass commercial yield (CCY = CCW/PSBW × 100), and cooling loss (CL = HCW - (CCW/HCW) × 100) were obtained. To obtain the carcass compactness index (CCI = CCW/internal carcass length), the internal length of the carcass (ILC, maximum distance between the anterior border of the ischiopubic symphysis and the anterior edge of the first rib at its midpoint) measured with a measuring tape was obtained according to Sañudo and Sierra (1986).
In addition, subjective evaluations of the carcass were performed for fat cover (FATCOV) (1 for lean and 5 for very fat), carcass conformation (CC) (1 for poor and 5 for very good), meat color (MEATCOL) (1 for pink and 3 for red), and fat consistency (FATCON) (1 for firm and 3 for soft).
Carcasses were divided in the middle with a longitudinal cut in the cranial-caudal direction, and the loin eye area (LEA) was obtained by exposing the longissimus dorsi muscle after a transverse section on the left carcass side, between the 12th and 13th ribs, outlining it on tracing paper. The area was then determined as square centimeters of the image using AUTOCAD® software. Using a caliper, the following measurements were performed on the loin: maximum depth (MD), maximum width of the loin (MW), greatest fat thickness (GFT), and lowest fat thickness (LFT). Subcutaneous fat thickness was measured at the final third of the muscle, from the backbone, perpendicular to the muscle, using a digital caliper.
The loin was then removed from the left half of the carcasses, and after 30 min blooming, color was evaluated for myoglobin oxygenation, using a portable Color reader CR-10 Konica Minolta® (Konica Minolta, Chiyoda, Tokyo, Japan). The components L* (lightness/ darkness), a* (redness/greenness component), and b* (yellowness/blueness component) were expressed in the CIELAB* color system.
Loin chops (2.54 cm) were cut, and the pH was assessed using a Hanna® pH meter. Moisture, ash, protein (N × 6.25), and fat content were determined according to AOAC methods (2000): moisture by AOAC Method 950.46; protein by estimating the nitrogen content using the Kjeldahl method (AOAC Method 920.152); ash by incineration at 525°C (AOAC Method 940.26); and fat by the Soxhlet method (AOAC Method 963.15).
Cooking for objective tenderness and sensory analysis was performed by thawing the loin chops for 24 h at 5 °C and grilling to 71 °C 1. The objective tenderness was measured using a CT3 Texture Analyzer Brookfield® (Brookfield Engineering, Middleboro, MA, USA) with a 3 mm thick Warner-Bratzler blade. The cores were sheared with a C3 Texture Analyzer Brookfield® (Brookfield Engineering) with a Warner-Bratzler blade.
Thawing loss and cooking loss were calculated from chops used for objective tenderness according to the following formulas respectively: Thawing loss % = (Thawed weight of the chop × 100)/Frozen weight of the chop); Cooking loss % = (Grilled weight of the chop × 100)/ Raw weight of the chop).
A completely randomized design with different replicates was used with the Tukey-5% test for the composition of the means, using the ASSISTAT Program.
Results and Discussion
Variables for daily gain, pre-slaughter body weight, hot carcass weight, cold carcass weight, cooling loss, commercial carcass yield, carcass index, and confinement period are reported in Table 2.
Table 2: Tabla 2: Estimated means and coefficients of variation for performance and carcass characteristics of feedlot crossbreed Highlander lambs fed with different energy sources. Medias estimadas y coeficientes de variación para el rendimiento y la canal de los corderos Highlander tratados en corral de engorde con diferentes fuentes de energía.
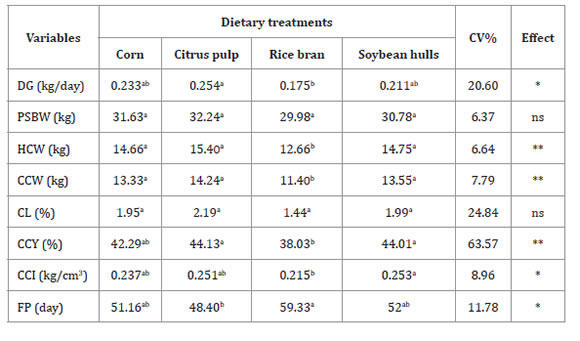
** p < 0.01. *p <0.05. ns: not significant (p>= .05). Means followed by different letters in a line differ statistically from each other. DG = daily gain. PSBW = pre-slaughter body weight. HCW = hot carcass weight. CCW = cold carcass weight. CL = cooling loss. CCY = commercial carcass yield. CCI = carcass compactness index. FP = feedlot period.
** p <0,01. * p <0,05. no significativo (p> = ,05). Las medias seguidas de una letra diferente en la línea difieren estadísticamente entre sí. DG = ganancia diaria. PSBW = peso vivo antes del sacrificio. HCW = peso de la canal caliente. CCW = peso de la canal fría. WLC = pérdida de peso por enfriamiento. CCY = rendimiento comercial en canal. CCI = índice de compacidad de la carcasa. FP = período de encierro.
For daily gain means, the citrus pulp diet (0.254 kg/day) and the rice diet (0.175 kg/day) differed from each other (p<0.05) but were statistically similar to corn and soybean hulls. The lowest daily gains for the rice bran treatment can be explained by the reduction in the digestibility of nutrients, especially proteins 12,30,33. Tabeidian and Sadeghi (2008), studying different levels of rice bran in lamb diets observed a linear reduction in daily gain with increasing levels of rice bran in the diets.
For hot carcass weight and cold carcass weight, the rice bran treatment produced significantly (p<0.05) lower weights than the other dietary treatments. These results have a direct correlation with the least daily gains observed for animals fed this treatment, which is also reflected in hot carcass weight and cold carcass weight. Weight percentage loss from cooling had no significant effect on feedlot finished crossbreed Highlander lambs receiving diets with different energy sources.
The carcass compactness index significantly differed between the rice bran and soybean hull dietary treatments. Animals fed soybean hulls presented the highest carcass compactness index values. This index is a strong indicator of the conformation of the carcass, since it evaluates the amount of muscular tissue deposited in the carcass in a unit of length 23. The commercial carcass yield values for animals fed rice bran were similar to those observed for animals fed corn but were statistically different when compared to other dietary treatments.
The feedlot period for the diet containing rice bran was 59.33 days longer (p<0.05) and was the longest of all dietary treatments. According to lamb research with rice bran in the diet, this ingredient has a negative effect on feed conversion 30, and animals must ingest more food in order to reach slaughter weight, requiring more days in the feedlot.
The estimated means and coefficients of variation for carcass composition, fat cover, fat consistency, and meat color of crossbreed Highlander lambs fed with different energy sources are presented in Table 3, however the supplementation with different energy foods did not influence these variables.
Table 3: Tabla 3: Estimated means and coefficients of variation (CV) for subjective evaluations of carcass conformation, fat cover, fat consistency, and meat color of Highlander lambs fed diets with different energy sources. Medias estimadas y coeficiente de variación (CV) para las evaluaciones subjetivas de la conformación de la canal, la cobertura de grasa, la consistencia de la grasa y el color de la carne de corderos Highlander alimentados con dietas con diferentes fuentes de energía.

ns = not significant (p >= 0.05). CC = carcass conformation. FATCOV = fat cover. FATCON = fat consistency. MEATCOL = meat color. 11(poor) to 5 (very good). 21 (lean) to 5 (very fat). 31 (firm) to 3 (soft). 41 (pink) to 3 (red).
NS = No significativo (p >= 0,05). CC = conformación de la canal. FATCOV = cobertura de grasa. FATCON = consistencia grasa. MEATCOL = color de la carne. 11 (pobre) a 5 (muy bueno). 21 (magro) a 5 (muy graso). 31 (firme) a 3 (suave). 41 (rosa) a 3 (rojo).
However, no statistical differences were observed between the dietary treatments (p>0.05) for any of the variables.
Zundt et al. (2010), in an experiment conducted with crossbreed Highlanders lambs slaughtered at 30 kg, found values of 2.50, 1.41, and 1.50 for FATCOV, FATCON, and MEATCOL respectively, which are similar to the results in this research. Values for fat cover observed in this study are lower than the 3 mm suggested in the literature as desirable fat cover in the sheep carcass to prevent losses during the cooling period 7,20.
Measurements of maximum depth (MD), maximum width of the loin (MW), greatest fat thickness (GFT), and lowest fat thickness (LFT) are shown in Table 4 (page 248).
Table 4: Tabla 4: Estimated means and coefficients of variation (CV) for loin measurements of Highlander lambs fed diets with different energy sources. Medias estimadas y coeficientes de variación (CV) para la longitud del lomo y el grosor de la grasa en dietas con diferentes alimentos energéticos en corderos.
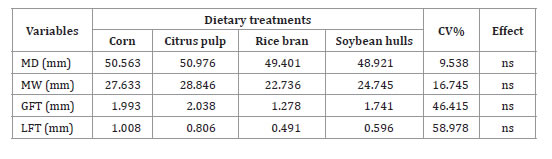
ns = not significant (p >= 0.05). MD = maximum depth. MW = maximum width of the loin. GFT = greatest fat thickness. LFT = lowest fat thickness.
ns = No significativo (p >= 0,05). MD = longitud del lomo más larga. MW = longitud del lomo más corta. GFT = mayor espesor de grasa. LFT = menor espesor de grasa.
There were no significant differences (p> 0.05) between dietary treatments on the measured variables.
Loin maximum depth measurements are used to estimate the amount of muscle in the carcass and have a high correlation with the loin eye area and conformation. The loin measurements were not influenced by treatments (P>0.05), and the values obtained for the maximum depth in this study were lower than those reported by Neres et al. (2000) and Lombardi et al. (2010) of 55.58 mm and 54.08 mm, respectively.
Mean values for meat and fat color, pH, fat thickness (FT), loin eye area (LEA), cooking loss (CL), and objective tenderness (WBSF) of crossbreed Highlander lambs finished with different energy sources are listed in Table 5.
Table 5: Tabla 5: Estimated means and coefficients of variation (CV) of color, pH, fat thickness, loin eye area, cooking loss, and WBSF of the Longissimus thoracis et lumborum muscle from Highlander lambs fed diets with different energy sources. Medias estimadas y coeficientes de variación (CV) del color, pH, el grosor de la grasa, el área de los ojos del lomo, la pérdida de cocción y la ternura de la carne del músculo Longissimus thoracis et lumborum de corderos terminados con diferentes fuentes de energía.
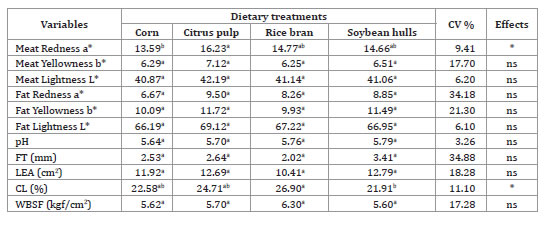
*p<0.05. Means followed by different letters a line differ statistically from each other; ns = not significant (p >= 0.05). FT = fat thickness. LEA = loin eye area. CL = cooking loss. WBSF = objective tenderness.
*p<0,05. Las medias seguidas de una letra diferente en la línea difieren estadísticamente entre sí. ns = No significativo (p> = 0,05). FT = espesor de grasa. LEA = área de los ojos del lomo. CL = pérdida de peso por cocinar. WBSF = ternura objetiva
According to the literature, the color values for sheep meat range from L* 31.36 to 38.0, a* 12.27 to 18.01, and b* 3.34 to 5.65 6. Although no statistical differences were observed for parameters L* and b*, the values measured in this study were higher than those suggested in the literature. These findings could be related to the slaughter age of the animals, as young animals have more water on the muscle, resulting in the highest values for L* 25. For a* values, a statistical difference was observed between the corn and citrus pulp diets (p>0.05). This difference can be explained by the capacity of citrus pulp to improve the oxidative stability of meat 15. Fat color parameters for L*, a*, and b* did not differ (p>0.05) between dietary treatments.
The ideal pH for meat ranges between 5.5 and 5.8 28. In this study, no statistical differences (p>0.05) were observed between diets, and the values measured (5.72) indicated a proper resolution of rigor mortis.
No differences were observed in fat thickness between dietary treatments (p>0.05), and the mean values measured in this study (1.75 mm) were considered unsatisfactory. A minimum fat coverage of 3 mm is necessary to protect the carcass from water loss during refrigeration. The minimum fat thickness also protects the carcass from cold-induced burning during the freezing process 19. In a study on citrus pulp diets, Henrique et al. (2004) observed a linear reduction in this variable with the addition of up to 55% of citrus pulp to the cattle diet and attributed this effect to the lower energy value of citrus pulp when compared to corn 21. This reduction was not observed in the present study and can be related to the fact that the citrus pulp diet received inclusion of oil. The lower deposition of fat in the carcass from animals fed exclusively with citrus pulp can also be a result of differences in volatile fatty acids produced during ruminal fermentation 8.
For the loin eye area (11.92 cm²), no statistical differences were observed between dietary treatments. Zundt et al. (2010) also working with crossbreed Highlander lambs with a slaughter weight of 30 kg, observed lower area values (10.89 cm²) than the ones observed in this study.
A statistically significant difference was observed in cooking loss (p<0.05). The soybean hulls diet presented lower loss (21.91%) when compared to the rice bran diet (26.9%), but with no statistical difference from the other treatments. Values for cooking loss in the literature vary between 33% and 44% 4 for small ruminants, which are higher than the values observed in this study. When evaluating different diet compositions for lambs, Atsbha et al. (2021) reported cooking loss values similar to those observed in this study, with an average of 24.18% to 26.12%.
For objective tenderness, the observed mean values were 5.81 kgf, and the results corroborate those of Costa et al. (2011). The meat from this study was classified as soft 5,32.
Table 6 presents the mean results and coefficients of variation (CV%) for proximate composition of Longissimus thoracis et lumborum muscle of crossbreed Highlander lambs fed different energy sources as corn substitutes.
Table 6: Tabla 6: Means and coefficients of variation (CV) for proximate composition of the Longissimus thoracis et lumborum muscle of Highlander lambs fed diets with different energy sources. Media y coeficiente de variación (CV) para la composición aproximada de la carne del músculo Longissimus thoracis et lumborum de corderos Highlander terminados con diferentes fuentes de energía.

ns = not significant (p >= 0.05). * p < .05. Means followed by different letters in a line differ statistically from each other.
ns = No significativo (p> = 0,05). * p <,05. Las medias seguidas de una letra diferente en la línea difieren estadísticamente entre sí.
The results revealed no effect of different dietary treatments (p>0.05) on moisture, protein, and ash content of the meat, whereas ethereal extract content differed between dietary treatments (p<0.05). The citrus pulp diet had the lowest percentage of ethereal extract, and Caparra et al. (2007) observed an ethereal extract values decreased when the inclusion of citrus pulp increased.
Conclusion
The use of different energy sources in ram lamb finishing diets did not change the proximate composition and quality of the meat. The inclusion values used in this study are recommended, although the use of rice bran as a substitute for corn should be carefully evaluated, as its inclusion provided less daily weight gain, consequently more days of feedlot for the animals.

