


 English (pdf)
 Article in xml format
 Article references
 Send this article by e-mail
 Cited by SciELO
  Similars in
SciELO
Similars in
SciELO 
 Permalink
Introduction
Yield prediction constitutes a major challenge in pear and apple orchards. Early yield forecasts allow growers to estimate final fruit volume, calculate necessary supplies for fruit picking, plan and manage storage spaces, book grading facilities and transport (34).
Nevertheless, estimating yield in fruit crops is not easy given that fruit crops are perennial species in which small variations in cultural techniques or differences in cultivar genotype define greater production variability (3). Additionally, annual yield depends on climatic and management conditions that affect flowering, fruit set, growth and persistence on the plant until harvest (2). Furthermore, forecasts are generally based on manual counting of fruit in selected trees. This method is extremely time-consuming and the number of inspected trees is generally small, adding inaccuracy (30). In this scenario, image analysis becomes one crucial alternative.
Image processing techniques in fruit production have increased significantly in the last few years. Fruit detection after image analysis has been used for many purposes like yield forecast (1,9,11,30,34), improvement in thinning decisions (12,14), and robotic harvesting (23,32).
Different proximal sensors can be used with computer vision aims (13). Several studies have used simple sensors like black and white cameras (24), or more complex multispectral ones (5). However, most methodologies developed so far, base their analysis on colour digital images (also called RGB images: Red, Green and Blue). In addition, image analysis is done after different strategies, from those based on colour features to modern techniques such as machine learning. Four basic features characterize objects in images: intensity, colour, shape and texture. All of them can recognize flowers or fruits. Colour is one of the most important image features to distinguish fruits from leaves. However, it is affected by variations in fruit colour, maturity, variety and varying environment (13). In this way, while colour and intensity analysis is faster, shape analysis is more robust (23). Some fruit detection algorithms have been solely developed from colour features (7,11,34). Other more complex algorithms integrate colour, texture and shape features (14,19,21,23,25,30).
Nevertheless, machine learning and especially deep learning appears to be the most promising technique. Many authors suggest that deep learning achieves better results in image analysis than classical programming methods, though they require high computational resources (13). According to Koirala et al. (2019a), computational resources are not a problem anymore, as having a Graphics Processing Unit (GPU) nowadays turns easy. Free available online tools consist of graphical annotation apps and last-generation deep learning models like Faster R-CNN (Faster Regional Convolutional Neural Network) (27), Single Shot MultiBox Detector (SSD) (22), or YOLO (You Only Look Once) (26).
Previous research has trained deep learning models for fruit detection with promising results in rock melons, strawberries, apples, avocados, mangos, oranges and sweet pepper (28); apples, mangos and almonds (4); mangos (18); oranges and apples (8); apples and pears (6,15); apples in different growth stages (31); apple fruitlets before thinning (33).
Although fruit detection from image analysis has been studied for a long time, in the field, variable lighting conditions constitute a disadvantage (23). In addition, fruit detection and localization are affected by the complex canopy structures (16) and accuracy is limited by the occlusion of fruits among leaves, branches and other fruits in the image (13). Finally, to the present, only a few studies conduct fruit detection and counting on pear trees. Also, pear trees, unlike apple ones, generally have a more complex crown structure and fruits remain green until they mature. Due to these characteristics, model training needs to be separately done for each species. This study aimed to i) evaluate deep learning models for apple and pear detection and counting with yield forecast purposes, and ii) measure fruit sizes from images.
Materials and methods
Experimental plot
The trial was carried out in two plots at the Instituto Nacional de Tecnología Agrpecuaria (INTA) Experimental Station, Allen, Argentina (39°01’33.6’’ S, 67°44’27.8’’ W). Apple cultivar was ‘Red Chief’ grafted on MM111 rootstock planted in 2000. Trees were trained as espalier at a distance of 1.5 m between trees by 4 m between rows, in a total area of 0.8 ha, with a total of 1280 trees. The pear cultivar was ‘Williams Bon Chretien’ grafted on seedling rootstock and planted in 2003. Trees were trained as espalier, at a distance of 4 m between rows by 2 m between trees, in a total area of 1.8 ha with a total of 2016 trees.
Data collection
Images were taken during four seasons from 72 apple trees and 60 pear trees per season. In the pear plot, 3 trees were randomly selected at 20 representative rows, totalling 60 trees. In the apple plot, 8 trees were randomly selected from 9 representative rows, totalling 72 trees.
Images were captured when the pears reached an average diameter of 40 mm and apples 35 mm approximately (first week of December) in two different conditions: i) natural daylight between 10 am and 1 pm, ii) at night with the artificial flash light of the camera. Images were captured on a partly cloudy day to minimize undesirable effects caused by direct sunlight (11). A black curtain was unfolded behind the trees avoiding interference from neighbouring trees (1). All images were taken with an RGB digital camera (Cannon of 12 MP) from a distance of approximately 3.0 m from the tree and transversely to the row. A square object of 15 cm by 15 cm dimension was placed next to each tree as scale for size estimations.
The same day, images were captured, and all fruits on each photographed tree were manually counted by a single operator. Three records were made in each tree: i) fruit number on the same side of the image; ii) fruit number on the other side of the image; iii) total fruit number. At harvest time, weight and number of fruits collected were recorded for each tree. In addition, the number of apples and pears was visually determined from the fruit images (human eyes) by the same person.
Fruit detection and counting from image analysis
The deep learning models trained for fruit detection and counting were YOLO in different versions: YOLOv5s6 and YOLOv7, available in the github repository: https://github.com/AlexeyAB/darknet. Pear and apple detection and counting training were done separately. For apples, the selected version was YOLOv5s6 with an image resolution of 1024x1024 pixels because YOLOv7 showed a similar performance to YOLOv5s6, but had a much more complex structure. For pears, the selected version was YOLOv7 with an image resolution of 1280x1280 pixels because YOLOv5s6 showed poor performance for this specie. Roboflow was used to label images with apples or pears categories. The apple dataset had 505 images with a total of 36260 annotations (fruits) and the pear dataset had 474 images with a total of 39052 annotations (fruits). Some low-quality images were removed from the datasets. Each dataset was divided into three parts: training set (70%), validation set (20%) and testing set (10%). Also, to increase the number of images and generate more information, augmentation techniques were used in both datasets. Deep-learning-model performance was evaluated based on: i) precision, which gives the number of true detection out of total detection, calculated as precision=true positives/(true positives + false positives); ii) recall, number of true detections out of total truth annotations, calculated as recall=true positives/(true positives + false negatives); iii) F1 Score, a weighted average of precision and recall, varying between 0 (worst) and 1 (best), calculated as F1score=2*(precision*recall/ (precision + recall)), (17).
Pearson correlation coefficients compared model results and manual counts between i) the number of manually counted fruits on the same side of image collection; ii) the number of total manually counted fruits in the tree; iii) the number of labelled fruits in the images (human eye detection in images); iv) the number of detected fruits by deep learning models (artificial vision detection); v) number of harvested fruits per tree.
A paired-sample t-test revealed significant differences between the number of manually counted fruits on the same side of the image collection and the number of detected fruits by deep learning models (artificial vision detection). Normally distribution was verified by Shapiro-Wilks test and mean differences were compared to zero.
Size estimation
Laboratory and field conditions evaluated fruit size estimation. In the first case, 106 harvested fruits of different sizes were placed in cellulose trays and numbered. Later, the equatorial diameter was measured manually with a digital calliper (Essex 150 mm, Stainless Hardened). Then, a 12 MP camera was used to photograph each tray placing an object of known dimensions by each one. In the second case, 89 apples and 98 pears were selected from various trees. For this trial, one row of each crop was randomly selected. Then the object of known dimensions was placed on some trees of the row. Fruits close to that object were identified and their equatorial diameter was measured.
Image analysis was done with ImageJ software (26). Fruit diameters were measured by drawing a straight line in the equatorial diameter of each fruit.
Finally, Pearson correlation coefficients were calculated between the manually measured diameter and the image-measured diameter for each situation analyzed. In addition, differences between manually measured diameter and image-measured diameter were calculated and divided by the mean of the manually measured diameter. Finally, frequency distributions were plotted.
Results and discussion
Fruit detection and counting from image analysis
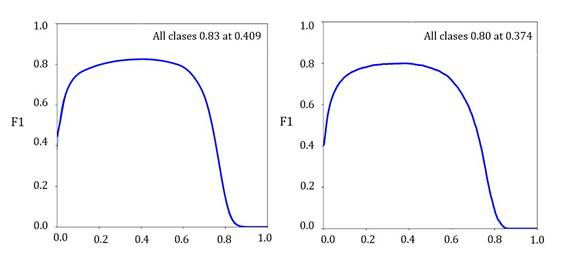
Precision values achieved were 0.86 (Figure 1, page 5) and 0.87 (Figure 2, page 5) for apples and pears, respectively, while recall was 0.83 for both species, and F1 Score were 0.83 and 0.80 for apples and pears, respectively (Figure 3, page 6).
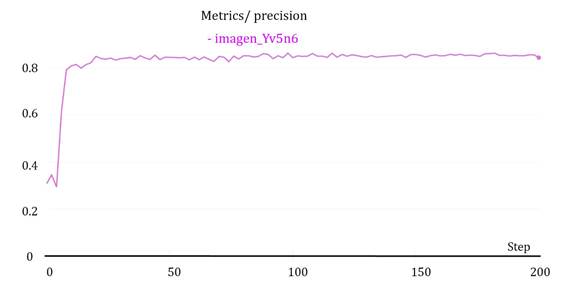
Figure 1 Precision graph for DL model trained for apple detection and counting. Figura 1: Gráfico de precisión del modelo entrenado para detección y conteo de manzanas
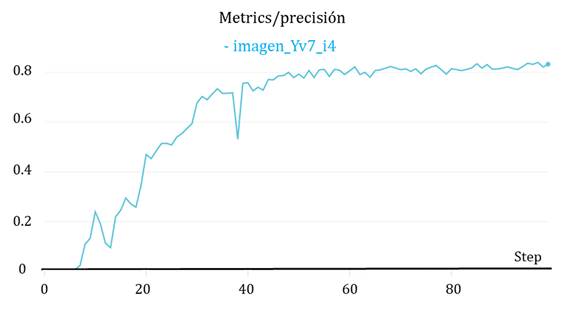
Figure 2 Precision graph for DL model trained for pear detection and counting. Figura 2: Gráfico de precisión del modelo entrenado para detección y conteo de peras
Obtained from https://wandb.ai/ delbrio/yolov5s- W?workspace=user-delbrio
Figure 3 Left: F1 score graph for DL model trained for apple detection and counting. Right: F1 score graph for DL model trained for pear detection and counting. Figura 3: Derecha: Gráfico de F1 score del modelo entenado para detección y conteo de peras. Izquierda: Gráfico de F1 score del modelo entenado para detección y conteo de manzanas
Obtained values were lower than the 0.9 presented by Sa et al. (2016) for melon, raspberry, apple, orange, mango, avocado and pepper with Faster R-CNN and VGGNet. These authors worked with their own images for pepper and melon, and Web images for the rest of the fruits demonstrating model robustness. The higher values obtained by these authors could be due to the images including fruits in different maturity stages with different colouration from the rest of the plant. They also considered a part of the plant instead of the whole plant, with fruits occupying a greater proportion of the image. Our trial only used whole-plant images taken under natural conditions with smaller fruits in relation to the total image.
One difficulty faced in this study was model ability to detect all fruits in the clusters, also one main error source reported by Bargoti and Underwood (2017), in their apple, mangos and almond detection models. According to Koirala et al. (2019b), values obtained by those authors could be lower than other reference values because images were influenced by environmental conditions, crop characteristics, and number of fruits per image (100 for mangoes and apples, and up to 1000 for almonds). This study faced the same issue as fruit number per image ascended to 170 and 150 in pears and apples, respectively.
In the present trial, both daylight and night artificial light images were used. The former could decrease model accuracy due to environmental light conditions. Koirala et al. (2019b) evaluated many existing deep learning models and built a hybrid MangoYOLO which combined speed and precision criteria. They mentioned that better results were obtained from images taken at night with artificial light, while under natural daylight conditions, the percentage of false positives increased significantly.
Another drawback in fruit detection also evidenced in this trial, especially in pears, is the different tree leaf densities and fruit occlusion by leaves, branches and other fruits. These and the distinct angles to capture images were also major difficulties mentioned by Liang et al. (2018), who achieved precision values of 0.97 and 0.92 and recall values of 0.63 and 0.90 for mango detection with two different alternatives of Faster R-CNN models. F1 values were between 0.79 and 0.91.
The training number of images is a main factor (6). These authors reported F1 scores between 0.79 and 0.89 depending on the amount of images used. Chen et al. (2016) also reported lower results of F1 Score (0.76) than those obtained in this study, probably due to the lower number of images used (71 daylight orange images and 21 nightlight apple images).
Moreover, fruit growth stage may affect the results of this trial. Intending to achieve yield forecast, fruit detection and counting from images at growth stages turns crucial. Tian et al. (2019) evaluated the YOLOv3 performance during different apple growth stages. F1 scores were 0.83, 0.84, 0.86 and 0.82 for young, growing, ripen and total apples, respectively. Values reported for growing apples were very close to those obtained in this trial. The highest values obtained were for ripened apples, probably due to ripened fruit having a larger size and a different colour compared to the rest of the plant.
Other trials using videos showed promising results probably because many images could be taken from different angles, making fruits more visualized (15). They trained YOLOv2 and YOLOv3, with average precision ranging from 0.88 to 0.97. Images obtained in our study were always taken from the same angle and distance.
Correlation analysis
Correlation coefficients between labelled and harvested fruits reached 0.89 and 0.62 for apples and pears, respectively, suggesting images provided a close approximation of apple number when forecasting. Correlation values were lower for pears, suggesting more complex image prediction. This is given to pear trees being larger than apple ones, with longer branches and more foliage. In addition, at the moment of image capture, fruits were still small and green so detection was more difficult. This agrees with Zhou et al. (2012), who concluded that if prediction was early, many apples might remain hidden due to size and colour.
Harvested fruits vs. manual counts of total plant reached values up to 0.94 and 0.82 for apples and pears, respectively. These values were higher than those obtained between harvested fruits vs. manual counts only on the image side (0.91 and 0.70 for apples and pears, respectively). This highlights the need to capture images on both sides of the plant for better predictions. Dorj et al. (2017), used three and up to four images per tree to detect and count fruits from citrus images. That is, a higher number of images per tree could improve the results obtained in this trial. On the contrary, Linker (2016) concluded that more images per tree did not throw better results.
Finally, the correlation coefficient for manual fruit counts per tree and that detected by a deep learning model trained from images (Photo) was up to 0.88 and 0.73 for apples and pears, respectively. These results showed how models accurately detected fruit in the analyzed images, constituting an interesting alternative to traditional manual counting. Črtomir et al. (2012), in their hybrid harvest prediction model, achieved similar results in this work for ‘Golden Delicious’ apples (between 0.73 and 0.83) while for Braeburn’ apples, results showed more variability (between 0.51 and 0.78). On the other hand, Farjon et al. (2019), used convolutional neural networks for flower detection in ‘Golden Delicious’ apples and achieved correlations between estimated numbers and those calculated by a group of experts of between 0.78 and 0.93.

Photo Image of an apple tree with box predictions obtained from DL model identified with labels. Foto: Foto de un árbol de manzana con las predicciones realizadas por el modelo de DL entrenado, identificadas con etiquetas
The results obtained in this trial could be affected by fruit growth development at the moment of image taking. Stajnko et al. (2005), worked with apple images taken at five different fruit growth moments and ripening periods. They achieved correlation coef ficients between 0.71 and 0.91, according to moment and cultivar. Considering that the highest values corresponded to fruits closer to maturity, their results would be similar to those obtained in this trial.
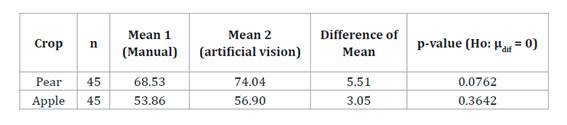
Mean differences between the number of manually counted fruits on the same side of image collection and the number mean of detected fruits by deep learning models (artificial vision detection) showed non-significant differences with respect to zero (Table 1), for both pears and apples (p-value>0.05).
Table 1 Hypothesis test on the equality to zero of mean differences between the number of fruits detected by Deep Learning models (artificial vision) and number of fruits counted manually on the same side of pear and apple trees. Tabla 1: Prueba de hipótesis sobre la igualdad a cero de la media de las diferencias entre la cantidad de frutos detectados por los modelos de Depp Learning (vision artificial) y cantidad de frutos contados manualmente sobre el mismo lado del árbol para el cultivo de pera y manzana.
Size estimation
Correlation coefficients obtained between manually measured diameter and image diameter were 0.89 for laboratory fruits, 0.73 for field apples and 0.80 for field pears. Laboratory fruits showed higher correlation than field ones, probably given by fruit position in the tree being much more variable than in the laboratory. In addition, fruits hanging far from the object of known dimensions used as scale could increase error. To improve this methodology in the future, measuring should only consider fruits close to the scaling object or the placement of more scaling objects per image. Stajnko et al. (2005) also worked on estimating fruit diameters at different growing stages from ‘Golden Delicious’ and ‘Gala’ apple images obtaining highly variable coefficients with values ranging from 0.19 to 0.79 for ‘Golden Delicious’ and 0.34 to 0.88 for ‘Gala’. Different values correspond to different fruit growth stages and seasons. Low correlation coefficients could be due to the algorithm based on the longest segment fruit measurement. Some values found by these authors resulted similar to those in this trial. Stajnko et al. (2009) also concluded an overestimation of the diameters in ‘Jonagold’ and ‘Golden Delicious’ apples when images were taken in young fruits, while underestimation occurred in ripened fruits. These results differed from those we found for pears since ripen ones were overestimated. On the other hand, apple results were variable, showing both diameters under and overestimation (Figure 4, page 9).
Differences between manual diameter measurements and image diameter measurements (% with respect to the mean of manual diameter measurements).
Diferencias entre los diámetros medidos manualmente y los medidos a partir de imágenes (expresados en % respecto de la media de las mediciones manuales).
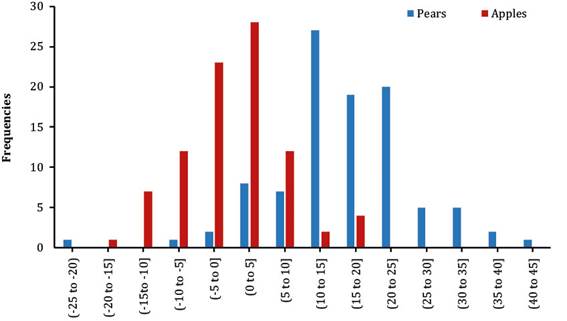
Figure 4 Frequency distribution for differences between image diameter measurements and manual diameter measurements divided by mean manually measured diameter in apples and pears. Figura 4: Gráfico de distribución de frecuencias para las diferencias entre los diámetros medidos por imágenes y los medidos manualmente divididos por la media de los diámetros medidos manualmente en peras y manzanas
Conclusion
Fruit number on both apple and pear trees could be estimated from images with promising results. They could be improved by increasing the amount of input data to the deep learning models. This includes more image taking in many different conditions (angles, distances to the focus, fruit growth stages, tree size, spacing, age and management conditions).
The possibility of estimating fruit number from images could reduce time costs, allowing growers to increase the number of sampled trees for yield forecasts.
Fruit size estimation from images was not accurate in this study, varying according to fruit proximity to the scaling object. Fruit size estimation also depends on fruit position on the tree and consequent visibility.

