


 English (pdf)
 Article in xml format
 Article references
 Send this article by e-mail
 Cited by SciELO
  Similars in
SciELO
Similars in
SciELO 
 Permalink
Introduction
Brazil is one of the major worldwide centers of genetic diversity for fruit species. However, little is known about most of these species. In this scenario, pitanga (Eugenia uniflora L.) is a plant species of the family Myrtaceae, with an average shrub size 11 and good adaptation to semi-arid conditions 23.
There are several native and exotic fruit species with economic potential for cultivation. In this context, pitanga fruits stand out due to their exotic flavor and high vitamin contents, showing great potential for economic exploitation 16,17. Most of these fruits are industrially processed or consumed fresh 4,5,29,34.
Selection studies resulted in the release of the first Brazilian pitanga cultivar, ‘Tropicana’, with a mean annual yield of 20.8 kg ha-1 per year (for ten years) under dryland conditions. The mean fruit mass of this cultivar ranges from 3 to 4.5 g, with red-pulped fruits, soluble solids (SS) of 9 °Brix, titratable acidity (TA) of 2.2 g of citric acid per 100 g-1 fresh mass, and an SS/TA ratio of 4.1 7,8,9.
However, despite the release of the ‘Tropicana’ variety, pitanga is still under domestication due to the existence of several genotypes in nature with the potential for agricultural use 6. These genotypes originated from asexually propagated plants and show high genetic variability, unevenness in their vegetative and reproductive cycles, and fruits with low physical and physicochemical quality.
Some preliminary studies have explored the genetic variability of plants aiming to select promising genotypes with desirable fruit traits 10,13,16,23. However, scientific advances are still required for the genetic improvement of pitanga due to the high genetic variability of the species.
High variability in fruit species has become a significant problem for fruit quality, requiring the analysis of qualitative fruit traits by observing physical, chemical, and physicochemical properties to subsidize decision-making when selecting promising genotypes 30,33. From this perspective, given the importance of analyzing fruit quality traits, the present study aimed to select pitanga genotypes according to the physical and physicochemical characteristics of fruits under semi-arid conditions.
Material and methods
Characterization of the area
Pitanga (Eugenia uniflora L.) genotypes were cultivated at the Rafael Fernandes Experimental Farm in the Federal Rural University of Semi-arid Region (UFERSA), Mossoró, Brazil (05°03’37’’ S, 37°23’50’’ W, 78 m a. s. l., flat relief). The regional climate, according to Köppen-Geiger, is classified as BSw’h’, i.e., tropical semiarid, with an average annual rainfall of 695.8 mm and an average annual temperature of 27.4°C, with two well-defined seasons: dry season (prolonged) and wet season (short and irregular). The natural vegetation is classified as Hyperxerophilic Caatinga 14.
The following meteorological data were recorded during the experimental period (2017 and 2018): rainfall; maximum, average and minimum temperature; and relative humidity (Figure 1).
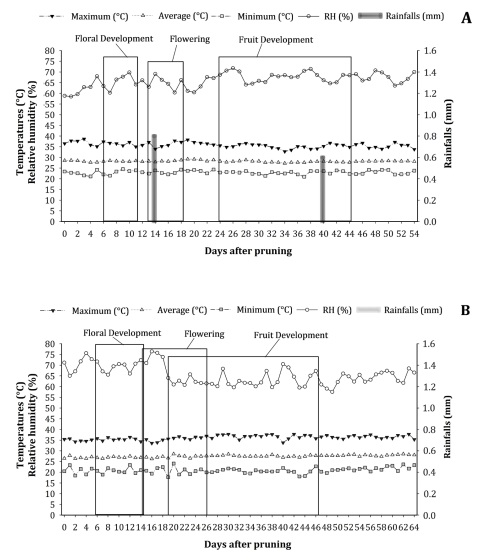
Figure 1: Maximum, minimum, and average temperature, rainfall, and relative humidity (RH) in 2017 (A) and 2018 (B) in Mossoró, Brazil. Figura 1: Valores máximos, mínimos y promedio de temperatura, precipitación pluvial y humedad relativa (RH) en 2017 (A) y 2018 (B) en Mossoró, Brasil.
The climatic data were obtained from the ASA weather station (Meliponário Imperatriz; https://hobolink.com/p/004a83ec30555e14b039b2289d21d2f5) located at the Rafael Fernandes Experimental Station (experimental farm).
Plant material
In 2010, 39 pitanga genotypes were cultivated at a plant spacing of 3.0 x 1.5 m. The genotypes were obtained from the (Figure 1, page 3), generation, without progeny test, and using open pollination for the ‘Tropicana’ cultivar obtained from the germplasm bank of the State University of Northern Rio de Janeiro (UENF), Campos dos Goytacazes, Rio de Janeiro, Brazil.
Crop management was performed according to Lira Júnior et al. (2007). Before pruning, plants were subjected to water stress in an irrigation suspension for 33 days to induce the reproductive stage. Pruning was first carried out on June 10, 2017, in the first cycle, and for the second time on July 27, 2018.
Fruit quality
The fruits were harvested weekly and evaluated for physical and physicochemical traits.
The parameters of fruit length, diameter, and mass were determined by evaluating 20 fruits per plant. All fruits were harvested at the same maturation stage and measured with a digital caliper (± 0.01 mm). Fruit mass was determined in an analytical balance, and the results were expressed as grams (± 0.01 g).
Twenty fully ripe fruits were evaluated per plant to determine the chemical attributes. The soluble solids (SS) were determined directly in the homogenized pulp juice using a digital refractometer (model PR - 100, Palette, Atago Co, LTD., Japan), with the results expressed as °Brix 2.
Titratable acidity (TA) was determined by titration using 1 g of pulp transferred to a 125 mL Erlenmeyer flask containing 49 mL water. Afterward, titration was performed with a previously standardized 0.1 M NaOH solution until reaching pH 8.1, with the results expressed as g of citric acid per 100 g-1 pulp 2. The SS/TA ratio was determined by the ratio of soluble solids to titratable acidity.
The hydrogen potential (pH) was determined using a digital potentiometer with automatic temperature adjustment (Model mPA-210 Tecnal®, Brazil), previously calibrated with buffer solutions at pH 7.0 and 4.0 2.
Vitamin C (AA) was determined by titration with Tilman’s solution (2,6 dichlorophenol indophenol at 0.02%) by diluting 1 g of sample in 50-mL volumetric flasks containing 0.5% oxalic acid 31. The results were expressed as mg of ascorbic acid per 100 g-1 pulp.
Statistical analysis
The data on the agronomic traits of each genotype were analyzed by descriptive statistics. Multivariate data analysis was performed using Principal Component Analysis (PCA). The genetic distances were calculated by considering the eight traits. The genotypes were grouped by Ward’s hierarchical clustering method based on the genetic distance matrices (Ward. D) 18,19. The analyses were performed with the R software 26.
Results
Most genotypes evaluated showed moderate to high variability, with low variability occurring only in fruit pH (Table 1, page 5 and Table 2, page 6).
Table 1: Physical parameters of the fruits of pitanga (Eugenia uniflora L.) genotypes harvested at the predominantly red stage. Tabla 1: Características físicas de frutos de genotipos de pitanga (Eugenia uniflora L.) recolectados en la etapa predominantemente roja.

1 Fruit mass (g); 2 Fruit length (mm); 3 Fruit diameter (mm); 4 Median; 5 Coefficient of variation; 6 Standard deviation.
1 Masa de fruta (g); 2 Longitud del fruto (mm); 3 Diámetro del fruto (mm); 4 Media; 5 Coeficiente de variación; 6 Desviación Estándar.
Table 2: Chemical parameters of the fruits of pitanga (Eugenia uniflora L.) genotypes harvested at the predominantly red stage. Tabla 2: Características químicas de frutos de genotipos de pitanga (Eugenia uniflora L.) recolectados en la etapa predominantemente roja.
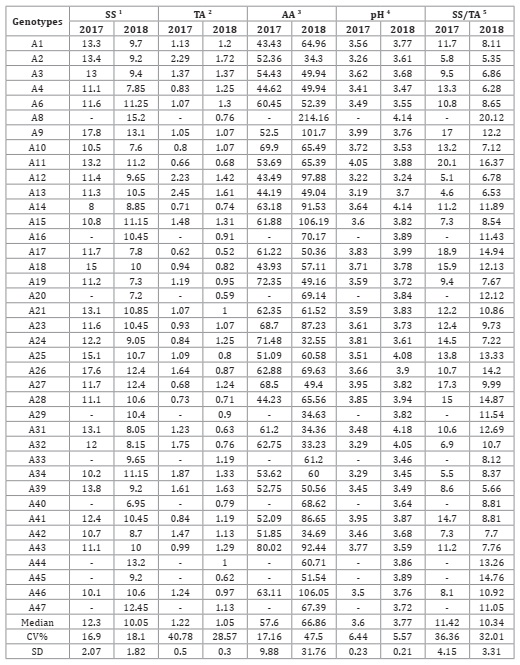
1 Soluble Solids (°Brix); 2 Titratable Acidity (g citric acid 100 g-1); 3 Ascorbic Acid (mg of ascorbic acid per 100 g-1 pulp); 4 pH; 5 SS/TA.
1 Sólidos solubles (°Brix); 2 Acidez titulable (g de ácido cítrico 100 g-1); 3 Ácido ascórbico (mg de ácido ascórbico por 100 g-1 pulpa); 4 pH; 5 SS / TA.
The fruit mass (FM) ranged from 1.4 g to 4.7 g, with a mean of 2.52 g for the first year (2017). FM showed significant variations in the second year (2018) ranging from 1.33 to 6.1 g, with a mean of 2.59 g. The variation amplitude for fruit length (FL) ranged from 9.8 to 16.90 mm (2017) and from 11.11 to 17.61 mm (2018), with the respective means of 12.73 mm and 13.35 mm for the two years. Fruit diameter (FD) ranged from 13.40 mm to 23.20 mm (2017) and from 13.98 mm to 24.00 mm (2018), with mean values of 17.22 mm and 17.55 mm, respectively (Table 1, page 5).
The higher the diameter of Pitanga fruits, the higher the fruit mass. The pitanga genotypes showed positive correlations between FM and FD (r= 0.66, p<0.0001) in 2017 and (r= 0.87, p>0.0001) in 2018.
The solids soluble (SS) ranged from 8.0 to 17.8 °Brix (2017) and from 7.2 to 15.20 °Brix (2018), with means of 12.3 °Brix and 10.05°Brix, respectively. For Titratable Acidity (TA), the values ranged from 0.62 to 2.45 g of citric acid per 100g-1 (2017) and from 0.52 to 1.7 g of citric acid per 100g-1 (2018), with mean values of 1.23 and 1.5 g of citric acid per 100g-1, respectively. The SS/TA ratio ranged from 4.6 to 20.10 (2017) and from 5.35 to 20.12 (2018), with mean values of 11.42 and 10.34 for the two cycles (Table 2).
The AA means in the two seasons were 57.61 and 66.86 mg of ascorbic acid per 100 g-1 pulp. The variations among genotypes ranged from 43.43 to 80.02 (2017) and from 32.55 to 214.16 (2018). The variations were minor for fruit pH, with mean values of 3.6 (2017) and 3.77 (2018) (Table 2, page 6).
The principal component analysis explained 50.19% of data variability, with PC 1 and PC 2 explaining 33.31% and 16.88% of data variability, respectively (Figure 2).

Figure 2: Principal component analysis (PCA) performed for pitanga (Eugenia uniflora L.) genotypes with regard to physical and physicochemical fruit parameters. Figura 2: Análisis de componentes principales (ACP) de las características físico-químicas de frutos de genotipos de pitanga (Eugenia uniflora L.).
The variables that showed the highest correlations with PC 1 were TA (r=0.79; p<0.001), TA18 (r=0.68; p<0.001), FM (r=0.67; p<0.001), FL18 (r=0.67; p<0.001), DT17 (r=0.60; p<0.005), and DT18 (r=0.60; p<0.005), whereas the variables with negative correlations were pH17 (r=-0.74; p<0.0001), SS/TA17 (r=-0.71; p<0.0001), pH18 (r=-0.64; p<0.0005), and TA18 (r=-0.60; p<0.0005). For PC2, the variables that contributed most were AA (r=-0.69; p<0.0001), FM (r=-0.65; p<0.0005), and SS/TA (r=-0.64; p<0.0001). Genotypes A12, A13, A2, and A34 contributed most to PC1. For PC2, genotypes A8, A19, A33, and A42 showed the highest contributions.
Genotype 12 showed larger fruits, whereas genotype A8 showed fruits with superior organoleptic qualities, with high SS, AA, and SS/TA contents (Figure 3, page 8).
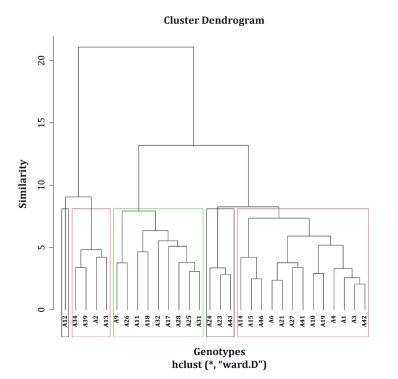
Figure 3: Cluster analysis by the Ward. D grouping method and using the Euclidean distance to arrange the 39 pitanga (Eugenia uniflora L.) genotypes into eight groups. Figura 3: Análisis de Cluster por el método de agrupación de Ward utilizando la distancia Euclidiana de 39 genotipos de pitanga (Eugenia uniflora L.).
These genotypes were individually isolated and formed groups 1 and 3 in the clustering analysis. Genotypes A2, A13, A34, and A39 showed the highest TA values and were similar to each other, belonging to group 2. However, these genotypes were negatively correlated with the pH, SS/TA, and AA contents, whose higher values were present in the genotypes of group 8 (Figure 3, page 8; Table 3, page 8).
Table 3: Clustering of pitanga (Eugenia uniflora L.) genotypes based on the genetic similarity matrix calculated using eight agronomic traits. Tabla 3: Agrupación de genotipos de pitanga (Eugenia uniflora L.) a partir de la matriz de similitud genética calculada a partir de 8 características agronómicas.
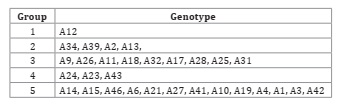
Genotypes A43, A23, and A24 formed group 4, with intermediate values for fruit size. The genotypes that formed group 5 showed intermediate values for TA and AA. In general, the second year increased the physical and physicochemical characteristics of pitanga fruits (Figure 2). The genotypes of group 6 showed similar values for all traits evaluated, whereas group 7 showed intermediate values for pH, SS/TA, and AA, in addition to the lowest TA values (Figure 3, page 8; Table 3, page 8).
Discussion
The multivariate analysis allowed the selection of the best genotypes according to physical and physicochemical parameters. Fresh fruit commercialization is usually based on physical characteristics, with larger fruits being more attractive to customers 13. All fruits of the pitanga genotypes evaluated were larger in diameter than in length, confirming previous reports 10,28.
Variations similar to the present study were observed by Dias et al. (2011) when characterizing pitanga genotypes, which, in turn, were higher than the variations observed by Avila et al. (2009) and Castro et al. (2020). These variations are mainly influenced by environmental conditions and the behavior of each genotype in the environment 23.
The largest pitanga fruits ever recorded were observed by Bezerra et al. (2004), with a mean of 4.5 g, and by Fonseca et al. (2009), with 4.24 g in genotypes grown under mild climatic conditions. Fruits with different sizes as a function of climatic conditions were observed by Castro et al. (2020), who noticed that pitanga fruits grown in Argentina are much smaller than those collected in Brazil.
The SS values of the pitanga genotypes showed satisfactory values, similar to those observed by Bezerra et al. (2004) and by Dias et al. (2011), highlighting the role of this species as an excellent option for the industry 5,9,29,34. Fruits with high SS contents are usually preferred for both fresh consumption and industrialization since they provide higher yields after processing, given the higher nectar content produced per pulp volume 32. The general means obtained for SS were similar to the mean contents observed by Bezerra et al. (2004) and higher than those obtained by Dias et al. (2011) and Batista et al. (2014). This variation in the SS contents is probably due to genetic and environmental factors.
For TA, the wide variation observed may be related to the genetic components, which, along with the environmental factor, expressed the phenotype differently for this trait 6. Genotypes with TA contents above 1.00% are preferred by the agroindustry since there is no need to add acid to preserve the pulp and prevent microorganism development 20,24.
The chemical composition of pitanga fruits can be affected by factors such as their origin, climatic conditions, the genotypes analyzed, and the harvest season 10,17,23. The vitamin C contents were above those observed by Batista et al. (2014) and Sanches et al. (2017). The ascorbic acid content naturally present in fruits serves as a nutritional parameter due to the high antioxidant power of this component in preventing and combating several diseases, with a recommended daily allowance (RDA) of 75 mg day-1 for adult women and 90 mg day-1 for adult men 1.
Fruit pH showed ideal values for both fresh consumption and the industry. Low pH values favor fruit preservation, avoiding the addition of acids and preventing microorganism development 3. Therefore, high pH values are essential for fresh consumption in order to provide fruits with lower acidity. Similar pH values were observed by Bezerra et al. (2004) and Batista et al. (2014).
The SS/TA ratio is one of the best tools to evaluate fruit flavor, being more representative than the individual analysis of soluble solids and acidity 11. In this study, the ST/TA ratio showed significant variation among genotypes (coefficient of variation of 36.36 and 32.01%), with general means of 11.42 and 10.34 for the two cycles studied. These values agree with those observed in other studies 6,9,13.
Furthermore, the SS/TA ratio is a better parameter to assess the maturation stage than the isolated measurement of sugars and acidity, in addition to being an important parameter to evaluate fruit quality and one of the most usual ways to evaluate the flavor of food products 21. Therefore, fruits with high soluble solids contents and low acidity are preferable for a high SS/TA ratio.
The high genetic variability observed in 2017 and 2018 demonstrated that the preliminary results were satisfactory, especially compared to the preliminary results obtained by Bezerra et al. (1997). The occurrence of variation in the accessions is very important for plant breeders since this is their raw material 25.
Fruit traits should be analyzed for four or five consecutive production cycles according to the genetic improvement program of fruit species developed by Embrapa Clima Temperado 12 to select superior genotypes. This number of evaluations is considered adequate and effectively predicts the actual value of the individuals, showing more than 80% reliability for all traits and indicating that the traits can be used in the phenotypic selection of superior pitanga genotypes.
Conclusion
The pitanga genotype A12 showed larger fruit sizes, whereas genotype A8 showed the highest SS and AA contents in the second year.
Genotypes A2, A13, A34, and A39 showed the highest TA contents in pitanga fruits. The genotypes of group 8 (A11, A16, A45, A9, A26, and A44) showed the most significant pH and SS/TA ratio values in the pitanga fruits.

