


 English (pdf)
 Article in xml format
 Article references
 Send this article by e-mail
 Cited by SciELO
  Similars in
SciELO
Similars in
SciELO 
 Permalink
Introduction
Cowpea beans (Vigna unguiculata L. Walp) are one main product of family farming in Paraíba, and one major source of rural employment and income. As in other northeastern states, agricultural productivity is greatly affected by semi-arid conditions 37. However, according to Oliveira et al. (2001) low productivity is not only linked to unfavourable environmental conditions but also to the use of traditional, poor-quality cultivars.
Superior cultivars should meet a set of favourable agronomic and yield-related traits while satisfying both consumer and producer requirements 29. According to Cruz et al. (2012), selecting one or a few traits turns inefficient. While improving only a few selected variables, other undesired traits may be unintentionally selected. To overcome this limitation, breeders have used different selection methodologies 13,16,17.
Normally, selection indices are obtained from linear combinations of a set of variables, allowing a single value to perform an efficient selection with significant genetic gains 19. In other words, selection indices simultaneously combining several variables of economic importance, result in superior cultivars choices for this set of variables, regardless of any correlation among them 1,17.
Existing literature mentions several Selection Index methodologies for cowpea 5,33. However, there is strong need for new sets of variables with high heritability and ease of measurement. Additionally, these studies are still scarce in semiarid regions. Given the above, this work aimed to estimate genetic gains in production components, finding one selection index model providing greater gains through simultaneous selection of a set of variables for productive cultivars.
Material and methods
The experiment was carried out in an experimental field at the Center for Agrifood Science and Technology, Federal University of Campina Grande, CCTA/UFCG, Campus de Pombal - Paraíba, (06°46’ South latitude, 37°48’ West longitude) 4. According to Köppen’s classification, the climate is Aw, semi-arid, with summer and autumn rains and average annual rainfall of 800 mm, with the rainiest period between February and April, concentrating 60 to 80% of the total annual precipitation 25.
For experimental set-up, ploughing was carried out 15 days before sowing, followed by cross harrowing 5 days before bean planting, providing weed control for germination. Soon after this procedure, the plots were marked and randomly distributed in the field.
Sowing was manual and holes were opened with a hoe, at approximately 5 cm depth, placing three seeds per hole. Spacing was 0.5 m with five plants per linear meter 41.
Fertilization was carried out according to Fernandes (1993). Thinning was close to the ground, about 15 days after emergence, keeping two plants per hole. Pest management involved two sprays with Dimethoate (1.0 litre/ha-1) against aphids (Apis cracyvora Koch) and thrips (Order Thysanoptera), one spray with Methomyl (0.5 litre/ ha-1) for armyworm (Spodoptera frugiperda) and one with Imidacloprid and Beta-cyfluthrin (270 g/ha-1) for whitefly (Order Hemiptera).
The experimental design was randomized blocks 18 with eight treatments and four replications, totalling 32 experimental units, with 2.0 m spacing among blocks and plots. The treatments consisted of eight cowpea cultivars: Costela de Vaca (Control), BRS Marataoã, BRS Itaim, BR-17 Gurguéia, BRS Novaera, Paulistinha, Setentão and BRS Patativa.
Each experimental unit consisted of 9 m2 with six rows of plants and a useful area of 4m2. Spacing between rows was 0.5 meters, with fifteen holes and two plants per hole. Two lateral rows were considered borders. Data collection was carried out in the third and fifth rows.
Cultivar evaluation included phenology. The following characteristics related to precocity were evaluated: initial flowering (FL) and initial fruiting (DAFFF), determined by number of days between sowing and 50% of the plants with at least one flower or an open pod. Precocious plants were those reaching full flowering 70 days after sowing. This helped obtaining number of days between bloom and fruiting (DAFFH).
Manual harvest was performed with completely pale brown (dry) pods. During harvest, several yield components were measured. Total number of pods (TNP); pod unit mass (PUP, kg); pod length (PL, cm); pod diameter (PD, mm) obtained with a caliper; pod grain number (NGP), counting the grains of a sample of 10 pods; number of pods per plant (NPP), as the ratio between total pods in the usable area and number of plants; grain yield (GY, kg.) later transformed into tons per hectare; pod bark productivity (PDC, kg.), later transformed into tons per hectare; pod yield (PP, kg.), later transformed into tons per hectare, and seed/ pod ratio (PSR), as the ratio between total mass of grains and pod number.
Data were submitted to ANOVA using linear additive model of randomized blocks, according to Cruz (2006a). Means were grouped by the Scott and Knott test (1974) at 5% probability.
Genetic gains were estimated through Correlated response, Classic selection index proposed by Smith (1936) and Hazel (1943), Rank-sum-based index proposed by Mulamba and Mock (1978) and the index based on gains proposed by Pesek and Baker (1969) and Cruz et al. (2012). For genetic gain calculation in the correlated response and classic selection index, k value was established at 0.3, according to Cruz (2006b) for multicollinearity, allowing a correlation of 0.90 between the index and the genotypic aggregate. The methodologies proposed by Mulamba and Mock (1978) and Pesek and Baker (1969) exclude multicollinear variables. All genetic-statistical analyzes were performed by Genes software 11.
Results and discussion
The ANOVA revealed significant differences between the evaluated variables, except for TNP, PUP and NPP. Means grouping allowed the establishment of superior groups regarding the variables PL, PD, NGP, GY, PP, PSR, FL, DAFFF and DAFFH (Table 1, page 143).
Table 1: Mean grouping for evaluated in an experiment conducted in an experimental field at the Center for Food Science and Technology of the Federal University of Campina Grande in the city of Pombal - Paraíba. Tabla 1: Agrupación de los promedios de los caracteres evaluados en el campo experimental del Centro de Ciencia y Tecnología de Alimentos de la Universidad Federal de Campina Grande en la ciudad de Pombal - Paraíba.
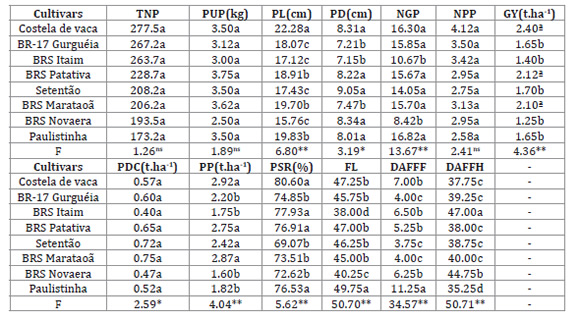
Total number of pods (TNP), pod unit mass (PUP, kg), pod length (PL, cm), pod diameter (PD, mm), pod grain number (NGP), number of pods per plant (NPP), grain yield (GY, kg.), pod bark productivity (PDC, kg.), pod yield (PP, kg.), seed/pod ratio (PSR), initial flowering (FL), initial fruiting (DAFFF) and number of days between bloom and fruiting (DAFFH). Means followed by the same letter belong to the same group by the Scott and Knott test at 5% probability. ** and * show significance at 1 and 5% probability; respectively by the F test. ns non-significant by the F test.
Número total de cápsulas (TNP); masa unitaria de la vaina (PUP, kg); longitud de la vaina (PL, cm); diámetro de la vaina (DP, mm); grano de vaina número (NGP); vainas por planta (NPP), grano rendimiento (GY, kg.); corteza de vaina productividad (PDC, kg.), rendimiento de vaina (PP, kg.), semilla/proporción de cápsulas (PSR), inicial floración (FL), inicial fructificación (DAFFF) y número de días entre florecer y fructificar (DAFH). Las medias seguidas de la misma letra pertenecen al mismo grupo según la prueba de Scott y Knott al 5% de probabilidad. ** y * muestran significancia al 1 y 5% de probabilidad; respectivamente; por la prueba de F. ns no significativa; por prueba F.
The ANOVA showed great genetic variability among cultivars, as verified by Rocha et al. (2003) and Silva and Neves (2011), who also detected significant cultivar effect on grain yield 39. This result allows the application of different selection index methods with favourable perspectives of simultaneous gains in a set of variables 24. Rodrigues et al. (2017), verified the existence of genetic variability in cowpea cultivars under water stress conditions and successfully applied different selection index methodologies, identifying superior genotypes.
Regarding mean grouping, three groups were established for PL, emphasizing cultivar Costela de vaca, with the greatest pod length and separately allocated in group ‘a’. According to Araújo (2019), pod length varies from 15 to 20 cm. This author emphasizes the importance of smaller pods for mechanized harvesting and larger pods for manual harvesting. In the present work, the results were diverse with smaller pod cultivars for mechanized harvesting and larger pods (> 18cm) for manual harvesting, suitable for small farmers without financial and technological resources to implement mechanized harvesting.
For PD, two groups are observed. Group "a" comprises cultivars Costela de vaca, BRS Patativa, Setentão, BRS Novaera and Paulistinha. For Costa et al. (2021), larger diameter pods would contain heavier seeds.
Two groups were also established for NGP. Cultivars Costela de vaca, BRS Marataoã, BR-17 Gurguéia, Paulistinha, Setentão and BRS patativa were allocated to group ‘a’. This variable has already been stated as one primary component of production 40, Andrade et al. (2010) estimated genetic parameters and correlations in cowpea demonstrating that this variable must be carefully studied in selection indices models, since it is related to other primary components, including PL.
Regarding GY variables, cultivars Costela de vaca, BRS Marataoã and BRS Patativa were allocated to group ‘a’ while cultivars Costela de vaca, BRS Marataoã, Setentão and BRS Patativa were allocated to group ‘a’ for GY and PP. According to Freire Filho et al. (2007), grain yield constitutes an important commercial trait for expanding consumption, industrial processing and commercialization of seeds among farmers. These authors also emphasize that high off-season production reaches high market prices. Cultivars Costela de vaca, BRS Marataoã and BRS Patativa showed better GY performance than the other cultivars due to gene recombination and possible transgressive segregation 31. However, before effectively selecting these cultivars, it must be considered that GY is determined by several genes and correlated with several other primary components. Therefore, to truly obtain superior cultivars, evaluating models of selection indices simultaneously gathering several favourable attributes, becomes necessary 5,12.
For PSR, Costela de vaca, BRS Itaim, Paulistinha and BRS Patativa were placed in group ‘a’. Regarding FL, four groups were found and Paulistinha was separately allocated to group ‘a’. Noteworthy is that BRS Itaim showed higher precocity in relation to the others. As to DAFFF, three groups resulted with Paulistinha separately allocated to group ‘a’.
Finally, for DAFFH, four groups separately allocated BRS Itaim in group ‘a’ and cultivar Paulistinha in group ‘d’.
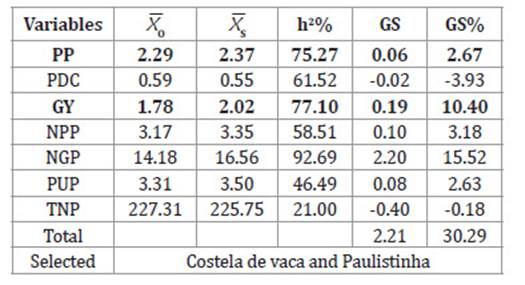
Genetic gains obtained by correlated responses, that is, by direct and indirect selection, are shown in Table 2.
Table 2: Estimates of original means ( o ), selected cultivars ( s ), broad sense heritability (h2) and direct and indirect selection gains (GS) for 13 traits, evaluated in 8 cowpea cultivars. Tabla 2: Estimaciones de medias originales ( o ), cultivares seleccionados ( s ), heredabilidad en sentido amplio (h2) y ganancias de selección directa e indirecta (GS) para 13 caracteres, evaluados en 8 cultivares de caupí.
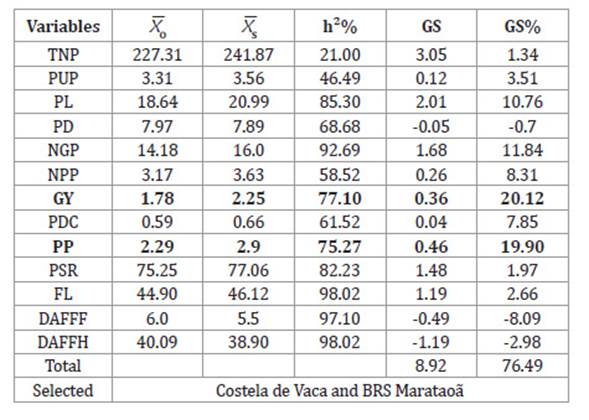
It appears that direct selection of PP provides, for most of the studied variables, considerable genetic gains, PD, DAFFF and DAFFH.
The variable PP is the main GY determinant, given high direct phenotypic and genotypic effects. Direct selection on this easy-to-measure secondary component allows a response correlated with a high magnitude (>20%) genetic gain in the main variable GY.
Direct selection in POS also provides considerable gains in NGP, NPP, PL and PDC. For the vari ables TNP and PUP, whose heritability coefficients were low, it is possible to obtain genetic gains.
Falconer (1987) states that obtaining greater gains with indirect selection is possible when the auxiliary variables have higher heritability than the main variable, as for NGP and PL. Corroborating this, Gonçalves et al. (2007), stated that to obtain superior cultivars by simultaneously combining a series of favourable attributes and higher productivity, evaluating different selection index methodologies is important 28. Selection gains obtained by the methodology of Smith (1936) and Hazel (1943) are presented in Table 3 (page 145).
Table 3: Estimates of original means ( o ), selected cultivars ( s ), heritability (h2), covariances (Cov) and indirect selection gains (GS) based on the Smith (1936) and Hazel (1943) index for 7 traits, evaluated in 8 cowpea cultivars. Tabla 3: Estimaciones de medias originales ( o ), cultivares seleccionados ( s ), heredabilidad (h2), covarianzas (Cov) y ganancias de selección (GS) indirecta basadas en los índices de Smith (1936) y Hazel (1943) para 7 caracteres, evaluados en 8 cultivares de caupí.
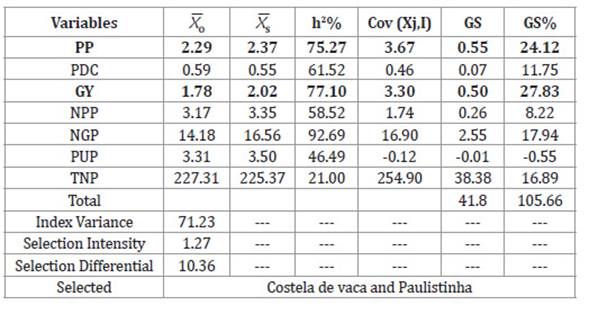
This methodology allows obtaining significant and simultaneous genetic gains in important primary yield components, with the exception of PUP. However, this simultaneous selection only caused few changes in this variable (-0.01). Therefore, one can consider null changes in PUP and proceed with a safe selection.
In popcorn, Granate et al. (2002) used several selection index methodologies and obtained significant genetic gains. Gains obtained with the Smith (1936) and Hazel (1943) indices were superior to those predicted with other indices, as also obtained by Rodrigues et al. (2017), when selecting cowpea populations under water stress. According to Cruz et al. (2012), the Smith (1936) and Hazel (1943) indices are superior to direct selection because they consist of linear combinations of several economic variables, whose weighting coefficients maximize the index/genotypic aggregate correlation.
Table 4 shows genetic gains obtained according to Mulamba and Mock (1978), considering variable exclusion after multicollinearity.
Table 4: Original means ( o ), of selected cultivars ( s ), heritability (h2), covariances (Cov) and indirect selection gains based on the sum of ranks for 7 traits, evaluated in 8 cowpea cultivars. Tabla 4: Estimaciones de medias originales ( o ), cultivares seleccionados ( s ), heredabilidad (h2) y ganancias de selección indirecta (GS) basadas en la suma de rangos para 7 caracteres, evaluados en 8 cultivares de caupí.
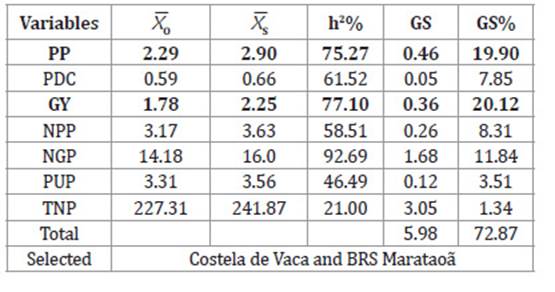
Once again, significant and simultaneous genetic gains were obtained in primary components of production. No undesired changes in PUP were obtained through the rank sum methodology. In fact, given the simplicity of result interpretation, the rank sum methodology is among the most used in genetic improvement for estimating selection gains. The signif icant genetic gains here obtained using the sum of ranks, although slightly lower than those obtained by Smith (1936) and Hazel (1943) methodologies, are given by an economic weight equivalent to CVg that considers all the evaluated variables as the main ones 6.
Table 5, shows genetic gain estimates based on the desired gain methodology proposed by Pesek and Baker (1969).
Table 5: Original averages ( o ), of selected cultivars ( s ), heritability (h2), covariances (Cov) and indirect selection gains based on selection by the Pesek and Baker (1969) index for 7 traits evaluated in 8 cowpea cultivars. Tabla 5: Estimaciones de medias originales ( o ), cultivares seleccionados ( s ), heredabilidad (h2) y ganancias de selección indirecta (GS) basadas en la selección por médio del índice de Pesek y Baker (1969) para 7 caracteres, evaluados en 8 cultivares de caupí.
The methodology based on desired gains provided simultaneous gains in the POS, GY, NPP, NGP and PUP variables. However, it caused undesired changes in PDC. Despite having provided significant gains in NGP (above 15%), it did not provide greater gains in POS and GY, as also evidenced in other studies 36. It should be noted that this methodology was developed after the difficulty of establishing relative economic weights to the variables, replacing them with the desired gains. These desired gains, according to Crossbie et al. (1980) and Vieira (1988) could be replaced by the genetic standard deviation for each variable. However, despite the use of genetic standard deviation, the results do not outweigh gains obtained with other indices. Rodrigues et al. (2017) also used the Pesek and Baker (1969) methodology along with the sum of ranks and the classic Smith (1936) and Hazel (1943) indices, obtaining similar results in magnitude and direction, but undesired changes in grain index when using the desired gains index. These divergent results can be explained by the limitations of the genetic structure of the breeding population 23. Thus, it is up to the breeder choosing the best methodology to find the greatest genetic gains, and practice selection with greater safety.
Conclusions
Direct selection in the secondary component PP provides significant genetic gains in the main variable GY;
The classic selection index presents a greater distribution of genetic gains for the main variable and for the primary components of production;
Cultivars Costela de vaca, BRS Marataoã and Paulistinha are recommended for cultivation and commercial exploitation in the semiarid region of Paraíba.

