


 English (pdf)
 Article in xml format
 Article references
 Send this article by e-mail
 Cited by SciELO
  Similars in
SciELO
Similars in
SciELO 
 Permalink
INTRODUCTION
Kidneys are the organs in charge of maintaining a stable internal environment, which means the regulation of extracellular fluids, electrolytes, and the acid-base balance. Therefore, patients with end-stage kidney disease are more likely to develop complications, such as malnutrition. Malnutrition and protein-energy wasting are present in too many patients with chronic renal insufficiency(1). This fact is mainly due to alterations in protein and energy metabolism, hormonal imbalance, infections, and reduced food intake due to anorexia, nausea, and vomiting, caused by uremic toxicity(2).
In recent years, research on patients in hemodialysis (HD) has reported an association between signs of malnutrition, namely, reduced serum albumin, dry weight, total cholesterol, and increased morbidity and mortality(3,4). Various studies have evaluated the nutritional status of patients at the start of dialysis programs and have found a high incidence of alterations indicative of protein-calorie malnutrition(4). In addition, their serum albumin tends to be below average, which is significant since hypoalbuminemia is the most important single risk factor predicting mortality in hemodialysis patients(5).
Also significant are atherosclerosis (aggravated by hypertension and smoking) and other mechanisms, such as oxidative stress, inflammation, and malnutrition in patients with HD(6,7,8). Such patients tend to have a low body mass index, altered lipoprotein profiles, and high levels of LDL, all of which are predictors of low survival(9,10,11,12).
In general, the prevalence of malnutrition ranges from 18% to 75% in different cohorts of chronic kidney disease (CKD) patients(13). Data from five European countries participating in the Dialysis Outcomes and Practice Patterns Study (DOPPS), which evaluated specific nutritional indicators in 2,498 patients, showed a considerable variation in these parameters between countries. For example, the prevalence of moderate-severe malnutrition measured by subjective global assessment (SGA) was lower in Spain (14.4%), whereas the highest prevalence was recorded in France (22.5%)(14). A similar report shows a prevalence of about 20% in the USA(15).
In 2008, because of the urgent need for a universal definition of malnutrition and in order to avoid conceptual errors and misinterpreted data, the International Society of Renal Nutrition and Metabolism (ISRNM) proposed the standardized use of the term "protein-energy wasting" to foster a better understanding and treatment of nutrition problems in uremic patients. This panel of experts defined "protein-energy wasting (PEW)" as "the state of decreased body stores of protein and energy fuels (that is, body protein and fat masses)."(13).Table 1lists the ISRNM criteria for the diagnosis of PEW.
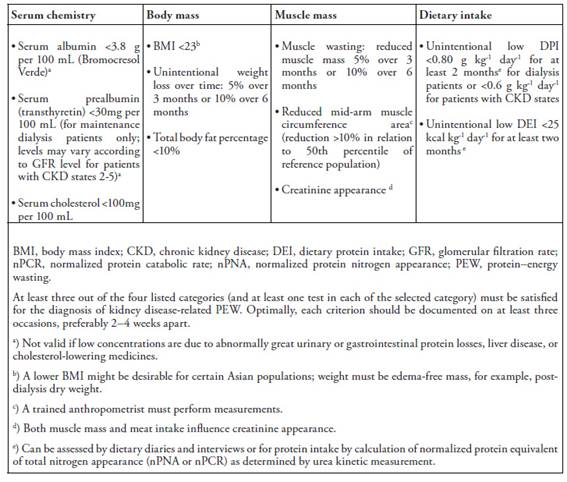
Table 1: PEW diagnostic criteria
The longitudinal study presented in this paper evaluated the nutritional evolution of a sample of hemodialysis patients over five years. For this purpose, we assessed modifications in their body mass index (BMI) and the relation of the BMI to biochemical and nutritional parameters such as total proteins (TP), serum albumin (Alb), Total Cholesterol (TC), and plasma transferrin (Tr). The objective was to determine whether these patients suffered alterations produced by nutritional deterioration directly related to dialysis time.
MATERIALS AND METHODS
Subjects
The sample population comprised 90 patients of both genders (47 males and 43 females), aged 18 to 83 years, with chronic renal insufficiency. All subjects regularly received hemodialysis in the kidney unit of the Virgen de las Nieves University Hospital in Granada (Spain). They had been in treatment for at least three months, the time necessary to ensure their clinical stabilization in the predialysis stage. The subjects were not randomly selected. Their participation in the study was determined by the fact that they received treatment at the dialysis center from January 2015 to December 2019, the five-year duration of the research study. shows the etiology of the kidney disease of the subjects.
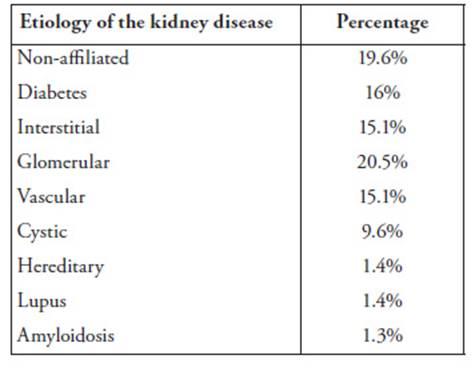
Table 2: Etiology of the kidney disease of the sample population
Methods
Hemodialysis was performed with a single-use capillary dialyzer and a biocompatible synthetic membrane, the same for all patients. However, depending on dialysis needs, a high-permeability dialyzer was used with a higher ultrafiltration coefficient and clearance rate of molecules with no difference in the degree of biocompatibility of the membrane or sterilization technique. Hemodialysis was administered in three weekly sessions. The composition of the dialysate fluid was the following: sodium 140 mmol/l (sodium chloride 174.35 g); potassium 1.5 mmol/l (potassium chloride 4.12 g); calcium 1.5 mmol/l (calcium chloride 2H20 8.14 g); magnesium 0.5 mmol/l (magnesium chloride 6H20 3.76 g); chlorine 5 mmol/l, HCO3; 35 mmol /l; CH3COO 4 mmol /l; glucose 1g/l; osmolarity 295 mosm/l.
The patients received conventional hemodialysis, which followed International Therapeutic Guidelines(19)and applied the uremic kinetic model based on the second-generation Daugirdas equation to maintain Kt/V values equal to or greater than 1.2. The length of each hemodialysis session was modified accordingly (from 180 to 270 minutes). Enoxaparin, erythropoietin, parenteral iron, thiamine, L-carnitine, and vitamin C were intravenously administered to all patients.
According to the analytical controls in the dialysis center, plasma albumin (Alb), total cholesterol (TC), and total proteins (TP) were measured quarterly, and transferrin (Tr) was measured monthly. Blood samples were collected directly from the vascular access for hemodialysis before the beginning of the treatment and the administration of heparin.
Peripheral blood samples were taken between 8.30 a.m. and 9 a.m., and between 1.30 p.m. and 2 p.m., given the long duration of the study and ever during the patient's morning and afternoon schedule for the hemodialysis session. The sample consisted of 6 ml of blood extracted in a Venoject® II tube (Terumo; autosep®). The biochemistry determinations were made at 37º with a Roche/Hitachi 747 clinical chemistry analyzer and the corresponding reagents, also supplied by Roche. Albumin concentrations were determined with the bromocresol green dye binding (BCG) method.
In order to evaluate the hydration and nutritional status of the patients, we used the bioelectrical impedance vector analysis (BIVA). A bioelectrical impedance measurement (BIA) was performed for all patients by the same evaluator, equipment, and methodology. Patients were fasting overnight or for 4 hours, without metallic objects, without having exercised intensely or having consumed alcoholic beverages 24 hours before the measurement, and, in the case of women, without being in their menstrual period.
The bioelectrical impedance was measured with mono-frequency equipment (50 kHz), model RJL System Quantum II, immediately before initiating the hemodialysis session and 10 minutes after the end.
Extracellular water (ECW), intracellular water (ICW), total body water (TBW), fat mass (%), and fat-free mass (FFM) were estimated using formulated prediction equations in the manufacturer's software by measuring impedance values in different frequencies. PA was recorded (the arc tangent of the Xc/R ratio).
In addition, anthropometric measurements of weight and height were performed with a balance/stadiometer (Perperson 113481). Weight was measured in kilograms and height in centimeters. BMI was calculated with the formula: weight (kg)/height (m2). Patients were then classified in one of the following WHO categories: (i) underweight [BMI < 18.50]; (ii) normal [BMI 18.50 - 24.99]; (iii) overweight [BMI 25 - 29.99]; (iv) obese [BMI ≥ 30]. According to the International Society of Renal Nutrition and Metabolism, the malnutrition threshold corresponded to a BMI < 23 kg/m2 and albumin levels <3.8 g/dl(12).
Statistical analysis
The SPSS 15.0.1 software package was used for the statistical analysis. The significant differences between BMI, biochemical parameters, and years were evaluated with an analysis of variance (ANOVA). In addition, the Kaplan Meier estimator was used to assess patient survival concerning albumin and BMI. All data are expressed as a mean value ± standard deviation (X ± SD) based on a statistical significance of p < 0.05.
RESULTS
As shown inTable 3, mean total protein levels progressively decreased from the first to the fifth year of the study.
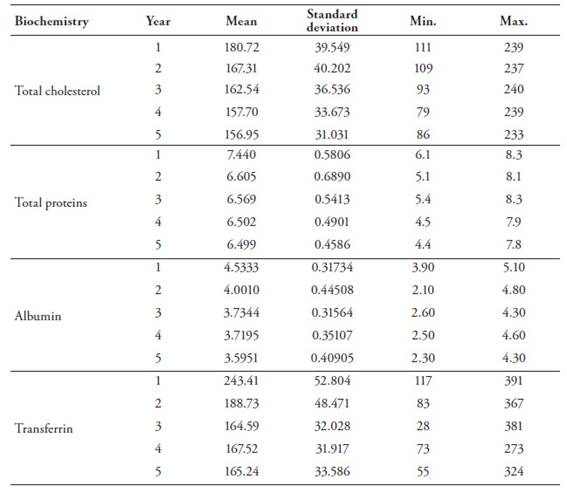
Table 3: Biochemical parameter values of the sample population
Reference values for total plasma proteins ranged from a minimum of 6 g/dl to a maximum of 8.3 g/dl. Values below 6g/dl were not recorded during the first year. However, the situation changed dramatically in the second year, and 40.4% of the values were lower than 6g/dl. There was a slight improvement in the third year, with 34% below the minimum reference value. The improvement continued in the fourth year with 25.5% and 25.4% in the fifth year. Average plasma albumin levels also dropped significantly during the five years of the study (seeTable 3). During the first year, no values were below the minimum reference values (3.4 - 5.4 g/dl), whereas in the second year, 16.1% of values were lower than the minimum. In the following years, the situation became worse since there was a steady increase of patients with levels lower than the minimum: 35.7% (third year):48.2% (fourth year), and 49.6% (fifth year). None of the patients had plasma albumin levels higher than the laboratory reference values.
Regarding total cholesterol levels, values also progressively decreased from the study's first to the fifth year (seeTable 3). During the first year, 7.1% of the values were below the minimum reference value (150 mg/dl). However, this percentage rose to 28.6% during the second year, slightly increasing to 29.2% in the third year. The percentage soared to 47% in the fourth year and finally rose to 48.2% in the fifth year. The values obtained ranged from a minimum of 79 mg/dl to a maximum of 305 mg/dl.
Transferrin values also decreased from the study's first to the fifth year (seeTable 2). As reflected in the results, 9% of the patients presented low plasma transferrin values during the first year, a percentage that rose to 15.3% in the second year. The percentage increased to 41.1% in the third year, then plateaued to 42.7% (fourth year) and 41.6% (fifth year).
During the five years of our study, the patients experienced a statistically significant decrease in total proteins, plasma albumin, total cholesterol, and transferrin (p < 0.0001). In contrast, the mean BMI values did not show statistically relevant differences (p < 0.805). Nevertheless, as can be observed, all the patients remained in the WHO overweight category (seeTable 4).

Table 4: Evolution of the annual mean BMI values of the sample population.
As reflected in the average BMI values classified in the WHO categories, the percentage of overweight and obese patients steadily increased yearly (Table 5).

Table 5: Evolution of the annual mean values of the BMI categories (WHO classification) for the sample population
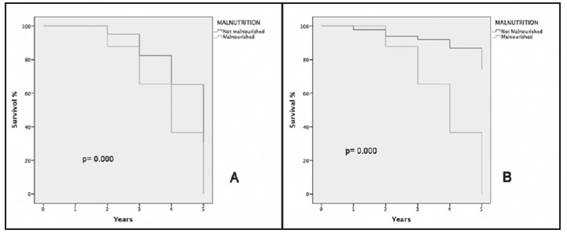
Figures 1: A and 1B show that patients suffering from malnutrition with a BMI < 23kg/m2 and albumin levels < 3.8 g/dl present a much lower survival than non-malnourished patients.
Figure A: Kaplan Meier survival graph of patients with and without malnutrition and albumin <3.8 g/dl. Figure B: Kaplan Meier survival graph of patients with and without malnutrition and BMI < 23kg/m2
The body composition data of the study participants are summarized inTable 6. We did not detect significant differences in total body water (TBW), extracellular water (ECW), or intracellular water between (ICW) pre and postdialysis patients.
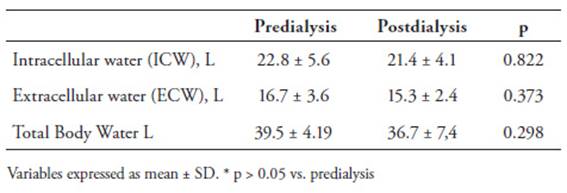
Table 6: Evolution of the mean volume assessments values of the sample population
DISCUSSION
The nutritional status of patients on hemodialysis has always been a complex issue to evaluate because of the lack of standardized criteria that can be used to identify a state of protein-calorie malnutrition (PCM)(17). PCM leads to a decrease in the body's protein and fat content. It is a frequent disorder in dialysis patients. It can have many causes since the dialysis procedure leads to nutrient losses through the dialysis fluid and decreased protein synthesis during treatment(18,20).
Nevertheless, when patients begin dialysis, there is an immediate improvement in these parameters, as reflected in an increase in serum albumin, prealbumin, acute phase reactants, and serum creatinine concentration(20,21). These facts positively affect their appetite and improve their nutritional status. However, as the treatment continues over a more extended period, malnutrition becomes a problem because of the loss of appetite caused by uremia and hemodialysis(23,24).
Regarding the evaluation of the different biochemical parameters used to assess the nutritional status of patients, total protein levels are significantly related to death risk(25). Moreover, because of the correlation between the levels of total serum proteins and serum albumin (r = 0.411, p < 0.01), it is generally agreed that both parameters can be used to evaluate nutritional status since they reflect the visceral protein mass. However, its importance as an early nutritional marker is considered linked to albumin values and is less sensitive(26,27).
The results showed a progressive reduction in the annual mean values of total proteins and serum albumin. During the five years of the study, these values experienced a significant decrease (p<0.0001) though the reduction in protein levels was less pronounced than the reduction in albumin levels. Serum albumin is a significant nutritional marker of malnutrition in patients with chronic kidney disease. Various studies have shown that a serum albumin level below 3.5 g/dl significantly predicts mortality and hospitalization in chronic hemodialysis patients, primarily because of cardiovascular problems(28).
During our study, the mean total cholesterol values of the patients also decreased significantly (p<0.0001). In consonance with international guidelines and the HEMO Study(29), a total cholesterol value lower than 150 mg/dl was considered an indicator of malnutrition. The fact that patients in dialysis tend to suffer from hypocholesterolemia was confirmed by the low total cholesterol values reported in our study. These findings agree with previous research(30,31), which affirms that a low total cholesterol level is a clear sign of poor nutritional status. Chronic kidney disease produces substantial alterations in lipoproteins from the earliest stages of the disease. One of the most frequent is the association between hypertriglyceridemia and low HDL(32). The lipid profile in hemodialysis patients is even more complex because malnutrition and inflammation can decrease total cholesterol and LDL levels.
Our results showed that transferrin levels decreased significantly during the five years of the study (p <0.0001) and were well below the values of the normal-nourished population. Serum transferrin levels are affected by nutritional factors (such as serum albumin levels during a stress response) and iron metabolism(33). The shorter half-life of transferrin gives it a theoretical advantage over albumin as a nutritional marker, even though both serum transferrin and albumin levels correlate with the risk of morbidity and mortality in dialysis patients(34).
The BMI was proposed as an index of protein-calorie malnutrition (Chazot, 2001) comparable to arm circumference(35). However, it is not a very important nutritional factor in dialysis patients. Many studies have analyzed BMI as a possible malnutrition indicator. They have not found any direct relation and consider it a weak predictor of patient survival(36,38). Others also regard BMI as a weak determinant of nutritional status and have even challenged the need to increase BMI and maintain muscle mass to reduce patient mortality rate39,41. Our results showed that serum albumin represents a nutritional risk for the dialysis population when defined according to the International Society of Renal Nutrition and Metabolism criteria.
Our study did not find any statistically significant differences that reflect the importance of BMI as an anthropometric factor and predictor of malnutrition. BMI only acquires importance when it is defined according to criteria similar to serum albumin.
CONCLUSIONS
During the five years that our population of hemodialysis patients was monitored, the values of the biochemical markers analyzed were low and progressively decreased. Total cholesterol and transferrin values suffered the most remarkable alteration and were the markers more indicative of nutritional changes in our patients.
After this evaluation period, a significant decrease in nutritional biochemical parameters was observed, namely, in total proteins, albumin, total cholesterol, and transferrin. These low values reflect the nutritional deterioration of patients as the treatment progressed and show the need to address the nutrition of the CKD patient at the onset of hemodialysis and as a fundamental part of the therapy. As evidenced in our results, BMI was not associated with malnutrition. For this reason, the nutritional deterioration of patients in hemodialysis is mainly reflected in their serum chemistry and not in the anthropometric data.
Recibido: 16-11-2022
Corregido: 24-11-2022
Aceptado: 12-05-2023

