


Servicios Personalizados
Revista

Articulo
 texto en
  Inglés (pdf)
 Articulo en XML
 Referencias del artículo
 Enviar articulo por email
Indicadores
-
 Citado por SciELO
Links relacionados
-
 Similares en
SciELO
Similares en
SciELO
Compartir

 Permalink
Archivos argentinos de pediatría
versión impresa ISSN 0325-0075versión On-line ISSN 1668-3501
Arch. argent. pediatr. vol.114 no.2 Buenos Aires abr. 2016
http://dx.doi.org/10.5546/aap.2016.135
ORIGINAL ARTICLE
http://dx.doi.org/10.5546/aap.2016.eng.135
Percentiles of body fat measured by bioelectrical impedance in children and adolescents from Bogotá (Colombia): the FUPRECOL study
German D. Escobar-Cardozo, B.S.a, Jorge E. Correa-Bautista, Physical Therapist", Emilio Gonzalez-Jiménez, Nurseb,c, Jacqueline Schmidt-RioValle, Nurseb,c and Robinson Ramírez-Vélez, Physical Therapista
a. Center for Physical Activity Measurement, School of Medicine and Health Sciences, Universidad del Rosario, Bogotá, Colombia.
b. Nursing Department. School of Health Sciences. Avda. de la Ilustración, un numbered (18016). Universidad de Granada, Spain.
c. CTS-436 Group, affiliated to the Mind, Brain and Behavior Research Center.
E-mail address: Robinson Ramírez-Vélez, Physical Therapist: robin640@hotmail.com
Funding: This study is part of the FUPRECOL project (Association between prehensile force and early signs of cardiovascular risk in Colombian children and adolescents), funded by the Administrative Department of Science, Technology and Innovation Colciencias, agreement no. 122265743978.
Conflict of interest: None.
Received: 07-29-2015
Accepted: 10-26-2015
ABSTRACT
Objective. The analysis of body composition is a fundamental part of nutritional status assessment. The objective of this study was to establish body fat percentiles by bioelectrical impedance in children and adolescents from Bogotá (Colombia) who were part of the FUPRECOL study (Asociación de la Fuerza Prensil con Manifestaciones Tempranas de Riesgo Cardiovascular en Niños y Adolescentes Colombianos - Association between prehensile force and early signs of cardiovascular risk in Colombian children and adolescents).
Methods. This was a cross-sectional study conducted among 5850 students aged 9-17.9 years old from Bogotá (Colombia). Body fat percentage was measured using foot-to-foot bioelectrical impedance (Tanita®, BF-689), by age and gender. Weight, height, waist circumference, and hip circumference were measured, and sexual maturity was self-staged. Percentiles (P3, P10, P25, P50, P75, P90 and P97) and centile curves were estimated using the LMS method (L [BoxCox curve], M [median curve] and S [variation coefficient curve]), by age and gender.
Results. Subjects included were 2526 children and 3324 adolescents. Body fat percentages and centile curves by age and gender were established. For most age groups, values resulted higher among girls than boys. Participants with values above P90 were considered to have a high cardiovascular risk due to excess fat (boys > 23.428.3, girls > 31.0-34.1).
Conclusions. Body fat percentage percentiles measured using bioelectrical impedance by age and gender are presented here and may be used as reference to assess nutritional status and to predict cardiovascular risk due to excess fat at an early age.
Key words: Reference values; Pediatrics; Body composition; Fat; Cardiovascular risk factors.
INTRODUCTION
Overweight and obesity are characterized by an increased body fat mass resulting from an imbalance between food intake and energy expenditure.1-3 According to the latest
Survey on Nutritional Situation in Colombia,3 among children younger than five years old, 5% are obese and 20% are overweight, and 74% of children aged 13-17 years old do not meet the minimum physical activity level recommended for the age group, in addition to the prevalence of overweight and obesity in this population group (13.4%).4,5
In this context, body composition and nutritional status should be considered in the clinical setting due to the possibility of detecting nutritional problems from an early age.6-10 To this end, several authors11-18 have proposed different techniques, such as neutron activation, magnetic resonance imaging, densitometry and hydrometry, air displacement plethysmography, isotope dilution methods, dualenergy X-ray absorptiometry (DXA), anthropometry, and bioelectrical impedance analysis (BIA). These methods have gained relevance due to the increasing prevalence of overweight and obesity in early life and their harmful effects on health.
South America has been described as having particular growth, development and childhood body composition characteristics resulting from the intermingling of European, Native American and African ancestors, so it is difficult to make a clear differentiation between environmental and genetic factors.2,19 Thus, it is necessary to study body composition as a priority in primary health care. This study presents percentiles of body fat percentage (%BF) by BIA in a population of students from Bogotá (Colombia).
METHODS
Study design and sample: This study is part of the FUPRECOL project, whose methodology has been previously published.5,19,20 This is a crosssectional study conducted in 6000 children and adolescents aged 9-17 years old living in Bogotá and attending 24 school facilities in urban areas. Geographic distribution was non-random, and the sample was selected by convenience. Students with learning, physical and sensory disabilities, noncommunicable diseases, such as type 1 or type 2 diabetes, cardiovascular disease, autoimmune disorders or diagnosed cancer, alcohol or drug abuse, or who were pregnant and, in general, those with conditions not directly related to nutrition, such as inborn errors of metabolism, metabolic syndrome, morbid obesity, psychiatric disorders (anorexia, bulimia), etc. were excluded. The sample size for this study was estimated based on a mean %BF of 19.3 and a standard deviation (SD) of 4.8 obtained from a previous Colombian study,21 with a 5% alpha error, a 20% beta error, a 2% accuracy and an 80% a priori power.
Body composition: Weight was measured using a TANITA® BF-689 floor scale (Arlington Heights, IL 60005, USA), with a 0.1 kg resolution. Height was measured using a SECA 206® portable stadiometer (Hamburg, Germany), with a 0-220 cm range and a 1 mm precision. Based on these variables, body mass index (BMI) was estimated in kg/m2. Waist circumference (WC) and hip circumference (HC) were measured based on the anatomic landmarks described by the World Health Organization (WHO).8,22 BIA was implemented to establish %BF by means of the bipolar foot-to-foot technique and using a TANITA® BF-689 floor scale (Arlington Heights, IL 60005, USA).23 According to Kasviset et al.,11 the bipolar BIA equipment has demonstrated to be reliable and valid because it includes prediction equations to estimate %BF adjusted by age and gender in 5-17 year-old children. Validation tests and equations are available from the manufacturer's website (http://www.tanita.com/en/bf-689/) or from the study conducted by Kasviset et al.11 Frequency of induction was assessed at a 50 kHz intensity, with a sensitivity for estimating fat mass of 0.1 kg (0.1%). Measurement was done following a 10-12 hour-fasting, with an empty bladder and on a non-conductive surface. The technical error of measurement (TEM) was 0.639 and the repeatability coefficient, 0.985%.19 Participants' maturation stage was assessed as per Tanner's methodology,24 after a validation of South America's pediatric population conducted by Matsudo et al.25 and based on maturation self-staging.26
Ethical aspects: The FUPRECOL study was conducted in accordance with the renowned deontological standards included in the Declaration of Helsinki and Resolution 008439 issued by the Ministry of Health of Colombia in 1993 for the regulation of clinical research involving human beings, and was approved by the Committee of Research involving Human Beings of the coordinating site (UR no. CEI-ABN026-000262). Before measurements were made, each child/adolescent agreed to participate and their father/mother or legal tutor signed a written informed consent in representation of the minor.
Statistical analysis: Homogeneity of variance tests were implemented (ANOVA) to study differences among continuous outcome measures by gender and age. Continuous values were expressed as mean and SD. Centile curves were estimated using the LMS method proposed by Cole and Green27 in the LMSchartmaker Pro software, version 2.54 (http://homepage.mac.com/tjcole/FileSharing1.html)27 and percentiles (P3,P10, P25, P50, P75, P90 and P97) by age and gender were estimated using the Statistical Package for Social Science® software, version 22 (SPSS; Chicago, IL, USA). Pearson's correlation coefficient was used to assess the relationship between %BF by BIA and the outcome measures BMI, WC and HC. Statistical significance was set at p < 0.05.
RESULTS
The sample was made up of 5850 students (56.8% girls) who attended 24 official school facilities in the city of Bogotá (Colombia). For all age groups, and according to the ANOVA, boys had larger WC and BMI values than girls, while girls had a larger HC and %BF by BIA; p < 0.01 (Table 1).
Table 1. Anthropometric characteristics of assessed students (n= 5850)
Table 2 shows the percentile distribution of %BF by BIA by age and gender. Across all age groups, body fat was higher among girls than boys, and mean ± SD decreased from 9 to 17.9 years old in the group of boys. Median %BF among boys from Bogotá who were 9-17.9 years old reduced by -5.5%, but it increased 1.5% among girls. However, increments in each group varied by age group.
Table 2. Percentile distribution of fat percentage measured by bioelectrical impedance by age and gender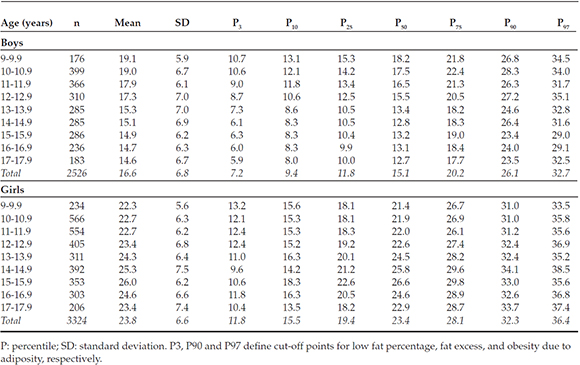
Figure 1 shows centile curves (from the bottom up: P3,P10, P25, P50, P75, P90 and P97) of %BF by BIA in the studied population. Among girls, P50 is relatively flat and ranges from 21.4% to 26.6% of body fat across all age groups, reaching its peak at 15 years old. Variability increases up to 14 years old, with a marked increase in positive asymmetry. Among boys, %BF reduces up to 14 years old, with a remarkable leveling up to 17 years old. At 17 years old, girls have proportionally 35% more body fat than boys (mean: 14.6 ± 6.7 in boys versus 23.4 ± 7.4 in girls).
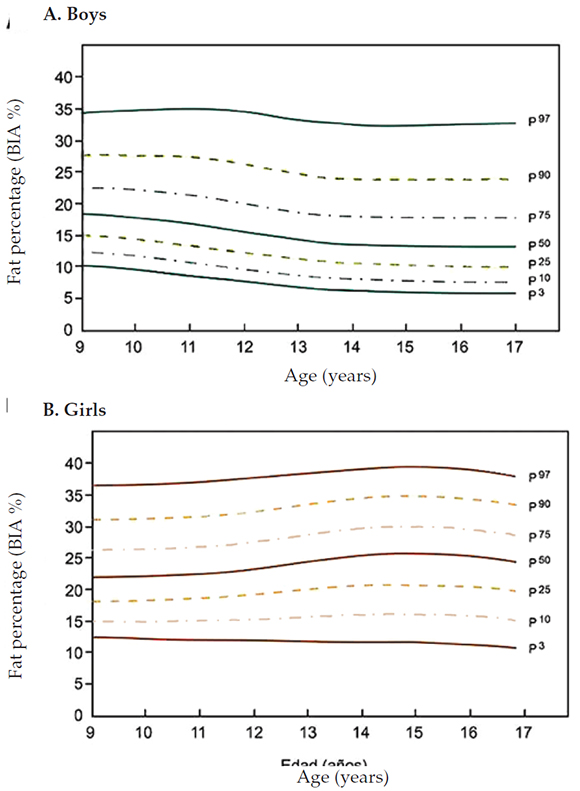
Figure 1. Centile curves of fat percentage measured by bioelectrical impedance in a population of students from Bogotá (Colombia)
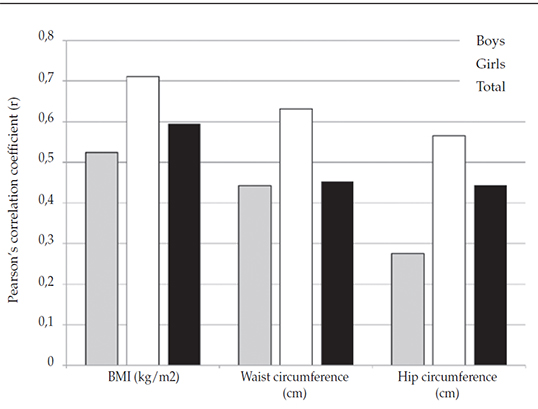
Figure 2. Partial correlations among fat percentage measured by bioelectrical impedance, body mass index, waist circumference, and hip circumference in children and adolescents from Bogotá (Colombia)
As an additional analysis, and to verify if %BF by BIA was related to other anthropometric measurements, a correlation analysis with Pearson's (r) coefficient was done. In the general population, BIA showed a positive relationship to BMI (r = 0.595), WC (r= 0.453) and HC (r= 0.443); p < 0.01. If assessed by gender, the "r" coefficient increased substantially among girls: BMI (r= 0.711), WC (r= 0.631) and HC (r= 0.565); p < 0.01.
DISCUSSION
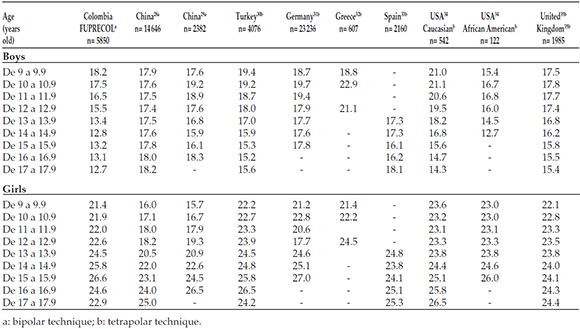
This study presents, for the first time in Bogotá (Colombia), percentile tables and centile curves of %BF measured by BIA by age and gender, which may be used as reference for assessing nutritional status and body composition in the setting of pediatrics and education. Girls showed higher %BF values than boy across all age groups. Without using statistical procedures, it was observed that median (P50) BIA in both male and female children and adolescents from Bogotá was lower than what was described in almost all studies referenced here.15,28-35 Among boys, %BF by BIA was lower than what has been observed in subjects from China,28,29 Turkey,30 Germany,31 Greece,32 Spain,33 and the USA (Caucasians),34 except for students from the United Kingdom35 and African Americans from the USA.35 Besides girls from Bogotá (Colombia), this was also observed in girls from Turkey,30 Germany,31 Greece,32 Spain,34 the USA (Caucasians and African Americans)34 and the United Kingdom,35 except for participants from China28,29 (see Annex).
According to Gonzalez-Jimenez,17 the clear sexual dimorphism, characterized by much higher %BF values among girls across all studied age groups versus boys is partially the result of sexual maturation processes, socioeconomic level, dietary patterns, physical activity levels, neurohormonal factors or ethnic factors typical of each population.17 In relation to the latter, it has been observed that %BF by BIA has demonstrated higher fat mass values in Mexican American adolescents than in nonHispanic Caucasian and African American individuals across all age groups.34 In addition, differences in body fat are accompanied by sexual dimorphism, and this may also account for the weight gain observed in women after menarche, which translates into a mean BMI at 17 years old significantly higher than in the group of boys. Thus, scientific publications in this regard support the findings of this study on the existence of sexual dimorphism according to which women seem to have a greater weight gain than boys during puberty.8,17,24 As per Gonzalez-Jimenez,17 such development pattern may be strictly related to the sexual maturation process typical of the female gender caused by an increased accumulation of fat tissue at the onset of adolescence and the menarche. In addition, during adolescence and in the third decade of life, subcutaneous fat redistributes from the limbs towards the trunk.10 This process takes place both in males and females, but it is faster among men. For this reason, a greater proportion of fat in the trunk compared to the limbs is a masculinizing feature and is associated to the level of sexual hormones.10 This may indicate that the more critical period for diagnosing obesity and overweight is childhood.
Likewise, differences in body fat measured by BIA was assessed in 2329 adolescents (1213 African Americans 1116 Caucasians) aged 9-19 years old and the effect of ethnicity and puberty on body composition was confirmed.15,17 In Brazil, BIA was used to assess, for the first time, the body composition and nutritional status of 83 natives aged 24-117 months old, and major differences with non-native control groups were observed and attributed to race.9 In addition, the pattern of fat development implies a redistribution of fat volume, from a more peripheral and localized model to a more generalized one, especially among women.
As suggested in the study by McCarthy et al.,35 %BF values above P90 may be considered high and, therefore, predictors of cardiovascular risk. In this sample, %BF by BIA corresponding to P90 was in the 23.4-28.3% range among boys and in the 31.0-34.1% range among girls. Without using statistical procedures, it may be observed that, among girls, the median value (P50) shows a harmonious and progressive increase in %BF with increasing age up to 16.9 years old, while P50 shows a progressive reduction up to 14.5 years old among boys. The action of %BF in studied 9-13.9 year old girls and boys was higher than that reported in children from the United Kingdom35 and lower than most studies referenced here,10,15,28-35 which is one more reason why it is necessary to have our own references separated by age and gender. The increase in %BF by age between P50 and P90 was minimal: 8.6% among 9-9.9 year old boys and 6.4% among 1515.9 year old girls.
In addition, at present, there is no general agreement on the cut-off point for %BF considered to increase the risk that an obese child may become an obese adult. While some authors propose different percentiles and averages,28-32 others suggest a 2 or 3 SD of the mean as a cutoff point.15,33-35 Thus, and in order to establish a clinical and epidemiological definition of useful cut-off points for all ages, we arbitrarily suggest the use of P97 -between 29.1% and 35.1%, total value of 32.7% for boys and, between 33.5% and 38.5%, total value of 36.4% for girls- as a marker of obesity due to fat excess in students from Bogotá (Colombia). Values between P75 and P97 may be an approximation to the overweight limit, while values between P75 and P25 (arbitrarily set) may be considered healthy (Figure 1 and Table 2). These cut-off points have also been proposed by authors such as McCarthy et al.,35 for English youth, and Moreno et al.33 in Spain, as indicators of excess fat associated with early manifestations of cardiometabolic risk.
The main limitations of this study are those inherent to its cross-sectional nature and sampling type. It did not include other potentially influential outcome measures that may affect body composition, such as ethnicity, socioeconomic level, nutritional status, physical activity level or fitness.
In this study, bipolar BIA was used as the reference measurement of adiposity. To this date, there are no validation studies conducted on bipolar foot-to-foot floor scale with reference tests, such as DXA, air displacement plethysmography or isotope dilution methods; therefore, the actual prevalence of obesity due to excess fat may be biased in relation to that obtained using other methods. Agreement between the bipolar and the tetrapolar BIA has been previously reported and, in other studies, the bipolar BIA has proven to be a reliable tool to measure body fat in Caucasians and for use in population studies.14 It may also be interesting to corroborate if the cutoff points proposed in this study are adequately sensitive and/or specific to detect subjects with obesity or overweight using other anthropometric measurements, such as WC or BMI. In spite of these limitations, results were observed to be consistent with data reported in other national15-17 and international9,10,28-35 studies.
Among the strengths of the study, we could mention that the population sample was large and adjusted by population expansion factors for both genders, which offers new perspectives in relation to health status and nutrition in students from Bogotá (Colombia); such perspectives should be considered by parties involved in planning, decision-making and implementation of health policies.
CONCLUSIONS
Following the determination of %BF and centile curves by age and gender, it is observed that, in most age groups, values were higher among girls than boys. In this context, centile values will help to make comparisons with other reference populations and estimate the ratio of students with changes in their body composition. In spite of its importance, methodological simplicity and clinical usefulness, the determination of excess fat is not yet part of nutritional and health status assessment protocols for students in Bogotá (Colombia).
Acknowledgments
The authors are particularly grateful to the students of the Master of Physical Activity and Health from Universidad del Rosario (CEMA) and to the young investigators of the GICAEDS Group from Universidad Santo Tomás for their technical support, test training and scientific-technological guidance for field measurements.
Annex
Comparison of values (median) corresponding to the percentage of body fat measured by bioelectrical impedance amongchildren and adolescents from Bogotá (Colombia) and in referenced studies based on age and gender
1. Lob-Corzilius T. Overweight and obesity in childhood - A special challenge for public health. Int J Hyg Environ Health 2007;210(5):585-9. [ Links ]
2. Amigo H. Obesidad en el niño en América Latina: situación, criterios de diagnóstico y desafíos. Cad Saude Publ 2003;19(Suppl 1):S163-70. [ Links ]
3. Instituto Colombiano de Bienestar Familiar. Encuesta Nacional de la Situación Nutricional en Colombia 2010 ENSIN. Resumen ejecutvo. [Acceso: 23 de abril de 2015]. Disponible en: http://www.icbf.gov.co/portal/page/portal/PortalICBF/Bienestar/ENSIN1/ENSIN2010/Resumenfi.pdf.
4. González SA, Sarmiento OL, Cohen DD, Camargo DM, et al. Results from Colombia's 2014 report card on physical activity for children and youth. J Phys Act Health 2014;11(Supp 1):S33-44. [ Links ]
5. Rodriguez-Bautista YP, Correa-Bautista JE, González-Jiménez E, Schmidt RioValle J, et al. Valores del índice cintura/cadera en la población escolar de Bogotá, Colombia: Estudio FUPRECOL. Nutr Hosp 2015;32(5):2054-61. [ Links ]
6. Bejarano-Roncancio JJ, Parra-Pérez D. El TLC con USA: ¿una nueva transición nutricional? ¿Cómo influirá en el peso de los colombianos? Rev Fac Med (Bogotá) 2014;62(Supl 1):S7-8. [ Links ]
7. Hernández Camacho JD, Rodríguez Lazo M, Bolanos Ríos P, Ruiz Prieto I, et al. Hábitos alimentarios, sobrecarga ponderal y autopercepción del peso en el ámbito escolar. Nutr Hosp 2015;32(3):1334-43. [ Links ]
8. World Health Organization. Physical status: the use and interpretation of anthropometry. Technical Report Series 854. Geneva, 1995.Págs.2-3.
9. Talma H, Chinapaw MJ, Bakker B, HiraSing RA, et al. Bioelectrical impedance analysis to estimate body composition in children and adolescents: a systematic review and evidence appraisal of validity, responsiveness, reliability and measurement error. Obes Rev 2013;14(11):895-905. [ Links ]
10. Bohn B, Müller MJ, Simic-Schleicher G, Kiess W, et al. BMI or BIA: is body mass index or body fat mass a better predictor of cardiovascular risk in overweight or obese children and adolescents? A German/Austrian/Swiss Multicenter APV analysis of3,327 children and adolescents. Obes Facts 2015;8(2):156-65. [ Links ]
11. Kasvis P, Cohen TR, Loiselle SE, Kim N, et al. Foot-to-foot bioelectrical impedance accurately tracks direction of adiposity change in overweight and obese 7- to 13-year-old children. Nutr Res 2015;35(3):206-13. [ Links ]
12. Alvero-Cruz JR, Correas-Gómez L, Ronconi M, Fernández-Vázquez R, et al. La bioimpedancia eléctrica como método de estimación de la composición corporal, normas prácticas de utilización. Rev Andal Med Deporte 2011;4(4):167-74. [ Links ]
13. Meredith-Jones KA, Williams SM, Taylor RW. Bioelectrical impedance as a measure of change in body composition in young children. Pediatr Obes 2015;10(4):252-9. [ Links ]
14. Moon JR. Body composition in athletes and sports nutrition: an examination of the bioimpedance analysis technique. Eur J Clin Nutr 2013;67(Suppl 1):S54-9. [ Links ]
15. Kabiri LS, Hernandez DC, Mitchell K. Reliability, validity, and diagnostic value of a pediatric bioelectrical impedance analysis scale. Child Obes 2015;11(5):650-5. [ Links ]
16. Aguilar de Plata AC, Pradilla A, Mosquera M, Gracia de Ramírez AB, et al. Centile values for anthropometric variables in Colombian adolescents. Endocrinol Nutr 2011;58(1):16-23. [ Links ]
17. González Jiménez E, Aguilar Cordero MJ, García García CJ, García López PA, et al. Prevalencia de sobrepeso y obesidad nutricional e hipertensión arterial y su relación con indicadores antropométricos en una población de escolares de Granada y su provincia. Nutr Hosp 2011;26(5):1004-10. [ Links ]
18. Ramírez-Vélez R, Suaréz-Ortegón MF, Aguilar de Plata AC. Asociación entre adiposidad y factores de riesgo cardiovascular en infantes pre-púberes. Endocrinol Nutr 2011;58(9):457-63. [ Links ]
19. Ramírez-Vélez R, Rodrigues-Bezerra D, Correa-Bautista JE, Izquierdo M, et al. Reliability of health-related physical fitness tests among Colombian children and adolescents: the FUPRECOL Study. PLoS One 2015;10(10):e0140875. [ Links ]
20. Prieto-Benavides DH, Correa-Bautista JE, Ramírez-Vélez R. Niveles de actividad física, condición física y tiempo en pantallas en escolares de Bogotá, Colombia: estudio FUPRECOL. Nutr Hosp 2015;32(5):2184-92. [ Links ]
21. Aristizábal JC, Restrepo MT, Estrada A. Evaluación de la composición corporal de adultos sanos por antropometría e impedancia bioeléctrica. Biomédica 2007;27(2):216-24. [ Links ]
22. Ruiz JR, España Romero V, Castro Pinero J, Artero EG, et al. Batería ALPHA-Fitness: test de campo para la evaluación de la condición física relacionada con la salud en niños y adolescentes. Nutr Hosp 2011;26(6):1210-4. [ Links ]
23. Sun SS, Chumlea WC, Heymsfield SB, Lukaski HC, et al. Development of bioelectrical impedance analysis prediction equations for body composition with the use of a multicomponent model for use in epidemiologic surveys. Am J Clin Nutr 2003;77(2):331-40. [ Links ]
24. Tanner JM. Growth at adolescence: with a general consideration of the effects of hereditary and environmental factors upon growth and maturation from birth to maturity. 2nd ed. Oxford: Blackwell Scientific; 1962. [ Links ]
25. Matsudo SM, Matsudo VK. Self-assessment and physician assessment of sexual maturation in Brazilian boys and girls: concordance and reproducibility. Am J Hum Biol 1994;6(4):451-5. [ Links ]
26. Weiner JS, Lourie JA. Practical human biology. Londres: Academic Press; 1981:33-7. [ Links ]
27. Cole TJ, Green PJ. Smoothing reference centile curves: the LMS method and penalized likelihood. Stat Med 1992;11(10):1306-19. [ Links ]
28. Sung RY, So HK, Choi KC, Li AM, et al. Body fat measured by bioelectrical impedance in Hong Kong Chinese children. Hong Kong Med J 2009;15(2):110-7. [ Links ]
29. Sung RY, Lau P, Yu CW, Lam PK, et al. Measurement of body fat using leg to leg bioimpedance. Arch Dis Child 2001;85(3):263-7. [ Links ]
30. Kurtoglu S, Mazicioglu MM, Ozturk A, Hatipoglu N, et al. Body fat reference curves for healthy Turkish children and adolescents. Eur J Pediatr 2010;169(11):1329-35. [ Links ]
31. Plachta-Danielzik S, Gehrke MI, Kehden B, Kromeyer-Hauschild K, et al. Body fat percentiles for German children and adolescents. Obes Facts 2012;5(1):77-90. [ Links ]
32. Papandreou D, Malindretos P, Rousso I. First body fat percentiles for 607 children from Thessaloniki-Northern Greece. Hippokratia 2010;14(3):208-11. [ Links ]
33. Moreno LA, Mesana MI, Gonzalez-Gross M, Gil CM, et al. Body fat distribution reference standards in Spanish adolescents: the AVENA Study. Int J Obes (Lond) 2007;31(12):1798-805. [ Links ]
34. Mueller WH, Harrist RB, Doyle SR, Labarthe DR. Percentiles ofbody compositionfrombioelectrical impedance and body measurements in U.S. adolescents 8-17 years old: Project HeartBeat! Am J Hum Biol 2004;16(2):135-50. [ Links ]
35. McCarthy HD, Cole TJ, Fry T, Jebb SA, et al. Body fat reference curves for children. Int J Obes (Lond) 2006;30(4):598-602. [ Links ]

