


 Español (pdf)
 Articulo en XML
 Referencias del artículo
 Enviar articulo por email
 Citado por SciELO
  Similares en
SciELO
Similares en
SciELO  uBio
uBio 
 Permalink
Traditionally, to estimate sexual dimorphism in skeletal remains physical anthropologists apply metric and non-metric methods (DiGangi & Moore, 2013). While traditional metric methods are based on inter-landmark distances, non-metric methods involve visual and physical assessments by assigning a score on an ordinal scale representing the intensity of the phenotypic expression of the trait (i.e. “hyper feminine”, “feminine”, “undetermined”, “masculine”, “hypermasculine”) (Ubelaker & Buikstra, 1994; Walker, 2008). Despite their popularity due to their relatively easy and quick implementation, as well as to the existence of an alternative to the parametric statistics battery of tests for hypothesis testing (i.e. Mann-Whitney U test instead of the t-test for independent samples, the Kruskal-Wallis test instead of ANOVA, the Spearman’s rank correlation instead of Pearson’s correlation etc.), these methods present two major problems. First, and like the traditional metric methods, the non-metric methods cannot assess either of the shape and size components of dimorphic sexual variation separately (Slice, 2007; Zelditch et al., 2012). Secondly, non-metric methods calculate intra-inter-observer error based on subjective instead of objective criteria (Lewis & Garvin, 2016; Walrath et al., 2004; Williams & Rogers, 2006), summarized by the classical “gracility” and “robusticity” conditions for distinguishing, respectively, female versus male secondary sexual phenotypes, but also sedentary versus hunter-gatherer lifestyles (for an example of the first, see Carlson et al., 2007; for a critique of the second, see Püschel, 2013). Third, because of the ranked nature of their raw data, at equal sample sizes the non-metric methods compared to the metric methods generally show a lower statistical power. Additionally, regarding the use of cranial traits for assessing overall sexual dimorphism, the relative better preservation and larger representation of skull in archaeological and current osteological collections biases sex determination due to its higher variability and selective neutral nature compared, for example, to more reliable structures for assessing sex determination like the pelvic bone (rev. Walrath et al., 2004). In this context, the lower sensibility of non-metric methods compared to metric methods may have a negative effect on the precision of the sexual dimorphism assessment.
In the last decades geometric morphometrics (GM) has proven to be a powerful tool for studying shape and size variation of human populations allowing hypothesis testing on the effect of bioanthropological variables such as sex, age, population, and ancestry, among many other (Adams et al., 2004; Baylac & Frieß, 2006; Rohlf & Marcus, 1993; Weber, 2015). GM uses landmark coordinates as raw data with Procrustes superimposition for removing the effects of rotation, translation and scale (rev. Zelditch et al., 2012). Although early works applying GM for assessing sexual dimorphism in the human skull improved the accuracy of sex estimation, they were not able to register the information contained in the curved surfaces of the cranial morphology (Franklin et al., 2006; Green & Curnoe, 2009; Kimmerle et al., 2008; Pretorius et al., 2006; Rosas & Bastir, 2002), Thus, landmark-based GM methods have limitations in representing organismal morphology due to the use of discrete points for comparisons across individuals. First, the number of these points is limited by the presence of features in the anatomical structure under study which literally must be evident and should be defined unambiguously as landmarks type I, (i.e. discrete juxtapositions of tissues like a suture formed by the joint of two or more bones) or type II (i.e. points of application of biomechanical forces like the imprinting left by a muscular force onto the surface of a bone during development) according to the Bookstein’s (1991) classical definition. Consequently, when studying subtle shape variations (e.g., curve and surface information) or major sources of morphological differences that are not characterized by existing landmarks, the representation of morphology becomes increasingly poor. Second, as it seems obvious, landmark data fail to capture the shape existing between landmarks, resulting in the loss of significant morphological information.
In order to overcome these deficiencies, during the last decade different morphometric solutions have been developed, greatly improving the description and analysis of shape and size differences of skeletal structures like those presenting sexual dimorphism in the human skull (Bigoni et al., 2010; Chovalopoulou et al., 2016; del Bove et al., 2020; Garvin, 2012; Gonzalez et al., 2011; Jung & Woo, 2016; Schlager & Rüdell, 2017), having high accuracy rates for the zygomatic (78-89%) (Schlager & Rüdell, 2017), the mastoid process of the temporal bone (82-84%) (Jung & Woo, 2016) (Jung & Woo, 2016), and the frontal bone (85%) (del Bove et al., 2020).
The solutions implemented in the last decade for improving the registering of highresolution 3D specimens include pseudo-landmark (Boyer et al., 2011, 2015), landmarkfree methods (Pomidor et al., 2016), and sliding surface semilandmarks, being the last specially designed, in combination with true landmarks, for capturing shape along curves and surfaces (Gunz et al., 2005; Gunz & Mitteroecker, 2013). Regarding the 3D surface semilandmarks approach, this procedure involves the manual placement of anatomical landmarks, curve and surface sliding semilandmarks onto individuals, and subsequently the semi-automatic projection of surface points onto a target mesh. In this sense, compared to pseudo-landmark and landmark-free methods, this semi-automated approach allows for proper projection monitoring of surface points onto a target mesh. Thus, the combination of landmarks, curve and surface semilandmarks represents a useful tool for capturing the complex morphology of 3D surfaces, particularly for the study of sexual dimorphism in human skulls (del Bove et al., 2020).
Taking in account the improvements made by using 3D landmark and surface semilandmark techniques for estimating sexual dimorphism in cranial traits, the main purpose of this study is to show the benefits of these techniques for assessing -through a quantitative, statistically contrasted approach- the differential phenotypic expressions of sexual dimorphism in human cranial traits, using the frontal bone, the mastoid process of the temporal bone, and the zygomatic bone as proxies, contributing to overcome the limitations of the nonmetric approaches for assessing cranial sexual dimorphism. According to our hypothesis, the pattern of cranial bone shape variation has a differential phenotypic expression both at the intra- (same sex, different traits), as well as at the intergroup (different sex, same and/or different traits) levels. This hypothesis will be tested using:
i) as material, 3D models of frontal bone, zygomatic bone, and the mastoid process of the temporal bone obtained from a sample of crania belonging to modern remains from Santiago de Chile, ii) as raw data, landmarks and surface semilandmarks 3D coordinates, and iii) as an analytical tool, the standard pipeline of GM methods improved for 3D data by freeware packages for R environments available in R repositories.
MATERIALS AND METHODS
Sample
The sample consisted of 258 bones belonging to the skulls of 43 females (51.9 ± 17.5 years old/min = 22, max = 88/) and 43 males (50.5 ± 16.4 years old/min = 27, max = 85/) (t test for equal age means: t = 0.3747, p (same age mean) = 0.7089) housed at the Colección Osteológica Subactual de Santiago (COSS), a documented skeletal collection of the Department of Anthropology of Universidad de Chile (Barreaux et al., 2015), consisting at the present time of 1,635 individuals buried in short-term graves living in low socioeconomic areas of the capital during the late 19th and early 20th centuries, where biological sex and age-at-death has been documented through burial records for 1,198 individuals (41.1% females vs. 58.9% males) (Meza-Escobar et al., 2023). Our sample is representative of these individuals, both in terms of sex ratio, average age per sex, presenting a relatively homogeneous genetic background due to the socioeconomic assortative mating, characteristic of the low income population of Santiago de Chile in the 70s (Valenzuela & Harb, 1977).
The respective 3D models were obtained using the NextEngine 3D laser scanner, after trimming, aligning and fusing the mesh surfaces representing the respective bone structure with Scanstudio version 2.0.2 software (Shape Tools LCC and NextEngine inc.). Prior to carry out the assessment, each model was cleaned, centred, smoothed and converted to a valid R environment format (R Core Team., 2008). Furthermore, in order to determine the minimum sample size for each trait we followed Rodríguez (2018), applying a MANOVA Global effects (α err prob = 0.05, statistical power = 0.8) using G*Power software (Faul et al., 2007) for assessing the sample size of frontal bone (n = 18, Pillai trace V = 0.4), the mastoid process (n = 18, Pillai trace V = 0.41), and the zygomatic bone (n = 18, Pillai trace V = 0.43).
Data acquisition
19 fixed landmarks after Del Bove et al. (2020), Díaz-Jarufe (2010) and Martin (1914) (Supplemental Table S1) were registered on each individual by a unique observer (Author 1) using Stratovan Chekpoint software (Stratovan Corporation, 2018). In order to obtain a reference template for each trait, the following actions were carried out using a 19 fixed landmark configuration: i) a GPA and the “findMeanSpec” function available in the Geomorph R package (Adams & Otárola-Castillo, 2013) was applied for finding the closest to the average morphology individual, ii) the fixed landmarks and surface semilandmarks were manually placed onto the corresponding average individual by the same observer using Stratovan Chekpoint software, iii) finally, the template’s mesh, fixed landmarks, and surface points were all imported into R environment to create a reference template by trait using “createAtlas” function in Morpho R package (Schlager et al., 2018).
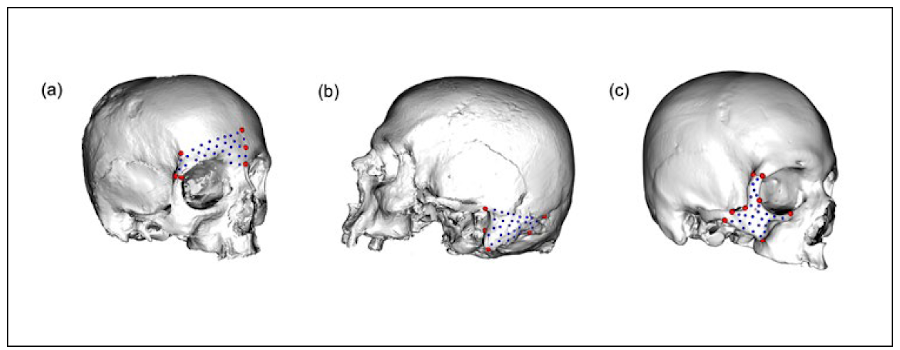
For this study, the lower portion of the frontal bone (i.e., glabella and supra orbital ridge) was used because the glabella and the supra orbital ridge are the most used sexually dimorphic traits within the frontal bone (del Bove et al., 2020; Walker, 2008). Considering this fact, it was recorded by 28 semilandmarks. The mastoid process and zygomatic bone were defined by 29 and 25 semilandmarks, respectively (Fig. 1).
In each individual, the patching procedure, involving the semi-automatically projection of surface points onto each mesh through reference template was applied (Bardua et al., 2019; Schlager, 2017) by the “placePatch” function in the Morpho R package. Subsequently, in order to minimise the bending energy of the thin plate spline deformation, the sliding procedure was applied (Schlager, 2017) using the “slider3d” function available in the Morpho R package. Finally, the average distance between semilandmarks (corresponding to the 10 closest semilandmarks) was calculated on the respective consensus shape (0.08 ± 0.01 mm in the frontal bone; 0.11 ± 0.03 mm in the mastoid process and 0.11 ± 0.03 mm in the zygomatic bone).
Analyses
To eliminate differences due to rotation, scale and translation, a GPA was performed on the combined configuration of landmarks and surface semilandmarks of the three landmark and surface semilandmark configurations considered in the present study.
Then, the aligned coordinates representing each trait were projected as points to a two- dimensional shape space formed by pairs of the PCs having a sexual dimorphic signal (see below). The influence of sex and size on the shape variation of each trait was evaluated after a Procrustes ANOVA available in the geomorph R package using as size estimator for each trait its centroid size, i.e. the square root of the sum of squared distances of a set of landmarks (and semilandmarks if applicable) from their centroid. It is worth mentioning that, in the absence of allometric effects, centroid size is uncorrelated with the set of shape components (PCs).
To assess the reliability of the traits in estimating sex, a linear discriminant analysis with leave-one-out cross-validation (LDA) was carried out. The PC scores (overall shape information) and centroid size were used as dependent variables, considering sex as the independent variable. Afterwards, the accuracy (80% or more correct classifications of each sex) and precision (80% or more of true positives for each sex) of the model was calculated using a bootstrap procedure design (1,000 iterations). In each iteration, 80 individuals were randomly sampled. At the end of this iterative procedure, the mean and confidence interval (alpha = 0.05) of the model's accuracy and precision were calculated.
The pattern of shape variation regarding sex was assessed using PCs, exhibiting sexual dimorphic signal, whose statistical significance was tested after a Student's t-test, following del Bove et al. (2020), and the Procrustes distances between the consensus female and male configurations. The sex differences in centroid size were analysed using Procrustes ANOVA. Finally, for testing allometry, a regression model was applied onto centroid size and significant PCs vectors using PAST software (Hammer et al., 2001).
RESULTS
Assessment of sexual dimorphism
The variables sex and size showed a statistically significant association with the landmark coordinate data of the three traits separately and as a whole, without a significant interaction among these variables (Table 1). Depending on the variable used, accuracy and precision of sex estimation were higher when the shape variable was included in the analysis than when it was not (Table 2), and the successful classification tended to be more accurate in males than in females for both variables (i.e., LDA for shape and size components). Additionally, the phenotypic traits showing the high expression of dimorphic signal were frontal, and zygomatic bones, followed by the mastoid process (Table 2). Regarding accuracy and precision of centroid size, the mastoid process showed the highest values for both estimates.
TABLE 1 Level of association (R2), Z-score, and p-value of the Procrustes ANOVA effects of the independent variables analysed in this study.
| R2 (sex) | Z-score (sex) | p-value (sex) | R2 (size) | Z-score (size) | p-value (size) | R2 | Z-score | p-value | |
|---|---|---|---|---|---|---|---|---|---|
| All | 0.0141 | 18,621 | 0.022 | 0.7749 | 50,594 | 0.001 | 0.0030 | 0,6892 | 0.283 |
| Frontal | 0.0453 | 32,933 | 0.002 | 0.0352 | 27,257 | 0.003 | 0.0242 | 18,423 | 0.038 |
| Mastoid | 0.0802 | 45,850 | 0.001 | 0.0617 | 39,939 | 0.001 | 0.0095 | 0,1370 | 0.443 |
| Zygomatic | 0.0256 | 21,117 | 0.016 | 0.0915 | 49,656 | 0.001 | 0.0096 | 0,0217 | 0.489 |
| Frontal + Mastoid | 0.0155 | 18,398 | 0.029 | 0.7286 | 46,268 | 0.001 | 0.0031 | 0,4743 | 0.326 |
| Frontal + Zygomatic | 0.0145 | 27,441 | 0.001 | 0.9219 | 74,686 | 0.001 | 0.0004 | -0,4273 | 0.654 |
| Mastoid + Zygomatic | 0.0532 | 42,953 | 0.001 | 0.0376 | 33,129 | 0.001 | 0.0146 | 0,9214 | 0.171 |
TABLE 2 Precision and Accuracy (expressed as a ratio) calculated on the traits and their combinations in classifying sex by “shape” and “size” variables.
| Shape | |||
| Accuracy mean (95% CI) | Precision Female mean (95% CI) | Precision Male mean (95% CI) | |
| All | 0.7663 (0.7624-0.7701) | 0.7581 (0.7535-0.7626) | 0.7722 (0.7679-0.7765) |
| Frontal | 0.8747 (0.8719-0.8776) | 0.8564 (0.8530-0.8598) | 0.8957 (0.8925-0.8989) |
| Mastoid | 0.7951 (0.7918-0.7984) | 0.7880 (0.7842-0.7919) | 0.8016 (0.7976-0.8055) |
| Zygomatic | 0.8534 (0.8504-0.8564) | 0.8524 (0.8488-0.8560) | 0.8542 (0.8507-0.8577) |
| Frontal + Mastoid | 0.7867 (0.7830-0.7904) | 0.7807 (0.7765-0.7850) | 0.7915 (0.7872-0.7958) |
| Frontal + Zygomatic | 0.6786 (0.6741-0.6830) | 0.6706 (0.6654-0.6757) | 0.6807 (0.6757-0.6856) |
| Mastoid + Zygomatic | 0.8764 (0.8739-0.8789) | 0.8673 (0.8642-0.8703) | 0.8864 (0.8834-0.8893) |
| Size | |||
| Accuracy mean (95% CI) | Precision Female mean (95% CI) | Precision Male mean (95% CI) | |
| All | 0.5990 (0.5950-0.6029) | 0.5925 (0.5879-0.5970) | 0.5985 (0.5935-0.6035) |
| Frontal | 0.7002 (0.6970-0.7034) | 0.6863 (0.6825-0.6900) | 0.7113 (0.7077-0.7150) |
| Mastoid | 0.7856 (0.7826-0.7886) | 0.7720 (0.7685-0.7756) | 0.7972 (0.7932-0.8011) |
| Zygomatic | 0.7243 (0.7211-0.7275) | 0.7288 (0.7252-0.7323) | 0.7160 (0.7123-0.7197) |
| Frontal + Mastoid | 0.6040 (0.6000-0.6079) | 0.5958 (0.5915-0.6002) | 0.6050 (0.5997-0.6102) |
| Frontal + Zygomatic | 0.5725 (0.5692-0.5758) | 0.5410 (0.5323-0.5497) | 0.5491 (0.5405-0.5577) |
| Mastoid + Zygomatic | 0.7902 (0.7873-0.7931) | 0.7866 (0.7834-0.7899) | 0.7951 (0.7917-0.7985) |
| Mastoid + Zygomatic | 0.7902 (0.7873-0.7931) | 0.7866 (0.7834-0.7899) | 0.7951 (0.7917-0.7985) |
| Mastoid + Zygomatic | 0.7902 (0.7873-0.7931) | 0.7866 (0.7834-0.7899) | 0.7951 (0.7917-0.7985) |
Shape variation
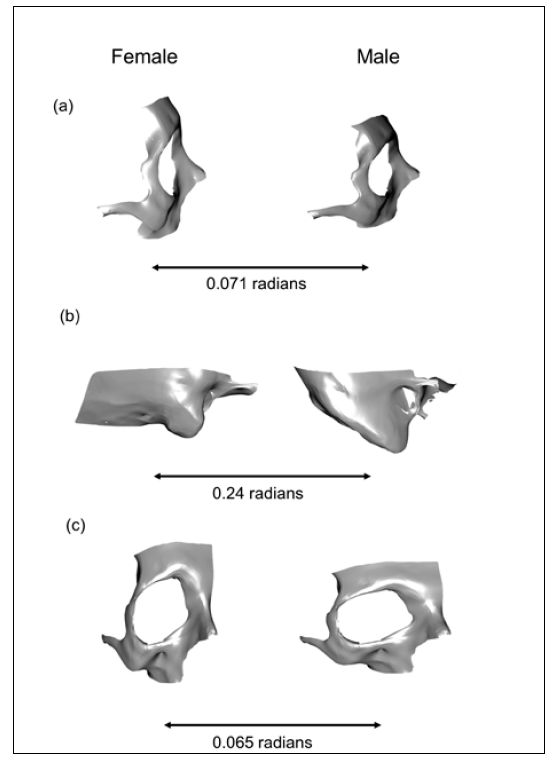
The general pattern of shape variation of the traits under study was associated with the expansion/contraction of the surface of each trait. The pattern of shape variation of the female frontal bone was characterised by a vertically expanded and horizontally contracted frontal bone, while male frontal bone was contracted and expanded, respectively. As a result, females showed a vertically elongated phenotype, while males showed a protruded one (Fig. 2). In this analysis shape components PC2, PC3, PC6 and PC13 were considered (Supplemental Information, Fig. S1), accounting for 15.11%, 14.48%, 4.48% and 1.20% of the explained overall variance respectively. Concerning the mastoid process of the temporal bone, females were characterised by a horizontal expansion and a vertical contraction of the mastoid, resulting in an inward appearance. In contrast, shape variation in males was associated with a horizontal contraction and a vertical expansion, resulting in a vertically sharp appearance (Fig. 2). This structure showed the highest value of Procrustes distances among sexes compared to frontal (middle value) and zygomatic bones (lowest value). In this case, the shape components PC1, PC2 and PC9 were used (Supplemental Information, Fig. S2), accounting for 26.83%, 23.84% and 1.20% of the explained overall variance respectively. Finally, as for the zygomatic bone, it mainly showed shape variation in its body portion. Females were characterised by a vertical expansion and a horizontal contraction resulting in an elongated appearance. In contrast, males were associated with a vertical contraction and a horizontal expansion, resulting in a flattened appearance (Fig. 2). For the analysis of this bone the shape components PC6, PC8 and PC12 were considered (Supplemental Information, Fig. S3), accounting for 4.32%, 2.66% and 1.49% of the overall explained variance.
Size variation and allometry testing
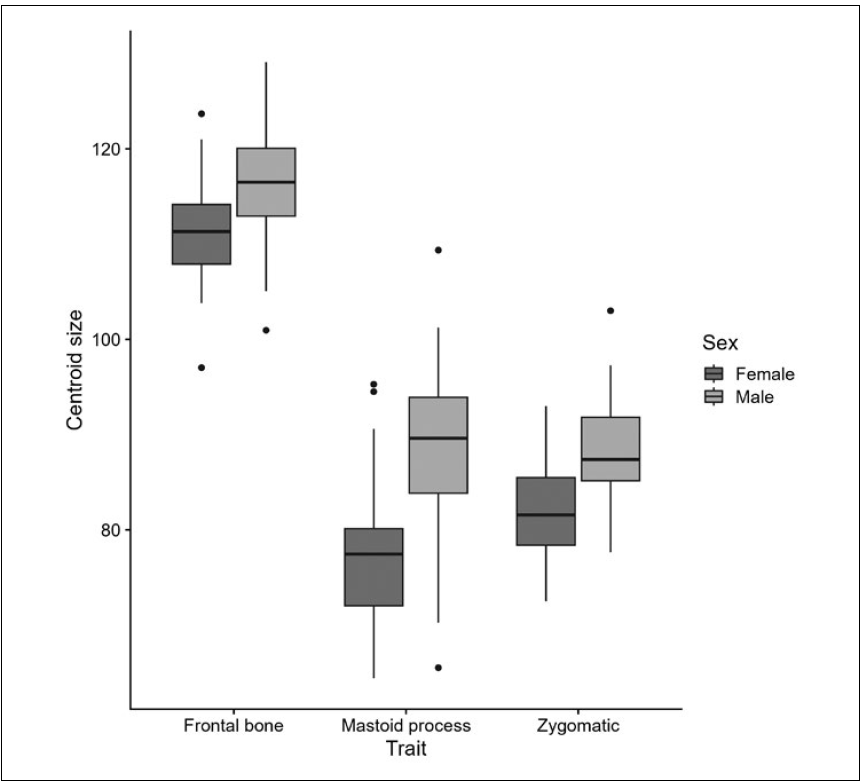
Regarding size variation, significant differences for the studied traits in centroid size between females and males were found, and as expected, females had a lower centroid size value compared to males in the three traits, being the mastoid process the more dimorphic regarding sex (Fig. 3; Table 1).
In order to determine how cranial size affects shape, allometry was tested through the least squares regression of the set of significant PCs of each bone onto the centroid size vector (Csize) of the same bone. As a result, the mastoid process showed a significant allometric effect explained by the PC1/Csize (y = -0.0038x + 0.3109, r = -0.488, p = 1.86E-06) and PC2/Csize (y = 0.0034x - 0.2768, r = 0.437, p = 0.04195) regressions, corresponding to 50.7% of the overall variance (i.e. PC1 + PC2). The frontal bone presented a moderate allometric effect (PC2/Csize: y = -2.78E-05x + 0.0032, r = -0.007, p = 0.9496, and PC3/Csize: y = 0.0019x + -0.2155, r = 0.482, p = 2.65E-06), corresponding to 14.5% of the overall variance, while the zygomatic bone, although presenting a significant allometric effect (PC6/Csize: y = 0.0012x + -0.1048, r = 0.309, p = 00381), corresponded only to 4.3% of the overall variance. These results are in agreement with the pattern observed for shape and centroid size variation when these components of bone form variation were analized separately.
DISCUSSION
In the present study the phenotypic expression of sexual dimorphism in three human cranial traits (i.e. frontal, zygomatic bones, and mastoid process of the temporal bone) was assessed applying a standard geometric morphometrics pipeline using 3D landmarking and surface semilandmarking. Our results show that the three traits present statistically significant signals of sexual dimorphism, for both shape and centroid size. Regarding shape, frontal and zygomatic bones are particularly relevant for detecting sex differences in the human skull. These differences are mainly expressed in a pattern of expansion/contraction of the surface of each trait. It is worth mentioning that both the zygomatic and the mastoid process of the temporal bone had not been previously considered for assessing sexual dimorphism in human skulls applying geometric morphometrics pipeline, neither when using semilandmarks for 3D data (del Bove et al., 2020), nor pre semilandmark techniques, such as pseudo landmarks (Schlager & Rüdell, 2017) and 2D semilandmark approaches (Jung & Woo, 2016).
One of the main problems of traditional quantitative methods for assessing sexual dimorphism in human skulls is the assumption that different traits would have the same relative weight (Walker, 2008). Although this assumption entails high accuracy rates, it does not consider anatomically intrinsic inter trait variation, like the one observed in the present study between frontal and zygomatic bones. When this variation is taken into account, the latter bone achieves similar accuracy rates than the frontal bone.
In relation to the frontal bone, our results corroborate those obtained when using the semilandmark approach for 3D data (del Bove et al., 2020) as well as the interlandmark distances of traditional morphometrics (Perlaza, 2014; Petaros et al., 2017). According to these studies, female supraorbital ridges are slightly expanded in the transverse plane compared to male ridges, while the female glabella is expanded both horizontally and vertically compared to the protruded appearance that it has in males. Moreover, it has been reported that supraorbital ridges in males tend to occupy a larger surface area compared to their relatively flat appearance in females (Garvin & Ruff, 2012; Petaros et al., 2017; Shearer et al., 2012).
Regarding the zygomatic bone, our findings are similar to those of Schlager & Rüdell (2017). After using densely sampled pseudo landmarks, these authors observed that the lower part of the zygomatic bone in males is more expanded in the transverse plane compared to females, which in turn have a more prominent orbital margin. Thus, the signal of the phenotypic expression of sexual dimorphism of the zygomatic bone is high enough to be recorded by techniques which the mentioned authors consider antagonistic (i.e. pseudo- vs. semilandmark approaches) (Schlager & Rüdell, 2017).
In relation to the mastoid process shape variation, its projection in the transverse plane tended to be more reduced in females compared to males, resulting in a verticalsharp appearance in the latter. These results agree with those obtained by Jung & Woo (2016) when using semilandmarks, and by Rosas & Bastir (2002), and Suazo et al., (2008) after applying inter-landmark distances of traditional morphometrics (Rosas & Bastir, 2002; Suazo Galdames et al., 2008). Furthermore, in the present study the mastoid process showed the highest allometric effect compared to the frontal and zygomatic bones, corroborating the results obtained in sub-adult and adult archaeological populations of South America characterized by a notorious robusticity of those same bones (González et al., 2010). Interestingly, these last results taken together suggest that the terms “robusticity” and “gracility” when applied in a bioanthropological context could be associated with shape changes that have a strong size signal.
Regarding the frontal and zygomatic bones, shape variation was more influential than size variation in sex classification, corroborating that the size variable should be treated with caution in sexing osteological collections when using at least, the above mentioned traits. Additionally, our findings indicate that a single or two traits in combination would be more successful in sex classification than the three traits taken as a whole. This is explained by the fact that, due to the variable condition of every osteological trait as well as to the hierarchical and decreasing nature of the variance explained by the set of shape components (PC1 > PC2 > ... PCn), when analysing three (or more) of these traits, it is highly probable to have a pair of them presenting a stronger dimorphic signal when compared with the third (the rest) of traits.
In order to have a more complete picture of the differential expression of sexual dimorphism in the human skull, further studies based on the GMM approach using semilandmarks should include characters such as the nuchal crest and the mental eminence, among others.
In summary, the landmark surface semilandmark based geometric morphometric approach allows to capture the relevant information carried by each trait separately, making it possible to investigate in detail the contribution of variation in both shape and size to the expression of sexual dimorphism.
Regarding the limitations of our study, although we used del Bove's (2020) work as a reference to determine the number of surface points required to capture frontal bone morphology, at present there are no studies that provide guidance on the optimal number of surface points required for capturing the morphology of mastoid process and zygomatic bone. While it is currently not possible to determine a priori how many surface points are necessary to fully capture the shape variation, we chose a number of points that allowed us to capture the complexity and size of each trait, without over-representing any particular region. In this sense, over-representing a region could result in some surface points falling outside the area of interest, and could also increase the dimensionality of the dataset, potentially reducing the power of subsequent analyses as pointed out in previous studies (Bardua et al., 2019; Watanabe, 2018). Therefore, we suggest that our study should be consider as a starting point for further studies.
CONCLUSION
The introduction in the present study of a landmark surface semilandmark based approach for quantitatively assessing sexual dimorphism in human skulls corroborates the importance of the information carried by the surface of the frontal bone, mastoid process and zygomatic bone, considerably improving this way the capture of sexual dimorphic signatures, suggesting that shape and size components should be considered as relevant factors for making a differential, bone dependent sex assessment in human crania. Additionally, our findings indicate that a single or two traits in combination would be more successful in sex classification than the three traits taken as a whole.

