


 Español (pdf)
 Articulo en XML
 Referencias del artículo
 Enviar articulo por email
 Citado por SciELO
  Similares en
SciELO
Similares en
SciELO 
 Permalink
Introduction
Livestock is one of the major activities of the Argentine northeast, and depends mainly on forage. Argentine subtropics have edaphic and climatic limitations that determine the adaptation of forage species. The coastal zone of Formosa and Chaco and the so-called Paraguayan “Bajo Chaco” are located in the eastern sector of the Gran Chaco Americano. This area is characterized by a sequence of rivers and streams that cross the region from northwest to southeast, which are bordered by high areas called levees, and alternate with half hills and estuaries or ravines. The soils have a clay-silty texture, with the exception of the aforementioned levees, which have a lighter texture and are suitable for agriculture; the annual rainfall regime oscillates between 1000 and 1350 mm, with predominance in spring, summer and autumn, and a drier period in winter with marked fluctuations between years. This determines that forage production is concentrated in the summer period, with very little winter growth, with a shortage of forage for 90 to 150 days, depending on the year (Pueyo and Chaparro 2006).
High temperatures and concentrated rainfall in summer, low temperatures and less rainfall in winter, are the main conditions of subtropical areas. These condition lead to look for grass species adapted and with high productivity. Forage is the base of feeding, this is mainly constituted by native and introduced grass, showing high potential of production under right use.
In the last two decades the use of Brachiaria mútica Siam ecotype has increased considerably and there are no works that evaluate the growth and composition of leaves and stems.
It is perennial, has long creeping stems and wide pubescent leaves. It growths well on poorly drained areas with high rainfall conditions. It has agamic reproduction. Resist waterlogging and remain dormant during drought (Ezenwa et al. 1996).
Fertilization is one of the practices that allow more efficient utilization of a pasture (Cameron and Ross 1996). It is well known that fertilization increase forage productivity, and nitrogen (N) is one of the most limiting nutrients for growing pasture (Berlier and Guiraud 1966). The response curve of tropical grass fertilized with N is affected by several factors, such as the fertilization rate, species, weather, cuts, and fertilization interval time. But generally, the ratio between N and dry matter (DM) yield has a sigmoid curve (Hunt 1973).
Due to the paucity of regional data on Siam grass is important to investigate this grass and its response to different levels of fertilization, looking for increase forage supply and stocking rate in the NEA region. The aim of this research was to assess the nutritive value and the leaf/stem ratio of Siam grass with different levels of N fertilization.
Materials and Methods
The trial was carried out in the Instituto Nacional de Tecnología Agropecuaria, Estación Experimental El Colorado, Formosa (26º19’37’’S 59º20’45’’W) over a six- year-old established Siam grass parcels.
He soils belongs to the Colonia 210 Series, with usability V h (excess humidity with periodic flooding). Colonia 210 Series: Typical Natraqualf, very fine clayey, montmorillonitic, hyperthermic (Schulz et al. 2017).
They are characteristic soils of depressed areas, located in closed or open ground positions, within the concave relief. They present zero to very slow drainage, very slow permeability, and poor drainage. They have fine textures on the surface to medium depth (clayey to silty). They have good organic matter content on the surface and poor content in depth. Limitations: waterlogging and sodium (Schulz et al. 2017).
Annual rainfall averages 1170.2 mm and the average annual temperature is 22ºC, with the highest risk minimums recorded in June, July and August; the predominant winds are from the northwest to southeast sector.
During the evaluation period, temperatures and precipitation were presented as indicated in Figures 1 and 2. In the months of October and November, precipitation exceeded the historical average, and in the months of December, March, April, May and June they were below. Regarding temperatures, in the month of September the minimum was 4.8ºC and an agrometeorological frost occurred (-0.4ºC) on 09/25.
Figure 2 Average and minimum temperatures of the experimental period and historical average temperature.
A complete randomized design was used with three replications. Within each plot there were four levels of N fertilization. The surface allocated for each repetition was 8 m2 (2 m x 4 m). A 2 m2 sample was manually cut per treatment, at 12 cm from the ground, leaving 0.5 m and 1 m margin on each side. After sampling, the entire surface was cut.
Was assessed the productivity of Siam grass with a cut frequency of 42 d with four levels of N fertilization: 0, 75, 150 and 225 kg N ha-1. Urea fertilization was done in two applications, the first one in spring before trial begins and the second one before the January cut.
In Sep-06 a leveling cut was done (day 0). Oct-18, Nov-28, Jan-10, Feb-21, Apr-3 and May-15 were cuts dates. In the laboratory the samples were weighed and a subsample was taken, which were separated into their components, leaves and stems. Each one was weighed and dehydrated in an air-forced stove at 60ºC for 72 h. After that, the samples were weighed to determine the DM content.
The samples were ground in a Willey mill until the particles got 1mm size. Dried forage was analyzed for nutrient content. The analysis included the determination of total N concentration by micro Kjeldhal technique, and crude protein (CP) was calculated by multiplying the resulting total N by 6.25 (Bateman 1970). Neutral detergent fiber (NDF) and Acid detergent fiber (ADF) were quantified through the procedures of Van Soest et al. (1991). An estimation of the digestibility (Dig.) was done using the formula: 88.9 - (0.779*ADF) and Metabolizable energy (ME) calculated was obtained from the formula: ME = Dig.*4,4*0,82, developed by the “American Forage and Grassland Council” of the United States to estimate the relative value of forages (Moore and Undersander 2002). The analysis was done for each date separately. The data were statistically analyzed with Infostat software. Analysis of variance was done to determine if means differ, using Tukey test (p<0.05).
Results and Discussion
Table 1 shows DM yield (kg DM ha-1) of forage fertilized with four N doses, there were found differences (p<0.05) between treatments. Increasing DM yield was obtained, in almost all the cuts, with increasing N doses. A decrease in DM production was observed in the January cut, due to a drought recorded in that month (Figure 1 and 2), which influenced the amount of forage produced. After an increase in DM production in the late summer, the decrease was as expected due to the drop in temperature values in the month of May, reflecting the approach of winter.
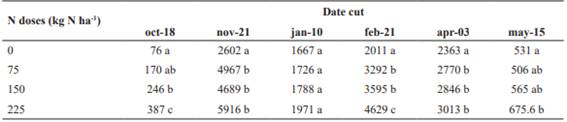
Table 1. Means dry matter yield (kg DM ha-1) of the six cuts with increasing level of N fertilization, in Siam grass. Means within a column without a common letter differ (p<0.05).
It is observed that the differences due to N fertilization occur to a greater extent between the control (0 kg of N) and the application of the fertilizer. Few differences are observed between N doses, except for the dose of 225 kg N ha-1 in some cuts. In the January cut it is evident that the lack of humidity has a greater impact than fertilization (Table 1).
Data obtained are slightly high, comparing with Guevara et al. (2010) have found in Venezuela, who registered yields of 986, 1367 and 2034 kg DM ha-1, using urea as N source in doses of 0, 37.5 and 75 kg N ha-1. The difference can be explained because this trial was done during the higher forage production period (spring- summer-autumn).
Increasing levels of N fertilization did not change (p<0.05) the distribution of the DM in the whole plant (leaves and stems), except for the first cut (Table 2), similar to that obtained by López-García et al. (2017) who showed that the leaf/stem ratio of Brachiaria brizantha under different fertilization alternatives did not present differences (p<0.05). It was observed that leaves/stems ratio changed through the different cuts. This was due to the fact that the plants were in different phenology states. As the plant mature, more DM is allocated in the stems to support the plant structure.
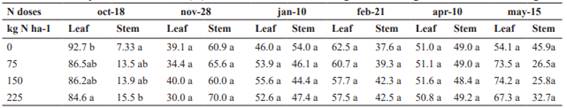
Table 2. Means dry matter distribution (%) of the six cuts with increasing level of nitrogen fertilization, in Siam grass. Means within a column without a common letter differ (p<0.05)
The concentration of crude protein observed in the samples of the whole plant of Siam grass, presented a range of 16.8% on Oct-18 to 8% on Nov-28, with an average of 10.8% for all cuts.
The CP content of leaf and stem did not show a pattern of response to fertilization. In the cut of 11/28 the results have no logical explanation (Table 3). It varied with increasing level of fertilization and with different cutting dates. This may have been due to “dilution effect”, where the total amount of CP tended to increase, but other components of the plant also increased, coinciding with Da Silva Lima et al. (2007). Different results from those observed by Méndez et al. (2019) in Cynodon plectostachyus, which show that DM production and CP concentration increased with the application of nitrogen, this effect remaining until the beginning of winter.
The CP percentage of the leaf was higher than that of the stem, in almost all cases (Table 3). It was expectable because mostly of the N absorbed by plant goes to chloroplasts, more abundant in leaves.
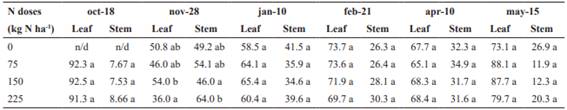
Table 3. Means crude protein distribution (%) of the six cuts with increasing level of nitrogen fertilization, in Siam grass. Means within a column without a common letter differ (p<0.05). n/d no data. Analysis could not be performed.
The range of NDF found in leaves was 50.1% on Oct- 18 and 62.5% on Feb-21; in stems the range was 51.6% on Oct-18 and 65.8% on Feb-21 (Table 4). The percentage of fiber in a grass is little affected by N fertilization (Reid 2009), this was clearly demonstrated in this trial, because there were no significant differences in almost all cases. The results obtained show that the distribution of NDF in the plant behaved in the same way as the H/T ratio, with NDF values of the leaves slightly higher than the ADF, the opposite occurring in the stems.
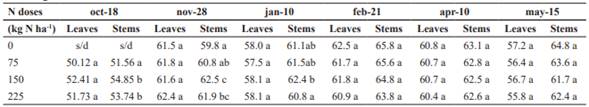
Table 4. Means neutral detergent fiber (%) in leaves and stems of the six cuts with increasing level of nitrogen fertilization, in Siam grass. Means within a column without a common letter differ (p<0.05). n/d no data. Analysis could not be performed.
It is important to determinate the percentage of ADF because it affect grass digestibility. The range of ADF found in leaves was 23.3% on Oct-18 and 32.1% on Nov- 28; in stems the range was 25.3% on Oct-18 and 38.3% on Feb-21 (Table 5). At all N doses, stems-ADF was higher than leaves-ADF, this is expectable because fiber gives resistant to plant structure. The distribution of ADF in the plant is not affected by the increase in N fertilization. Fiber content of a grass is little affected by N fertilization, also its components like cellulose and lignin. Reid (2009) found little decrease in cellulose and lignin content of Dactylis glomeratta with increasing levels of N fertilization.
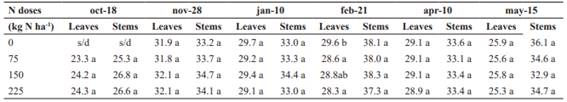
Table 5. Means acid detergent fiber (%) in leaves and stems of the six cuts with increasing level of nitrogen fertilization, in Siam grass. Means within a column without a common letter differ (p<0.05). n/d no data. Analysis could not be performed.
The result showed that DIG y ME of this grass decreased with increasing ADF values (Table 6 and 7). As mentioned above, the highest ADF values occurred in the stems. Digestibility was not affected by N fertilization, results similar to those found by Méndez et al. (2019), who concluded that the concentration of NDF was not affected by N fertilization, although it is observed less NDF in the first cut, for all treatments.
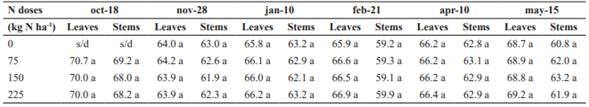
Table 6. Means digestibility (%) in leaves and stems of the six cuts with increasing level of nitrogen fertilization, in Siam grass. Means within a column without a common letter differ (p<0.05).
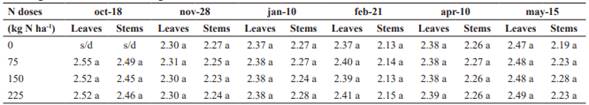
Table 7. Metabolizable energy average - ME - (Mcal Kg-1 DM) in leaves and stems of the six cuts with increasing level of nitrogen fertilization, in Siam grass. Means within a column without a common letter differ (p<0.05).
In both cases, digestibility and metabolizable energy, data were estimated trough formula. If more exactly data is needed, it is recommended in situ analysis. These results did not coincide with those observed by Méndez et al. (2019), who concluded that the combination of higher concentration of CP and lower NDF, implies an improvement in the nutritional quality of the pasture.

