


 Inglés (pdf)
 Articulo en XML
 Referencias del artículo
 Enviar articulo por email
 Citado por SciELO
  Similares en
SciELO
Similares en
SciELO 
 Permalink
INTRODUCTION
It is possible to transform cultivated soils into atmospheric carbon sinks as a mechanism to mitigate global warming (Paustian et al., 2016; Lal, 2017). With adequate management practices, around 20-35% of human carbon emissions could be sequestered in these soils (Minasny et al., 2017). Fertilization is among the management practices that allow increasing soil organic carbon (SOC) stock. Several global meta-analyses have shown that the application of nutrients to the soil promotes an increase in SOC stocks compared to unfertilized controls (Geisseler & Scow, 2014; Han et al., 2016; Ladha et al., 2011). The increase of the SOC stocks is produced by higher residue carbon input (Lu et al., 2011; Tian et al., 2015) and a decrease in microbial respiration (Ramirez et al., 2012; Xu et al., 2020) which leads to a longer residence time of the SOC (Lu et al., 2011). The increase of SOC content is produced only in agroecosystems with residue returned (Alvarez, 2005). A regional survey in China’s croplands showed that SOC stock increased between 1980 and 2011 (Tao et al., 2019), in line with existing meta-analyses. Such increase of the SOC stock was partially attributed to a greater productivity of fertilized crops.
Unfortunately, not every increase in SOC stock implies that the greenhouse effect is mitigated. Life cycle studies show that the increases in SOC content due to improved management practices may not compensate for the effect of additional emission of greenhouse gases associated to the implementation of such practices (Schlesinger & Amundson, 2018). It is important that soils do not act as a source of CO2 and become carbon sinks (Sykes et al, 2020), not only because the carbon cycle will be impacted but also soil productivity (Soussana et al., 2019) and quality (Fazeria, 2012; Feller et al., 2012) will be improved. Consequently, to determine the effect of fertilization on global warming, its impact on SOC stock must be determined along with the associated greenhouse gas emissions.
The Pampas Region in Argentina is an area of great importance due to its capacity to produce grain crops (Dominguez & Rubio, 2019). Fertilization is a massively adopted practice but its effects on SOC stocks and greenhouse gas emissions are unknown. The objectives of this study are to evaluate the impact of fertilization on SOC levels in Pampean soils and to contrast the carbon sequestered in soils with the additional greenhouse emissions due to the implementation of such practice. This study seeks to assess whether the application of fertilizers can be considered a way to mitigate the greenhouse effect or a management practice that enhances global warming.
MATERIALS AND METHODS
Study area
The Pampas is a plain area of ca. 50 Mha, located between 28ºS-40ºS and 57ºW-66 ºW in Argentina (Fi-gure 1). Natural vegetation consists of grassland and around 33 Mha are under cultivation (INDEC, 2022). The mean annual temperature varies from 14ºC to 23ºC from South to North and mean annual rainfall increases from 500 mm to 1200 mm from West to East. Mollisols are the predominant soils with both texture and SOC content following the rainfall gradient: coarse soils with low SOC content in the West to fine soils with high SOC content in the East (Berhongaray et al., 2013). Well-drained soils are cultivated with grain crops while hydromorphic areas have remanent grasslands used for grazing. Main crops are soybean (Glycine max L.) Merr.), wheat (Triticum aestivum L.), corn (Zea mays L.) and sunflower (Helian-thus annuus L.) (MINAGRI, 2022). Alfalfa (Medicago sativa L.) based pastures are rotated with grain crops in some areas. Approximately 90% of the cultivated surface is managed with no-tillage (Noceli Pac, 2018) and crop residues are left in the field.
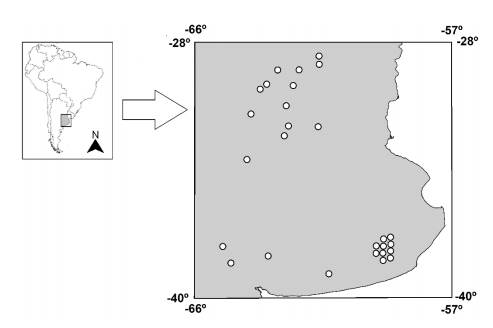
Figure 1: Map of the Pampas Region showing the location of experimental sites. Some points have been slightly shifted from their actual location to avoid overlapping.Figura 1: Mapa de la Región Pampeana mostrando la ubicación de los sitios experimentales. Algunos puntos han sido levemente corridos de su ubicación real para evitar superposiciones.
Data search and processing
A bibliographic search was carried out between June 5 and June 10 of 2022 to identify articles where the impact of fertilizer application on SOC was evaluated in the Pampas region. The search period was set from 1980 to June 2022. Both the Google Scholar and Scopus databases were used to locate articles published in international scientific journals. The search terms were “Argentina” AND “fertilization” or “Argentina” AND “soil carbon”. In addition, an online local journal on soil science (Ciencia del Suelo) was fully reviewed. Proceedings of the Argentina’s National Soil Science Congress in which full length papers were published were reviewed (11 proceedings since year 2000) as well. An online search of technical bulletins of INTA, a governmental institution dedicated to technological improvement in the agricultural sector, was also performed. As a result of this search, 40 articles were identified in which SOC levels were investigated under different fertilization regimes. The published data corresponded to 27 field experiments distributed in the Pampas under a very wide range of soil and climate conditions (Table 1, Figure 1). To be included in this study an experiment had to meet the following conditions: 1) it should be a field experiment, 2) it should include a non-fertilized control compared with one or more fertilized treatments, 3) the SOC stock or con-centration should be reported for all treatments, 4) the sampling depth should be specified, 5) the nutrient combinations of fertilizers should be defined, 6) the duration of the experiments should be indicated and 7) the experimental design should be clear and the number of replications mentioned.

Table 1: Main characteristics of the experiments used in the meta-analysis. Tabla 1: Principales características de los experimentos incluidos en el meta-análisis.
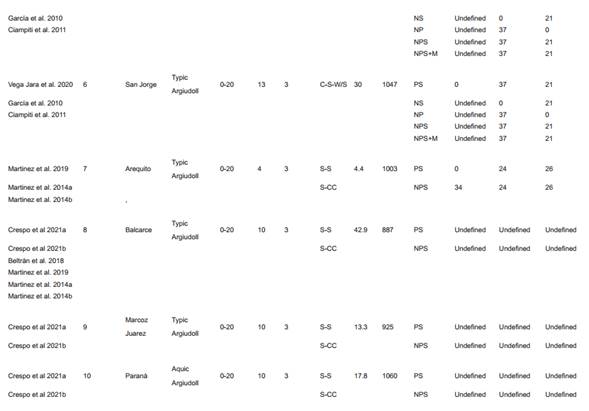
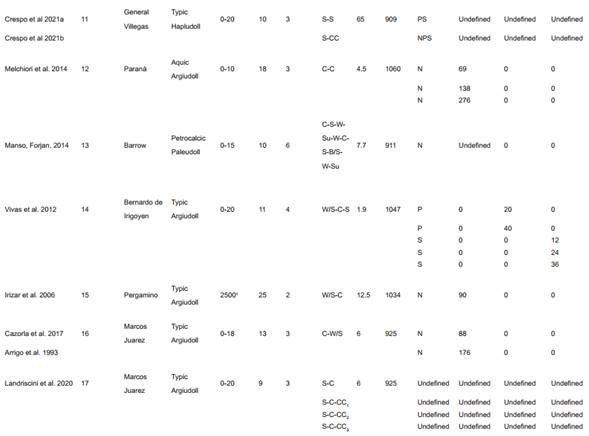
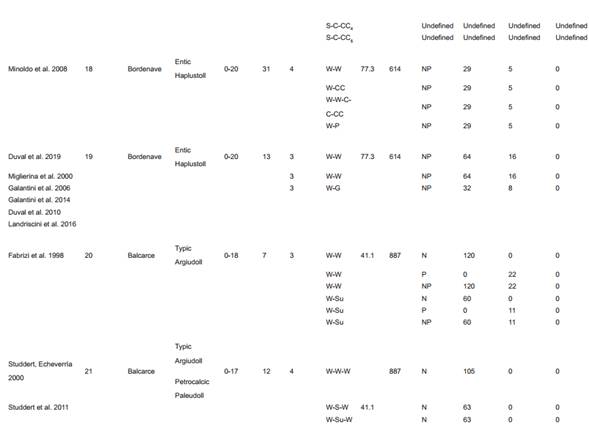


C= corn, W= wheat, S= soybean, W/S= double crop in a year wheat and soybean, Su= sunflower, CC= cover crop, B= barley, B/S= double crop barley and soybean, P= pasture. G= grassland. N= nitrogen, P= phosphorus, S= sulfur, M= micronutrients, L= lime
1= soil equivalent mass (t ha-1)
Information regarding soil type and texture and total rainfall at the experimental sites was reported in the articles or was taken from soil maps (GeoINTA, 2022) and from the Climate Research Unit (CRU) database (CRU, 2022). To avoid double counting of data when several published articles involved the same experiment, only data from the longest period were used. Data were mostly taken from tables but data acquisition software was used to access graphical information (Getdata Graph Digitizer 2.24) when necessary. Since the study focused on the effects of fertilization on SOC sequestration, SOC stocks rather than concentrations were compared under fertilized and unfertilized conditions. If papers reported SOC stock (t ha-1), such data were directly used for analysis. If carbon concentration and soil bulk density were available, SOC stock was calculated. When only SOC concentration was reported, bulk density was estimated as described by Post and Kwon (2000) from SOC concentration and using 1.64 g cm-3 as bulk density of the mineral soil fraction. A factor of 1.72 was used for converting organic matter into carbon (Nelson & Sommers, 1996) in some cases.
Average SOC stock for each treatment was extracted and 109 fertilized vs. unfertilized pairs of SOC stocks were calculated for comparisons (Tables 2, 3). Sampling depth was 0-20 cm in about 80% of the experiments. In the remaining trials, soil was sampled at a lower depth, but those data were still included in the meta-analysis. All data were considered to come from topsoil. The initial SOC level of the soil was also registered when available. In all cases, the number of replications was available but standard deviations could be extracted in only 25% of the cases. In these latter cases, the average standard deviation/mean ratio was 0.068. An imputation procedure was used to estimate standard deviation of the whole dataset assuming that standard deviations were equal to 6.8% of the means (Wiebe et al., 2006). In some experiments, the use of the same unfertilized control treatment against which several fertilized treatments were compared to generates non-independent data in a meta-analysis, thus increasing the probability of Type I Error (Lajeunesse, 2011). In experiments from which various data pairs were extracted, SOC stocks of the fertilized treatments were averaged to achieve independent data (Noble et al. 2017, Song et al. 2020). The number of replicates of the fertilization treatments that were averaged was the sum of the replicates of the individual treatments. In such scenario, 69 independent data pairs were used for analysis. Although in some experiments, nutrients rates were not accurately defined, 71 experiments included nitrogen, phosphorus and sulfur rates, so cumulative rates applied to the soil could be calculated. When graminaceous crops were included, the ratio between the number of wheat, corn or gramineous cover crops over the total number of crops included in the rotation was calculated.
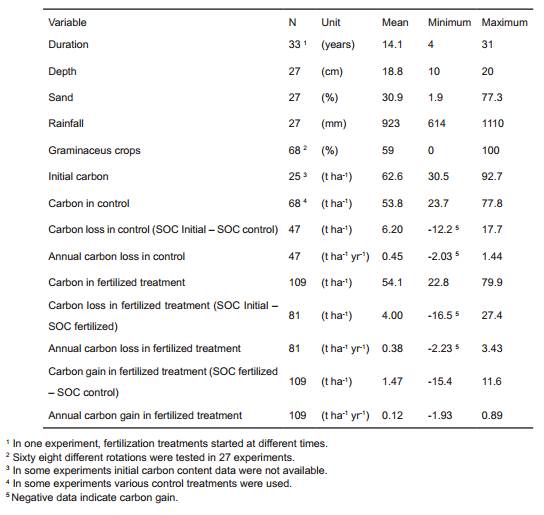
Table 2: Main data extracted from 27 experiments with 109 fertilization treatments in the Pampas regions. Unweighted averages and ranges are shown. Tabla 2: Principales datos extractados de 27 experimentos con 109 tratamientos de fertilización. Se muestran promedios no ponderados y rangos.
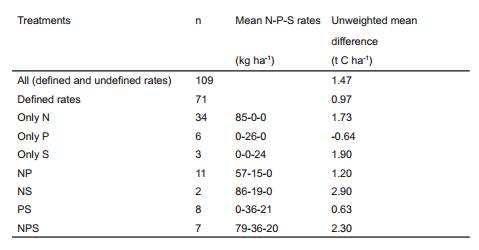
Table 3: Summary of fertilization treatments tested in 27 field experiments and the corresponding unweighted mean difference (SOC fertilized - SOC control). Tabla 3: Resumen de los tratamientos de fertilización testeados en 27 experimentos y sus correspondientes diferencias medias no ponderadas (COS fertilizado - COS control).
Meta-analysis
Meta-analytic methods were used to analyze the data. A detailed description of models and equations used can be found elsewhere (Alvarez, 2021). Two different weighting functions were applied: the inverse of the pooled variance (Rosenberg et al. 2000) and the sample size (Adams et al., 1997). The response ratio (RR) was chosen as effect size (ratio of SOC in fertilized treatment/SOC unfertilized control) which was log-trans-formed to approach the normal distribution before statistical analysis (Hedges et al., 1999). A bias-correc-ted for skewness 95% confidence interval was estimated by bootstrapping methods (Adams et al., 1997). Results were presented as percent change ((RR-1)*100). When the confidence interval did not overlap with 0 (zero), significant effects (P<0.05) of the fertilizer treatment on SOC stock in relation to the control were recognized (Rosenberg et al., 2000). Average RR and confidence intervals were calculated using a random effect model (Rosenberg et al. 2000) assuming that effect sizes were not fixed across all studies (Gurevitch & Hedges, 1999). The software used was MetaWin 2.0 (Rosenberg et al., 2000). For comparative purposes, the mean difference (SOC fertilized - SOC control) was also calculated. Pearson’s correlation analysis was used to study the effects of environmental variables on RR. No heterogeneity analysis to differentiate the effects of individual nutrients or rates on SOC could be conducted, since sample size in each category was insufficient (Kallenbach & Grandy 2011).
Carbon footprint of fertilizers
Carbon footprint due to the manufacture, transport and use of fertilizers has not been determined in Argentina. For this reason, literature values were used. Carbon footprint depends on the energy efficiency of the production process, the energy source used and the distance that the fertilizer is transported (Zhang et al., 2013). Average values were calculated as estimates for the Pampas, considering existing differences among regions (Table 4). When the difference between increments in SOC stock due to fertilization and the cumulative carbon footprint of fertilizers was negative, it was considered as a net flow of greenhouse gases to the atmosphere.

Table 4: Carbon footprint coefficients of fertilizer nutrients. In the cited literature carbon footprint is expressed as CO2 emission and its carbon equivalence (Ceq.) was calculated. Tabla 4: Huella de carbono de los fertilizantes. Se calculó la equivalencia en carbono (Ceq.) de la huella de carbono presentada en la literatura como CO2.
RESULTS
Soil organic carbon measurements were performed in the topsoil, usually for the 0-20 cm in most experiments (Table 1). The average duration of the experiments was 14.1 years. In such period, most soils from unfertilized control and fertilized treatments lost SOC stock (Figure 2). Nonetheless, in three experiments where SOC initial values were low, SOC stocks increased, both in unfertilized and fertilized treatments. The mean loss of SOC stock was 6.2 t ha-1 and 4.0 t ha-1 for unfertilized control and fertilized treatments, respectively (Table 2). The average annual loss of SOC stock across the experiments varied between 0.45 and 0.38 t ha-1 yr-1 depending on whether it was the control or fertilized treatment.
Initial carbon (t ha-1)
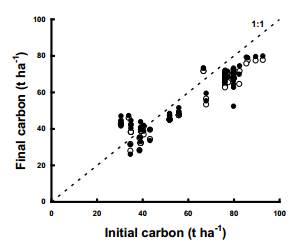
Figure 2: Relationship between initial and final SOC stocks of field experiments. Empty drops = unfertilized controls, full drops = fertilized treatments. Values below the 1:1 line indicate carbon loss. Values above the 1:1 line indicate carbon gain. Figura 2: Relación entre el stock de COS al inicio y al final de los experimentos. Puntos vacíos= controles no fertilizados, puntos llenos= tratamientos fertilizados. Valores menores que la línea 1:1 indican pérdida de carbono y valores mayores indican ganancia de carbono. Most nutrient combinations produced increases in SOC stock compared to unfertilized control treatments
(Table 3). The meta-analysis indicated a significant SOC stock increase resulting from fertilization (Figure 3). An increase of about 3% of the SOC stock in the topsoil was reached, considering either the entire data-set or the independent dataset. A similar result was attained when weighting by variability or sample size. It was not possible to isolate controlling factors of the increase in SOC stock due to fertilization. The RR did not correlate with any of the following variables: duration of the experiment, soil texture, initial SOC content, rainfall at the experimental site, crop rotation or cumulative nitrogen rate (Figure 4).
Percent change (%)

Figure 3: Percent change of soil organic carbon stock in fertilized treatments as compared with unfertilized controls from the meta-analysis. v = weighted by variability; r = weighted by sample size. Analyses are shown for the entire dataset (All) and for the independent dataset (Independent). Figura 3: Resultados del meta-análisis. Porcentaje de cambio del stock de COS en los tratamientos fertilizados relativos al control. v = ponderado por variabilidad; r = ponderado por tamaño de muestra. Se presentan dos análisis, uno para el set completo de datos (All) y otro solo para los datos independientes (Independent).
Cumulative N rate (kg ha-1)
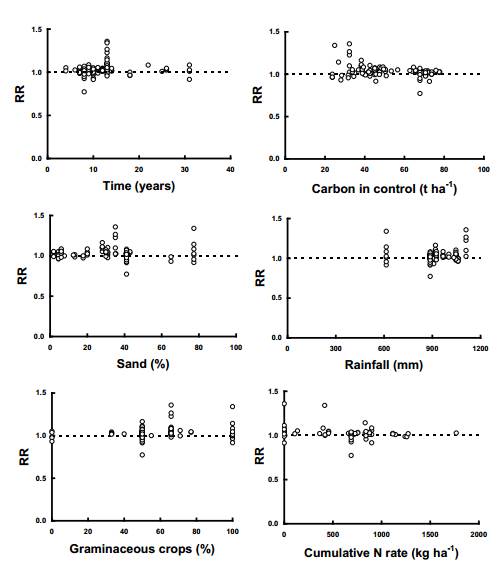
Figure 4: Correlation analysis between response ratio (RR) and management and environmental variables for 27 field experiments. No significant functions could be fitted. Figura 4: Análisis de correlación entre la relación de respuesta (RR) y algunas variables ambientales y de manejo en 27 experimentos. No se pudo ajustar ninguna función significativa.
For 37% of the extracted fertilization treatments, the rates of the applied nutrients were not adequately defined. In some of these experiments the methods chosen to define the fertilizer rates were based on nutrient balances which usually leads to the application of high rates of nutrients, although they were not reported. The average rate of nitrogen was 3 to 4 times higher than the rates of phosphorus and sulfur (Table 5). The overall carbon footprint was much larger for nitrogen than for the other nutrients, due to both higher applied rates and larger greenhouse gas emissions of this nutrient (Table 5). Considering only those studies (71) in which the rates of all the applied nutrients could be calculated, the mean cumulative carbon footprint due to nitrogen, phosphorus and sulfur application was 2.31 t Ceq ha-1, nitrogen being responsible for approximately 98% of the emissions during the whole period of the experiments (Table 5).

Table 5: Cumulative carbon footprint of fertilization experiments in the Pampas. Tabla 5: Huella de carbono acumulada en los experimentos pampeanos.
For the 71 treatments with defined nutrient rates it was possible to compare the cumulative SOC stock increase with the cumulative carbon footprint of fertilization. The fertilizer carbon footprint more than doubled SOC removal by fertilization (Figure 5). As a consequence, there was a net flux of greenhouse gases into the atmosphere by fertilization treatments.

Figure 5: Greenhouse gas fluxes related to fertilizer application to and from the atmosphere (calculated as carbon equivalent (Ceq.) units). Negative fluxes indicate SOC increases in fertilized treatments related to control. Positive fluxes are emission of Ceq. to the atmosphere due to fertilizer use. Balance is the difference between both previous fluxes. Figura 5: Flujos de gases de efecto invernadero desde y hacia la atmósfera producidos por la fertilización (calculados como equivalentes de carbono, Ceq.). Los flujos negativos indican incrementos del COS en los tratamientos fertilizados en relación al control. Flujos positivos representan emisiones de Ceq. hacia la atmósfera debido al uso de fertilizantes. El balance es la diferencia entre ambos flujos.
DISCUSSION
Based on published results from literature, this meta-analysis allowed determining that fertilization increases SOC stocks of the Pampas soils. Most global studies found considerable increases in SOC content in the upper soil layer due to fertilization, varying between 6% (Huang et al., 2020) and 15-16% (Geisseler & Scow, 2014; Han et al., 2016). Increments observed in the current study, however, were generally small (averaging 3%) and were not related to site or management factors, in agreement with findings from a prior global meta-analysis about the effects of nitrogen on cultivated soils (Lu et al., 2011).
The average carbon sequestration rate in fertilized soils in relation to unfertilized controls was 0.12 t ha-1 yr-1 with a total increase of 1.47 t C ha-1 in the Pampas soils. This represents an annual increase of 2.2‰ of the SOC stock due to fertilization. The results of a large number of experiments in China show an average sequestration rate of ca. 0.15 t C ha-1yr-1 (Waqas et al., 2020) with balanced fertilization. The total increase in SOC stock ranged from 1 t C ha-1 in initially rich SOC soils to 6 t C ha-1 in initially poor SOC soils (Ren et al., 2021). The effect of fertilization on SOC content in the Pampas is generally lower than that observed in most synthesis studies mentioned above. The slight effect of fertilization on SOC stock in the Pampas Region seems to be related to the low rate of nutrients applied. When SOC stocks were calculated for different data sets, i.e. treatments that received either low (< 50 kg N ha-1 year-1; n = 11) or high N rates (> 50 kg N ha-1 year-1; n = 30), SOC increases of 1.01 and 1.99 t SOC ha-1 were identified, respectively. As suggested, SOC changes respond to the amount of nitrogen applied.
At a global scale, it has been estimated that nitrogen addition generates an increase in plant biomass (Xu et al., 2020) and residue input to soils ranging between 5 % (Xu et al., 2020) and 30-35 % (Lu et al., 2011; Huang et al., 2020). The enhanced residue input through fertilization rules the increase in SOC stocks, especially under reduced soil fertility (Huang et al., 2020). In China’s croplands, yield increases of the main crops due to fertilization vary between 50% and 300% depending on the species (Waqas et al., 2020), which represents a huge difference in residue carbon inputs for fertilized or unfertilized soils. In the experiments across the Pampas Region included in this meta-analysis, the effect of fertilization on carbon input from crop residues was much less important. Carbon inputs from crop residues were evaluated in 13 of the experiments. Mean carbon inputs were only 12% higher in fertilized soils than in unfertilized controls (data not shown), which may account for the slight impact of fertilization on SOC stocks. Nevertheless, regular nutrient rates used by farmers of the Pampas are approximately half the rate applied in the experiments included in this meta-analysis (Alvarez et al., 2021). Therefore, the effect of fertilization on SOC stock under common agricultural management conditions is expected to be even lower than that estimated in this study.
Existing literature is contradictory as to what factors regulate the impact of fertilization on SOC stocks. It has been reported that temperature has positive (Ren et al., 2021), negative (Lu et al., 2011) or null (Han et al., 2016) effects on changes in SOC stocks produced by the application of nutrients. The impact of texture on SOC change is unclear (Waqas et al., 2020). Precipitation can have a positive impact (Ren et al., 2021) while the initial SOC level has a negative one (Ren et al., 2021). However, none of these possible effects have been observed in the Pampas experiments. The slight increase in SOC stocks of the Pampas soils cannot be attributed to a SOC level close to saturation. A regional analysis has shown that agricultural soils of the Pampas are far from saturation and they could double their SOC content in the topsoil (Alvarez & Berhongaray, 2021). Although fertilization led to increases in SOC stocks when comparing fertilized to unfertilized treatments, overall SOC stocks declined in most experiments compared to initial levels. The decrease of SOC stocks during the experiments was 4-6 t ha-1, a larger amount than the gain produced by fertilization. Fertilization did not compensate for SOC losses due to cultivation in most cases.
Unfortunately, the impact of fertilization on the subsurface soil was not evaluated in any of compiled experiments. Since SOC has not been affected below 50 cm depth for over a century of cultivation in the Pampas (Berhongaray et al., 2013), it can be assumed that below that depth there will be no impact of fertilization on soil carbon pools. Under the most optimistic scenario, a similar relative increase in SOC can be assumed to occur in topsoil and subsoil. The average topsoil SOC stock for the 71 treatments in which nutrient rates were accurately defined was 57.5 t ha-1 and the average RR was 1.02. By applying a SOC stratification model (Berhongaray et al., 2013) for Pampas soils, the SOC stock for the 0-50 cm was estimated to be 96.1 t ha-1. The potential carbon sequestration resulting from fertilization for the 0-50 cm soil layer would increase to 1.9 t ha-1, but it would still be lower than the cumulative carbon footprint (2.31 t Ceq ha-1). Consequently, fertilization does not contribute to mitigation of climate change in the region.
Studies on carbon footprint in agriculture do not normally consider changes in soil carbon due to the difficulty of estimating them. For example, in the Pampas Region the carbon footprint of corn production has been calculated at 1.4 t CO2 eq. ha-1 yr-1 (0.38 t Ceq. ha-1 yr-1) in the Province of Córdoba, of which 40% results from the use of nitrogen fertilizers (Bongiovani et al. 2023). If the carbon sequestration coefficients in the soil by fertilization estimated in the present study were used, the carbon footprint of corn production would be reduced by 30%. This indicates the importance of having data on the effect of management practices such as fertilization on SOC stock. However, site-specific coefficients should be available. In the case of those calculated in this study, most of the experiments were carried out in humid areas and extrapolating the averages to semi-arid areas is dangerous.
CONCLUSIONS
In the Pampas, small increases in SOC stocks are achieved through fertilization when comparing fertilized versus unfertilized soils. However, most soils in the experiments studied lost SOC over time and such loss was not compensated by the application of nutrients. At the same time, the greenhouse gases emitted due to the manufacture, transport and application of fertilizers will generate a warming effect that will not be compensated by carbon sequestration in the soil due to fertilization. Nutrient application should be considered as a practice with no potential to mitigate global warming in the region.

