


 Inglés (pdf)
 Articulo en XML
 Referencias del artículo
 Enviar articulo por email
 Citado por SciELO
  Similares en
SciELO
Similares en
SciELO 
 Permalink
INTRODUCTION
Paleolimnology has been used for decades to reconstruct past climatic variability and, more recently, to identify environmental changes due to anthropic impact (Saulnier-Talbot, 2016; Dubois et al., 2018). Paleolimnological data provide invaluable tools to elucidate temporal shifts in the bio-physicochemical dynamics within lakes and their catchments (Cohen, 2003; Paterson et al., 2020). Lake archives provide continuous records of long-term environmental change gathering information from their airsheds and watersheds. Therefore, in order to reconstruct past environmental conditions, it is necessary to look into the past by using environmental proxies such as physical (e.g., sedimentary facies, sediment magnetic properties, structures, grain-size), geochemical (e.g., organic matter content, chemical elements, biomarkers), or biological (e.g., diatoms, chironomids, cladocerans, chrysophytes) indicators (Birks and Birks, 2006; Pienitz and Lotter, 2009).
Recent studies have shown that reservoir sedimentary records provide high resolution archives of past environmental variability (Winston et al., 2014; Wengrat et al., 2018, 2019; Gangi et al., 2020; Halac et al., 2020). Thus, paleolimnology has become a successful tool to further decipher the response of artificial water bodies faced with environmental stressors such as human activity and hydroclimatological changes (Costa-Böddeker et al., 2012; Moorhouse et al., 2018; Wang et al., 2021). In addition, paleolimnology becomes an effective tool to establish the environmental base condition of natural and artificial lakes, something which is usually difficult to establish due to a lack of information spanning pre-monitoring periods, which do not normally go back longer than 30 years (Pienitz and Vincent, 2003; Woodbridge et al., 2014). Knowledge of the initial condition is essential to establish water quality assessment and proper management of catchments (Smol, 2010).
It is known that the water quality of reservoirs around the world has deteriorated as a result of changes in trophic status, many of which have reached hypereutrophic levels (Padedda et al., 2017; Oliver et al., 2019). Recently, paleolimnology has focused on the evolution of aquatic systems deterioration linked to multiple causes such as human activity and climate change (Dearing, 2013; Saulnier-Talbot, 2016; Moorhouse et al., 2018; Wang et al., 2021). The acceleration of eutrophication during recent decades has seriously deteriorated the water quality of a large number of reservoirs in South America, most of which were built as drinking water supplies for many urban locations (Roldán Pérez and Ramírez Restrepo, 2008; Cardoso-Silva et al., 2018; Gangi et al., 2020).
Drivers triggering environmental changes in reservoirs may include those in the hydrological balance (i.e., rainfall variability and river discharges, Elchyshyn et al., 2018; Kennedy, 2005), land-use change (e.g., urban growth and emission of effluents, Moorhouse et al., 2018; Schroeder et al., 2016; Winston et al., 2014), deforestation and soil erosion (Ye et al., 2014; Krasa et al., 2019), fires (Bonansea and Fernandez, 2013), as well as lake management policies such as level control (Xu et al., 2019).
Although reservoirs are vitally important water supplies in the semiarid central region of Argentina (Dasso et al., 2014), the noticeable lack of long-term monitoring and paleolimnological studies hamper the long-term evaluation of water quality changes. Our research aims to reconstruct the environmental evolution of a reservoir located in the central semiarid region of Argentina, and to identify the most important natural and anthropic drivers. The site of study, San Roque reservoir (SRr), is the main source of drinking water for the city of Córdoba (1.3 million inhabitants). The goals of this work are: i) to reconstruct the environmental history of the SRr for the last 100 years through a paleolimnological analysis; ii) to determine the influence of both regional natural and anthropic drivers on the evolution of the environmental state of the SRr; iii) to establish the environmental base condition of the SRr, when the anthropic impact in the catchment was low or negligible. These results provide valuable information for the development of management policies for the reservoir and its fluvial catchment under future scenarios of climate change and growing anthropic pressures.
The SRr (31° 22’ S, 64° 27’ W; Fig. 1a) is located in the semiarid region of central Argentina at 608 m asl (meters above sea-level) in the Punilla Valley between the Sierras Chicas and Sierras Grandes in Córdoba, Argentina (Martino et al., 2012). SRr is a multipurpose reservoir which supplies drinking water to more than one million inhabitants in the city of Córdoba and surrounding areas, as well as providing flood control, power generation, recreation and tourism. It was developed in two stages. The first dam, built between 1881 and 1891, was replaced in 1944 by the current dam, enlarging the capacity of the reservoir from 112 to 201 hm3(Ballester, 1931). Changes in reservoir morphometry occurred after the second dam construction can be seen in geological maps corresponding to different years (1932 CE: https://repositorio.segemar.gov.ar/handle/308849217/570; 2000 CE: https://repositorio.segemar.gov.ar/handle/308849217/2097).The surface area and volume of the reservoir are 15 km2and 201 hm3respectively, the average water depth is 13 m, and maximum water depth is 35 m, close to dam (see bathymetry in Fig. 1).
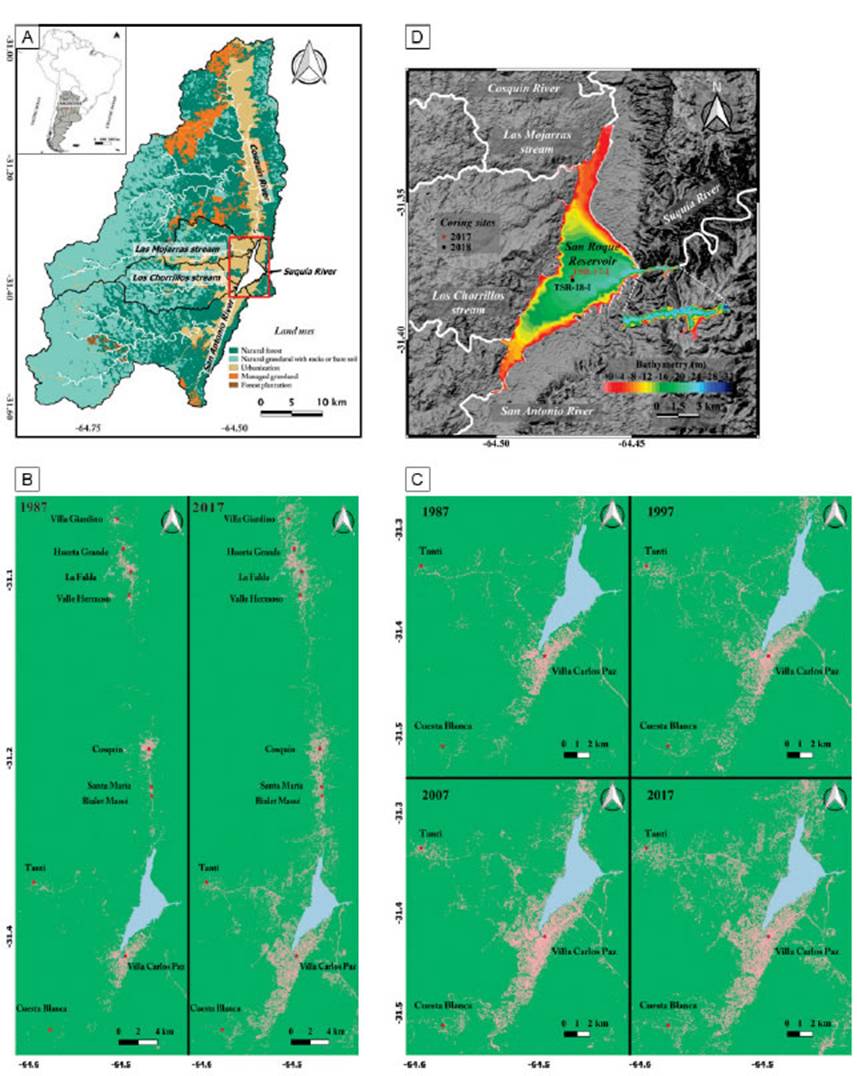
Figure 1 a) Location of San Roque reservoir in South America and in Central Argentina. San Roque catchment land uses, main tributaries (San Antonio and Cosquín Rivers, and Las Mojarras and Los Chorrillos streams) and the effluent (Suquía River) are indicated. b) and c) Spatiotemporal urban growth in the San Roque reservoir catchment area and in the littoral area of San Roque reservoir, respectively. Urban growth was estimated by multi-temporal analysis of Landsat 5 (1987, 1997, and 2007) and Landsat 8 (2017) satellite images. d) Bathymetry of San Roque reservoir (2016 CE; Gomez et al., 2016). Location of coring site TSR-18-I and TSR-17-I in San Roque reservoir. Main tributaries and the effluent are indicated.
The SRr catchment has a surface area of 1750 km2(Merlo et al., 2011; Monferrán et al., 2011) and is composed of igneous and metamorphic rocks (Martino et al., 2012). The SRr is fed by four main tributaries (Fig. 1a), the San Antonio and Cosquín rivers and Los Chorrillos and Las Mojarras streams, while the Suquía River is the only effluent (Rodríguez and Ruiz, 2016). The regional climate is semihumid to semiarid. Mean annual precipitation is 780 mm, while total annual precipitation may range between 400 and 1000 during dry or wet years respectively (Pasquini et al., 2006; Colladón, 2014). The annual rainfall pattern is seasonal, with a wet season from October to April (Colladón, 2014). The climate has a high diurnal temperature variation with a mean annual temperature of 14°C and minimum and maximum mean values of 7ºC and 24ºC, respectively (Colladón, 2004). The SRr catchment is located in the Chaco Serrano district, which has native forest between 500 and 1300 m asl. There is a major proportion of grasslands above 1000 m asl, where bare soil is developed (Cabrera, 1971; Cabido and Zak, 1999).
The land-use in the SRr catchment is restricted mainly to grassland management associated with cattle and poultry breeding, while a small portion of the watershed is occupied by forest plantations (Fig. 1a). During recent decades, the population and urban development in the Sierras Chicas region have increased markedly (Deon, 2015). The change of land-use to urban occupation has increased noticeably in the cities of Villa Carlos Paz, Cosquín and La Falda, and in several small villages located next to San Antonio River and Los Chorrillos stream, e.g. Cuesta Blanca and Tanti, respectively (Fig. 1b).
During the last three decades, the rate of urbanization has increased by more than 200%, rising from 19 km2to 46 km2throughout the basin (Fig. 1b). However, during the same period, the urbanization fringing the SRr littoral area, e.g., the city of Villa Carlos Paz, the main urban center of the SRr basin, has grown more than 300%. The growth of urbanization at the southern area occurred in the late 90s (San Antonio River area) while during the 21st century the urban expansion took place in the southwestern area (Fig. 1c).
Preliminary results indicate that the water quality of the reservoir has shown conspicuous deterioration since the mid-1970s (Bonetto et al., 1976). Nowadays, the water quality is still decreasing drastically due to the large unplanned urban development in the SRr basin, which results in the delivery of untreated sewage discharges from direct and diffuse sources. Other anthropic activities like deforestation and fires also contribute to the increase of allochthonous organic matter and sediment delivery to the SRr (Rodríguez and Ruiz, 2016). In this context, several processes intensified at the SRr during the last decade, including changes on its trophic state (from eutrophic to hypereutrophic), occurrence of recurrent cyanobacteria blooms, the development of hypolimnetic anoxia conditions and fish death, among others (Rodríguez and Ruiz, 2016; Halac et al., 2020).
MATERIALS AND METHODS
Core sampling, sedimentary description and geochemistry
A 94-cm-long sedimentary core (TSR-18-I) was collected in December 2018, using a gravity corer (IQTEC, “Bob corer type”). The core was retrieved in the central area of the reservoir (31° 22’ 42” S; 64° 28’ 19.4” W; Fig. 1d) at a water depth of 18 m. The coring site is located at 4.5 km of Cosquín-Las Mojarras fluvial mouths, at 3.1 km of San Antonio- Los Chorrillos fluvial mouths, and at 0.7 km of the west lake shoreline. The core was stored at 4°C within 1-2 h after collection at the GeoLimnoLab, CICTERRA, Córdoba, Argentina.
Computed tomography images were obtained to recognize fine-scaled sedimentary structures in the undisturbed sedimentary core. Then the core was cut in two halves and photographed. An initial core description was made following the criteria proposed by the Limnological Research Center Core (http://lrc.geo.umn.edu/laccore/icd.html) and according to Schnurrenberger et al. (2003). The magnetic susceptibility (MS) of the sediments was measured on the surface of the split half core at 1 cm intervals with a MS2E Bartington sensor at the GeoLimnoLab. Values were expressed in 10−5 SI (dimensionless). Sediment samples were taken continuously every 1 cm, or at each macroscopic sedimentological change.
Sediment water content (H2O) was determined by weighing the subsamples before and after drying at 105°C for 24 h. Total Organic and Inorganic Carbon content (TOC and TIC) were determined by loss-on-ignition (LOI) and obtained by weighing the samples after heating at 550°C and 950°C, respectively (Dean, 1974; Heiri et al., 2001). The amount of organic carbon was estimated from the mass loss (percentage of dry weight) after combustion at 550°C (LOI 550°C), multiplied by 0.5. Subsequent mass lost after combustion at 950ºC multiplied by 1.36 (the ratio between the molecular weights of CO3and CO2) gives a theoretical mass of carbonate in the sample.
Relative density values of sediments were estimated from the computer tomography images using the free software ImageJ (Foucher et al., 2020). The obtained values were further calibrated using the dry bulk density (g.cm-3), which was also calculated according to Binford et al. (1993) at a centimetric scale.
Chronology
The chronology of core TSR-18-I was established by correlation with the previously 210Pb dated core TSR-17-I (Halac et al., 2020). Both cores, TSR-18-I and TSR-17-I, were correlated based on the magnetic susceptibility pattern, water content depth-profile values and according to sedimentary features (Fig. 2). 210Pb age-depth model of core TSR-17-I has been published elsewhere (Halac et al., 2020).
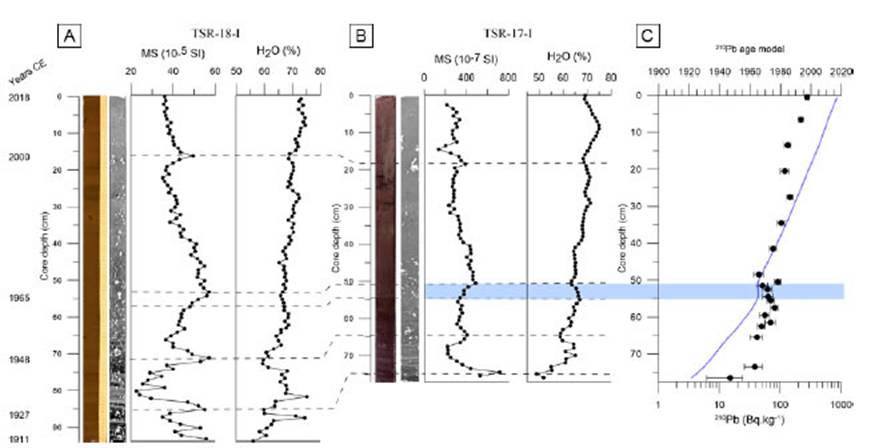
Figure 2 a) and b) Magnetic susceptibility (MS, 10-5 SI units) and water content (H2O, %) of TSR-17-I and TSR-18-I, respectively. c) 210Pb age model of TSR-17-I (Halac et al., 2020). Correlation of maximum and minimum values of the proxies between both cores is shown by broken lines. The light-blue band indicates the levels of TSR-17-I (55-51 cm) assigned to 1965 CE.
Pigment analyses were performed at the High Performance Liquid Chromatography Laboratory (CEPROCOR, Córdoba, Argentina) on samples taken every 1 cm, according to the method described by Lami et al. (1994). Pigments in samples of ≈ 1 g wet sediment were extracted overnight with 10 mL of acetone/water mixture (90:10), under nitrogen atmosphere and maintained at 4ºC in darkness. The extracts were vortexed and centrifuged at 3,000 g for 10 min. The supernatant was filtered through a Durapore (PVDF) filter (0.22 μm diameter) and the extraction was repeated (2 to 3 times) until the supernatant was colorless. Chlorophyll derivatives (CD) and total carotenoids (TC) were measured in a visible UV spectrophotometer (UV- 160 Shimadzu) with a 1-cm light pass cuvette. The extracts were read at 410, 430, 450, 665, and 750 nm. Carotenoid concentrations were expressed in mg g-1 organic matter (mg g-1 LOI) (Züllig, 1985), whereas chlorophyll derivatives were expressed in absorbance units (U) per g of organic matter (U g-1 LOI), (Guilizzoni et al., 1983). Individual carotenoids and chlorophylls were detected by Reversed Phase High-Performance Liquid Chromatography with a Photodiode Array Detector (Alliance 2690 and 996 PDA, Waters). The gradient elution program was performed according to Lami et al. (2000) in a C18 column (Phenomex C18 Luna 5 μm particle size; 250 mm x 4.6 mm ID). The pigments isolated from sediments were identified by spectral comparison (between 400 and 670 nm) and retention time (Rt) with those obtained for commercial pigment standards (DHL Laboratory Products, Denmark). Chromatograms were extracted at 460 and 665 nm. The concentration of carotenoids and chlorophylls (and their derivatives) was expressed in terms of organic matter (LOI at 550°C) to take pigment degradation into account (Hodgson et al., 2004). The concentration of pigments was determined on the basis of molar extinction coefficients at detection wavelengths. The molar extinction coefficients E1% 460 and E1% 656 were derived from the E1% max reported in Egeland et al. (2011). The pigment affiliation was based on Guilizzoni and Lami (2003).
Spatio-temporal urban growth analysis in the SRr catchment area was based on a multi-temporal analysis of Landsat 5 (1987, 1997, 2007) and Landsat 8 (2017) satellite images. This analysis was performed with the SNAP software (version 7.0.0) by unsupervised K-means cluster analysis. Clusters corresponding to urban areas were added to each image to determine the total urban area at different years, using the equation (1). The estimation of interdecadal urban growth was expressed as a percentage.
Urban area (km2) = (Σ urban area clusters (%)) * total area (km2)/100 eq. (1)
A constrained hierarchical cluster analysis (CONISS) and the broken stick model, performed with the Rioja package (Juggins, 2009; R software), were used to statistically confirm sedimentary facies previously outlined along core TSR-18-I (see Sedimentary facies). This analysis made it possible to recognize distinctive portions of sediments based on measured proxies (SM, TOC, TIC, DC and CT). Furthermore, Principal Component Analysis (PCA; Oksanen et al., 2019; Vegan package, R software) was further performed to inspect proxy relationship and variation patterns along the sedimentary record. Before applying PCA, the linear response of analyzed proxies was confirmed (Jongman et al., 1995).
Total annual precipitation (mm) (at 31.25° S, 64.25° W) for the period 1901-2018 CE was obtained from CRU TS 4.04 dataset 0.5° x 0.5° cell series (Harris et al., 2020). Annual precipitations were calculated according to the hydrological year of the region (July yr1 to June yr+1).
RESULTS
Cores TSR-18-I and TSR-17-I were correlated based on the presence of sedimentary structures and according to the magnetic susceptibility pattern and water content values at four distinctive levels along core-depth (see Fig. 2 and Table 1). The presence of thick lamination, maximum values of MS (55* 10-5 and 716* 10-7 SI in TSR-18-I and TSR-17-I, respectively), and minimum values of H2O (60 and 55% in TSR-18-I and TSR-17-I) at level 86 cm in core TSR-18-I allowed to link this section with level 75 cm in core TSR-17-I (Fig. 2a, b). According to the 210Pb age model developed in TSR-17-I, level 75 cm corresponds to 1927 CE (Fig. 2b). Ages below level 86 cm were extrapolated based on the sedimentation rate value estimated in the basal section of TSR-17-I (0.49 cm. yr-1). Thus, an age of 1911 CE was assigned to the TSR-18-I base (level 94 cm; Fig. 2a, b).
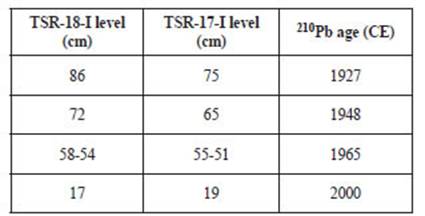
Another correlation was established between levels 72 cm (core TSR-18-I) and 65 cm (core TSR-17-I). The development of laminated sediments and an increase in MS values at level 72 cm (core TSR-18-I) can be correlated with a shift in MS value in laminated sediments at level 65 cm on TSR- 17-I. According to Halac et al. (2020), level 65 cm corresponds to 1948 CE (Fig. 2a, b). The shift toward higher MS values identified between levels 58-54 cm in TSR-18-I and 55-51 cm in TSR-17-I, make it possible to correlate both intervals and to assign a 210Pb age of 1965 CE (Fig. 2). A constant decreasing pattern of MS values and an increase in H2O values occur upwards, from levels 54 cm (core TSR-18-I) and 51 cm (core TSR-17-I) up to levels 17 cm and 19 cm respectively, where MS values display a marked peak. Then, the assigned 210Pb age for level 17 cm in TSR-18-I is 2000 CE (Fig. 2a, b). The core correlation in these intervals is strengthened by the presence of faintly laminated muds at 28-24 cm/ 22-19 cm in TSR-18-I and at 30-29 cm and 25-11 cm in TSR-17-I (Fig. 2a, b).
Multi-proxy features, including sedimentology, geochemistry, and pigment data of core TSR 18-I, are presented in figures 3 and 4. Sediments overall core TSR-18-I correspond to a succession of dark brown to black banded, laminated to faintly laminated and massive muds. Laminated silty-sandy sediments are present in the core basal portion (between levels 83.5-74.5 cm). Magnetic susceptibility values range between 23 and 57 * 10-5 SI with maximum values along the lowermost section of the core. H2O varies between 56 and 75%, with an increasing trend towards the top of the core. Relative density values range from 0.33 to 0.79 g.cm-3, which maximum values along the lowermost section followed by a decreasing trend toward the top of core. Relative density curve match magnetic susceptibility variability and mirror H2O values.
Total inorganic carbon (TIC) and total organic carbon (TOC) percentages vary from 1.1 to 3.4% and 4.4 to 6.8%, respectively. Both proxies exhibit comparatively higher values at the base of the core followed by a decreasing trend along the middle section (from level 60 to level 12 cm) and an increment toward the top of the core, where they reach the maximum TOC values.
Total carotene (TC) values range from 0.3 to 1.5 mg. g LOI-1, presenting maximum values at the core bottom, followed by a steady upward decrease. Chlorophyll derivative (CD) values vary from 16 to 149 Ug. g LOI-1, showing a steady increase from base to top, where the maximum values are observed.
Seven lithological units (LU; Fig. 3) were distinguished along the core based on sedimentary structures, texture, type of contacts and color of sediments as well as by physical and chemical proxies (TOC, TIC, TC and CD). A general description with mean values of measured proxies is presented in table 2.
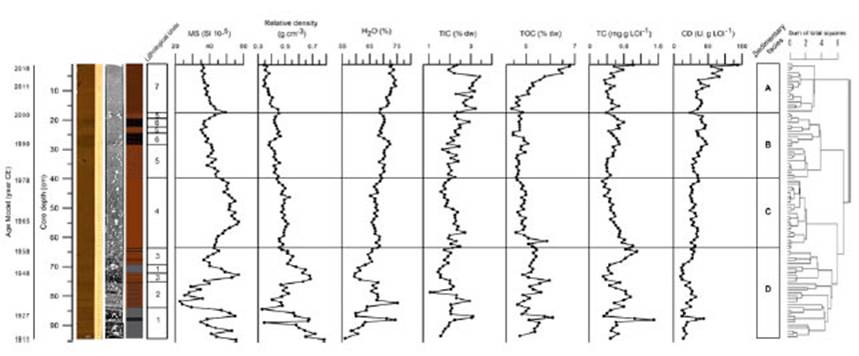
Figure 3 Depth profiles of physicochemical and biological proxies in the SRr core (TSR-18-I): magnetic susceptibility (MS, 10-5 SI units), relative density (g.cm-3), water content (H2O, %), total inorganic carbon (TIC, %), total organic carbon (TOC, %), total carotenes (TC, mg. g LOI-1) chlorophyll derivatives (CD, U. g LOI-1). Core photograph, computed tomography image and lithological units are shown on the left. Sedimentary facies D, C, B and A are indicated from base to top. Cluster analysis is shown on the right and matches with sedimentary facies.
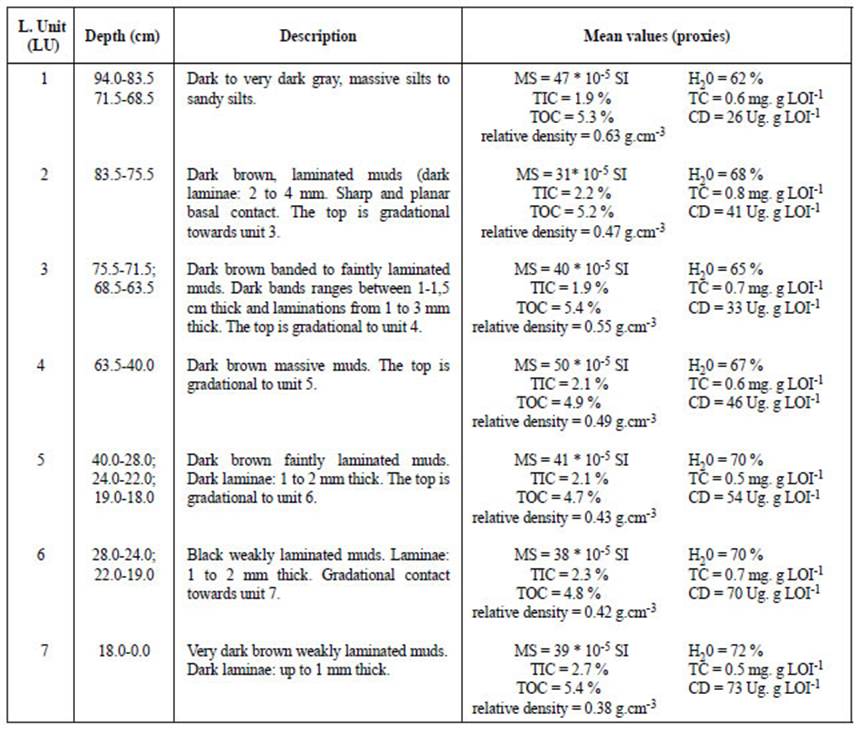
Table 2 Description of the lithological units (LU), and mean values of proxies (MS: Magnetic Susceptibility; H2O: Sediment Water Content; TIC: Total Inorganic Carbon; TOC: Total Organic Carbon; TC: Total Carotenes; CD: Chlorophyll Derivatives).
Sedimentary facies
Following the criteria proposed by the Limnological Research Center Core (http://lrc.geo.umn.edu/laccore/icd.html) and according to Schnurrenberger et al. (2003), the identified lithological units (Table 2) were merged into four sedimentary facies (D, C, B and A). The proposed facies scheme was further confirmed by a cluster analysis CONISS and the broken stick model (Figs. 3, 4).
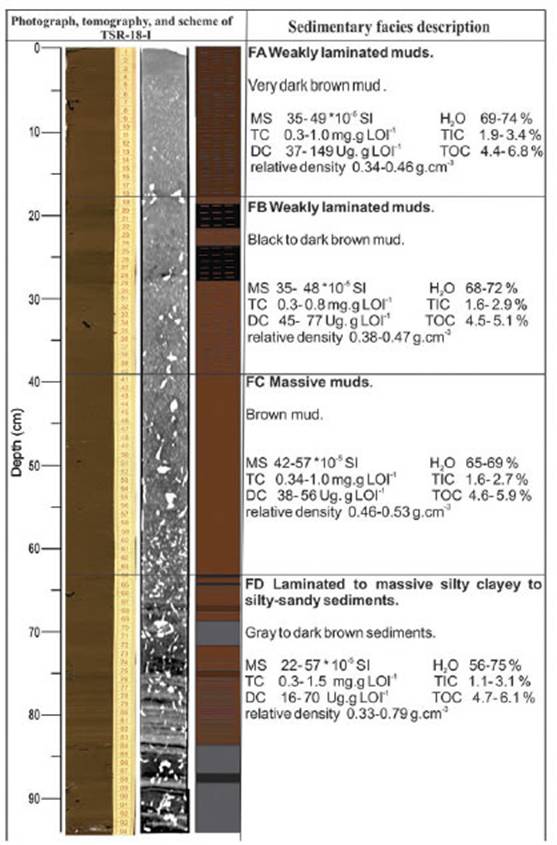
Figure 4 Description of sedimentary facies including: value range of the main proxies (MS, relativedensity, H2O, TIC, TOC, TC, and CD; see abbreviations in figure 3), core photograph, computed tomography image and lithological unit scheme of TSR-18-I.
Facies D (94-64 cm) includes LU 1, 2, and 3. It is composed of gray to dark brown silty-sandy to muddy sediments. This facies is mostly massive, except for the laminated to banded interval from levels 83.5 to 75.5 cm (Table 2). MS, relative density, TC and TOC present a very variable pattern (MS: 22-57 *10-5 SI, mean value: 41*10-5 SI; relative density: 0.33-0.79 g.cm-3, mean value: 0.56 g.cm-3; TC: 0.3- 1.5 mg. g LOI-1, mean value: 0.7 mg. g LOI-1; TOC: 4.7-6.1%, mean value: 5.3%) while H2O, CD and TIC exhibit the lowest values of the entire record (H2O: 56-64%, mean value: 75%; CD: 16-70 Ug g LOI-1, mean value: 32 Ug. g LOI-1; TIC: 1.1-3.1%, mean value: 2.0%) (Figs. 3, 4). Regarding high MS variability, facies D presents several MS peaks (86-84 cm and 73-71 cm) coincident with the development of laminated sandy-silts as well as a drop in the MS values (90-85 cm and 83-74 cm) simultaneously to the increment of organic matter proxies.
Facies C (64-40 cm) is composed of massive dark brown muds (LU 4). One of the main features of facies C is the development of 4-mm-thick black laminae (Fig. 4, level 64 cm). In general, MS, relative density, and H2O present a lower variability than in facies D (e.g. MS values range between 42 and 57 *10-5 SI; relative density between 0.46-0.53g.cm- 3; and H2O between 65 and 68%). Relative density presents a lower mean value in comparison with facies D (from 0.56 to 0.49 g.cm-3). TOC (mean value: 4.9%, maximum value: 5.9%) and TC (mean value: 0.6 mg. g LOI-1, maximum value: 1.0 mg. g LOI-1) show lower values than facies D. Moreover, facies C is characterized by a marked decreasing trend of TC from base to top. CD values range between 38 and 56 Ug. g LOI-1 (Figs. 3, 4).
Facies B (40-18 cm) comprises LU 5 and 6 and is composed of dark brown to black massive/faintly laminated muds (Table 2). The basal contact with facies C is diffuse. MS and relative density values show a decreasing pattern (48 to 35 * 10-5 SI; 0.47 to 0.38 g.cm-3) (Figs. 3, 4). Some organic proxies display an upward increasing trend along facies B, exhibiting comparatively higher mean values than in facies C (TIC: mean value 2.2%, maximum value 2.9%; CD: mean value 59 Ug. g LOI-1, maximum value 77 Ug. g LOI-1). Conversely, TC and TOC show a uniform pattern.
Facies A (18-0 cm) includes LU 7 and consists of very dark brown weakly laminated muds. The basal portion of this facies is marked by a sharp increment in the MS value while there is a noticeable upward decrease in H2O, TIC, TOC, TC and CD values. Along the uppermost portion of the core this facies shows a marked change toward higher values in the organic proxies (TOC: mean value 6.3%, maximum value 6.8%; TC: mean value 0.5 mg. g LOI-1, maximum value 1.0 mg. g LOI-1 and CD: mean value 73 Ug. g LOI-1, maximum value 149 Ug. g LOI-1). Furthermore, TOC and CD reach the maximum values of the entire core at the uppermost sediments, while MS and relative density exhibit the minimum values of the core.
PCA analysis on the multi proxy data (Table 3) showed that two main components (PC1 and PC2) account for a total of 66.6% of the total variance (42 and 24.6%, respectively). The aggrupation of samples according to the identified facies becomes evident in Fig 5. PC1 shows a significant positive correlation with MS, and a negative correlation with organic proxies (Table 3). Most of the samples corresponding to facies D and facies C are positively related, while samples of facies A are negatively associated with PC1; samples of facies B are located in the central area of PC1 (Fig. 5). Regarding PC2, there is a significant positive correlation with TOC and TC, and a negative one with TIC and CD (Table 3). In general, samples of facies D are positively associated, while most samples of facies C, B, and A are negatively related to PC2 (Fig. 5).
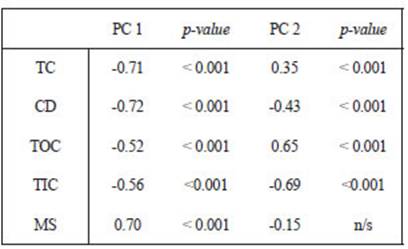
Table 3 Correlation coefficients among proxies (MS, TOC, TIC, CT, DC; see abbreviations in figure 3) and PCA axes and their p-values. Number of samples: 94.
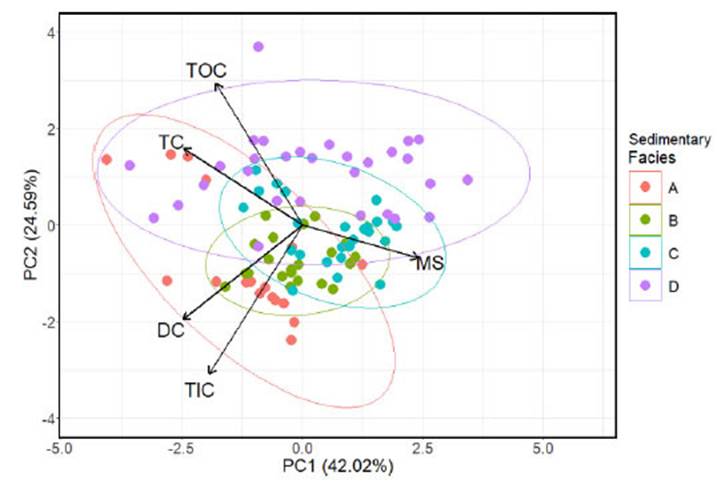
Figure 5 Principal Component Analysis biplot. Data set includes: MS, TIC, TOC, TC, and CD (see abbreviations in figure 3). The first axis, PC1, is positively correlated with MS, and the second axis, PC2, is positively correlated with TOC and TC, and negatively correlated with TIC and DC. The samples are grouped according to sedimentary facies.
Fossil pigments
Figure 6 shows the values of chlorophyll-a (chl a) and their derivatives, and βcarotene along TSR- 18-I core. Chl a was detected in facies A and B, and along some intervals of facies D, reaching its maximum values in facies A (26 and 21 nmol.g LOI1). Pheophytin a (pheo a) is mostly constant throughout the record, except in facies B where the highest values are present (e.g., 340, 274, 230 nmol.g LOI-1).
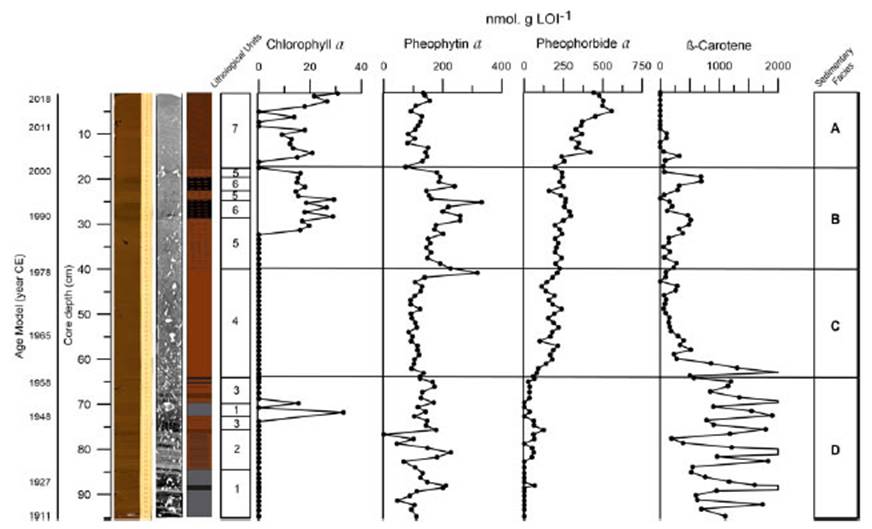
Figure 6 Depth profiles of fossil pigments: chlorophyll-a (chl a), pheophytin a (pheo a), pheophorbide a (phide a), and β-carotene (ββ -car) (nmol.g LOI-1). Sedimentary facies D, C, B and A are indicated from base to top. Core photograph, computed tomography image, and lithological units are shown on the left.
Pheophorbide a (pheide a) shows a constant upward increase along the core, reaching its highest values in facies A (e.g., 412, 411, 380 nmol. g LOI1; levels 3, 2 and 5 cm, respectively). The highest values of pheide a and chl a at the uppermost section mostly account for the CD increase at the core top (Figs. 3, 6). β-carotene (ββ-car) presents great variability throughout the core (183-6234 nmol. g LOI-1), while the highest values are present in facies D. This pattern is also shown by TC along facies D (Figs. 3, 6). ββ-car decreases upwards, until it reaches non-detectable values in the uppermost portion of facies A.
DISCUSSION
The multi-proxy analysis of the sedimentary core TSR-18-I provided the basis for reconstructing changes in the environmental condition of the SRr during the period from 1911 to 2018 CE. The combined analysis of sedimentary facies, geochemistry and fossil pigments throughout the paleolimnological record made it possible to decipher four stages in the SRr based on temporal changes in sedimentation, organic matter sources and the trophic states of the reservoir. The analysis of hydrometeorological and land use data provided clues to unravel the influence between natural and/or anthropic drivers of recorded environmental changes.
MS value variations throughout the record (Fig. 3) indicate changes in lake sediment composition, which may be controlled by the dynamics of the fluvial input over time (e.g., Brahney et al., 2008; Menounos, 1997). In a low water volume scenario, higher fluvial influence at the inner-lake is recorded by laminated sandy sediments characterized by high values of MS and relative density (facies D and C). Conversely, finer sediments and a decreasing trend of MS and relative density can be associated with dominant pelagic sedimentation in a water body with larger volume, which would have conditioned the transport of coarser sediments from the tributary rivers to the inner-lake area (facies B and A). The distinctive patterns of sedimentary dynamic ruled by the changes in the water column depth are reflected by the PCA1, which correlates highly with MS values. Facies D and C (high MS values) can be associated with sedimentation under comparatively lower water levels, while facies B and A (low MS values) with the settling of particles at a larger column of water (Fig. 5 and Table 3).
Primary production proxies (TC and CD) allowed to track changes in the sedimentary organic matter source, reflecting a temporal shift from a terrestrial plant-dominated delivery (high TC content) to a phytoplankton-dominated state (high CD content). Previous studies demonstrated that carotenes (TC) are more closely associated with vascular plants (either terrestrial or macrophytes) than with phytoplankton (Carpenter and Leavitt, 1991). Since carotenes degrade more slowly than chlorophyll-a (chl a) and its derivatives (phe a, pheide a), they better preserve the signal of littoral and terrestrial contributions (Carpenter and Leavitt, 1991). In addition, carotenes are more easily degraded by grazing since they are fully metabolized. Conversely, chlorophylls derived from predated phytoplankton are converted into derivative composites like pheophorbides (i.e. pheide a) (Leavitt, 1993).
Regarding the dominant source of the sedimentary organic matter, PC2 can be used to better distinguish main changes in the dominant source for each facies. Positive correlation of PC2 with TC confirms the prevalence of a terrestrial source of OM during the deposition of facies D, from 1911 to 1958 CE. Conversely, the negative correlation of PC2 with CD and TIC, both with high values in facies B (from 1978 to 2000 CE) and A (from 2000 to 2018 CE), and in a larger proportion of facies C, is in agreement with an important change to a dominant autochthonous origin of the organic matter. The positive correlation between CD and TIC would highlight the biogenic control on the precipitation of carbonates. High pelagic primary production may trigger the precipitation of carbonates (Thompson et al., 1997) during cyanobacteria blooms (Teranes et al., 1999; Obst et al., 2009). Thus, high TIC values would indicate a high primary production condition, as it increases during algal blooms events. Therefore, in our study, facies D can be linked to an important input of organic matter derived from littoral plants, while facies B, A and a broad proportion of facies C, to a dominant pelagic primary production (Fig. 5).
This stage characterizes the initial condition of the water body after the construction of the first SRr dam (foundation) and the infilling process during its last part after the second dam building. The corresponding record (facies D) can be well differentiated due to the large variability in sediment composition and physiochemical proxies (MS: 22-57 * 10-5 SI; relative density: 0.33-0.79 g.cm-3; H2O: 56-75.1%; TOC: 4.7-6.1%). High MS values and coarser sediments (silt-sandy laminae) indicate the occurrence of episodic periods of high river influence (i.e.: 86-84 cm, 1926-1929 CE/73-71 cm, 1946- 1949 CE). Indeed, the presence of coarse-grain fluvial sediments was highly favored due to the lower water-volume. In particular, the short periods of highest river influence are coeval with a diminished primary lake production (i.e.: precipitation increase and CD decrease; Fig. 7).
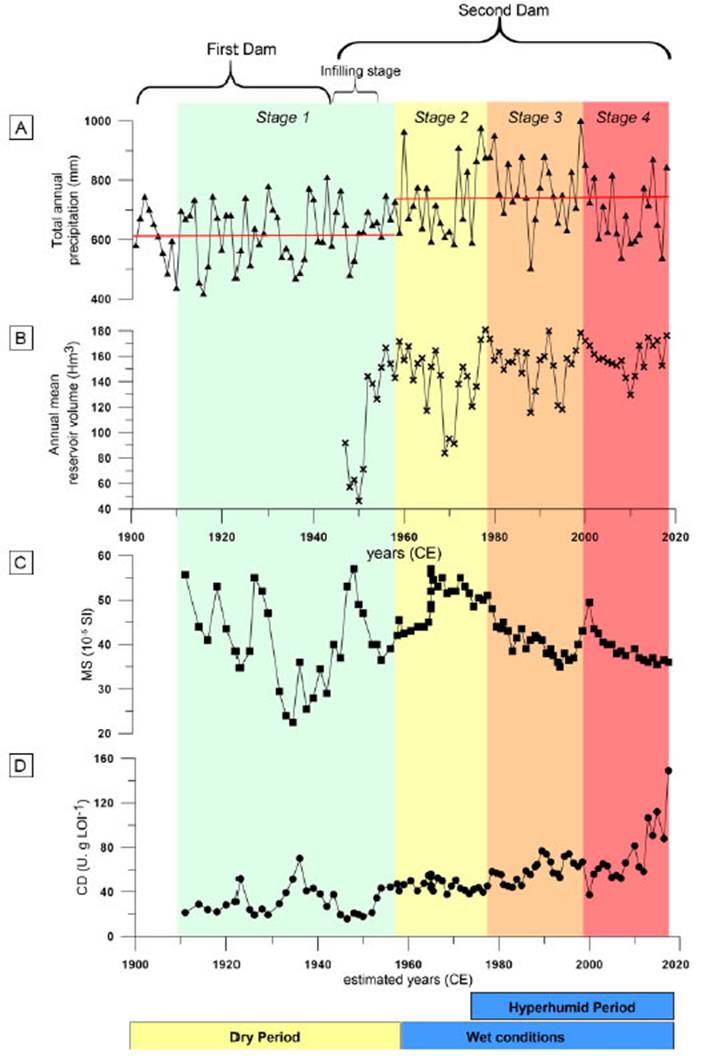
Figure 7 a) Total annual precipitation (millimeters, mm) of 31.25 S, 64.25 W region for 1901-2018 CE. Mean precipitation for 1901-1958 CE and 1959-2018 CE are indicated with red lines. b) Annual mean reservoir volume (cubic hectometers, Hm3) of San Roque reservoir for 1947-2018 CE. c) Magnetic susceptibility (MS, 10-5 SI units) determined on TSR-18-I. d) Chlorophyll derivatives (CD, U. g LOI-1) determined on TSR-18-I. The color bands indicate the different stages: light green (Stage 1), yellow (Stage 2), orange (Stage 3), red (Stage 4). Above, first and second dam period and infilling stage are indicated. Below, the dry, wet and hyper humid period are shown.
The decrease of MS and rise of organic proxies in the record of stage I (TOC: mean values 5.4%, TC: mean values 0.8 mg.g LOI-1) (90-85 cm, 1918-1925 CE/83-74 cm, 1931-1945 CE) can be linked to a minor fluvial contribution and thus, to a lower reservoir volume which promote the development of a littoral biota. Previous results (Cachi, 1975; Gavilan, 1981) report that prolonged low volume periods favored the growth of littoral plant communities around the SRr. These plant communities were submerged during periods of increased volume, becoming part of the input of organic matter into the system.
Overall, the low content of CD and pheide a in the record of stage I (mean: 32 Ug.g LOI-1 and 31 nmol.g LOI-1, respectively) indicates low autochthonous primary production in comparison with the following stages (see Fig 6 and 7), probably due to a combined effect of low nutrient input, water column instability and turbidity (Halac et al., 2020). It is known that the mentioned factors are detrimental to the development of phytoplankton communities (e.g., Dokulil, 1994; Liu et al., 2011).
Low precipitations (annual mean: 624 mm) characterized hydroclimatic conditions during stage 1 (1901-1958 CE), resulting in frequent reservoir volume fluctuations during prolonged drought events. This is in agreement with the hydroclimatic variability observed in central Argentina, where frequent drought events were registered during the first half of the 20th century. In particular, a specific period of severe droughts was identified in the 1930s in the Pampean region, known as the “Dust Bowl Drought,” which was characterized by extremely arid conditions, soil erosion and dust storms (Tripaldi et al., 2013; Guerra et al., 2015, 2016).
A second stage characterized by new environmental conditions in the SRr was the result of the noticeable increase in water volume and stabilization of the water column after the second dam was built (Fig. 7). Stage 2 is mostly recorded by massive and homogenous sediments (Facies C), which would indicate pelagic sedimentation in a deeper water column overall the inner lake (Renaut and Gierlowski-Kodersch, 2010).
The onset of stage 2 is marked by an increase of TOC and TC values and a decreasing trend in relative density, probably due to pulses of terrestrial organic matter delivery caused by the water inflow after the second dam was built during the last part of stage 1 (Fig. 7b; c.a. 1944-1952 CE). The SRr volume increase from 91 hm3 in 1947 CE to 144 hm3 in 1952 CE (Stage 1; Fig. 7b), promote the expansion of the inner-lake area (lacustrine zone) recorded at the end of stage 1 and the onset of stage 2. A larger lake volume resulted in a new lake base level, a migration of the shore-line and thus the mobility of river mouths. TOC and TC values decreased steeply upwards (Fig. 3), which would reflect a diminished input of organic matter derived from littoral plants. In addition, the maintenance of low values of DC would indicate a low autochthonous primary production. Conditions of low productivity after periods of water infilling have also been reported in other reservoirs, since a non-equilibrium trophic condition, due to the nutrient depletion, would trigger a drop in primary production (Turgeon et al., 2016).
The record of the last part of stage 2 includes the effect of the largest recorded hydroclimatic jump occurred after the mid-1970s, due to a change in the South American Monsoon System’s (SAMS) activity. This event resulted in an increase in precipitation in the Southeast South American (SESA) region (Compagnucci et al., 2002; Piovano et al., 2004, 2009; Pasquini et al., 2006; Garreaud, 2009; Troin et al., 2010). Moreover, many studies reported a direct relationship between the positive phase of El Niño-South Oscillation (ENSO) and the increase of summer precipitation, intensified as of the beginning of 1970s (Camilloni and Barros, 2003; Troin et al., 2016; Guerra et al., 2018). The instrumental record shows the synchronous rise of the total annual precipitation (mean value: 736 mm; 1959-2018 CE) and the annual mean of the SRr’s volume as of the 1970s (Fig. 7a, b).
Stage 3, recorded by facies B, corresponds to conditions during the period from 1978 to 2000 CE. The decrease of MS values (mean value: 40 *10-5 SI) indicates particle settling in a well-developed pelagic zone, while higher values of CD (maximum value: 77 nmol.g LOI-1), pheo a (maximum value: 341 nmol.g LOI-1), chl a (maximum value: 26 nmol.g LOI-1) and pheide a (maximum value: 304 nmol.g LOI-1) reflect an increase in autochthonous primary production in comparison to previous stages, associated with a major development of phytoplankton communities. Regarding the increase of TC (maximum value: 0.8 mg.g LOI-1) during stage 3, it could be attributed to the increase of specific carotenes derived from some phytoplankton groups (e.g., echinone, canthaxanthin, diatoxanthin; Halac et al., 2020). In addition, the synchronic increase of pheide a and TIC would reinforce that higher precipitation of carbonates may be a response to the increment of phytoplankton communities. The presence of dark bands in facies B (28-24 cm/22- 19 cm in Fig. 4) would confirm conditions of high primary production.
In agreement with our results, limnological studies through the decades of 70s and 80s identified a eutrophic state for the SRr and a growth of phytoplankton communities during warm seasons (García de Emiliani, 1977; Gavilan, 1981; Prosperi, 1986). Thus, the autochthonous organic matter increase recorded in sediments might have been caused by external nutrient load increases which would indicate an intensification of the eutrophication process. Considering that the hydroclimate condition was similar to those during Stage 2, the main factor influencing a higher nutrient input to the SRr could be attributed to the population increase in the catchment since ~1960 CE (i.e., due to sewage effluents increase). According to census data, the population of the city of Villa Carlos Paz increased by 300% during the period 1947-1960 CE, and up to 900% from 1960 to 2001 CE (https://www.indec.gob.ar/indec/web/InstitucionalIndec- BibliotecaEnLinea).
In addition, during stage 3, the population increase was probably promoted by changes in water management policies that diminished the “boundary level allowed for urbanization” in the SRr littoral area by -2 m (provincial decree No. 8178; http://agrimensorescordoba.org.ar/documentos/decreto-prov-no-817869-cota-36-38carlos-paz.pdf/). The latter allowed to increase the available area for urbanization around the SRr. Moreover, after the 70s, the temporal population during the tourist season grew to three times the permanent population (Gavilán, 1981; https://biblioteca.indec.gob.ar/bases/ minde/1c1980b5.pdf).
Stage 4 is represented by facies A, and corresponds to the period from 2000 to 2018 CE. This stage can be distinguished by an abrupt and synchronic increase of all organic proxies, which displayed the highest values along the record (e.g. TOC: maximum value: 5.3%, CD: maximum value 149 Ug.g LOI-1, TC: maximum value 1.0 mg.g LOI-1, chl a: maximum value 26 nmol.g LOI-1, pheide a: maximum value 485 nmol.g LOI-1 and TIC: maximum value 3.4%; Figs. 3, 6), reflecting the acceleration of the eutrophication process. According to our results, contemporary SRr monitoring during 2006-2016 CE (Rodríguez and Ruiz, 2016) show that an increase in nutrient concentration in the water column (mainly phosphorus and nitrogen) caused a shift from eutrophic to hypereutrophic conditions during stage 4. As a consequence, frequent events of summer algal blooms led to a condition of deep-water anoxia which promoted the release of nutrients from lake bottom sediments. Therefore, nutrients stored in the sediments of the SRr would represent an important internal supply (Rodríguez and Ruiz, 2016; Halac et al., 2019; Pussetto et al., 2020).
The acceleration of the SRr eutrophication process, reflected both by sedimentary organic proxies and the contemporary monitoring data, is probably a consequence of the marked increase in population in the city of Carlos Paz and throughout the basin during the period 2001-2020 CE (~20% and ~40%, respectively https://www.indec.gob.ar/ indec/web/Nivel4-Tema-2-41-135) and a growth in tourists number (5 times more than the permanent population in January during CE 2010-2017; https://datosestadistica.cba.gov.ar/dataset/sector-turismo).
CONCLUSIONS
The paleolimnological record of the SRr provides a detailed archive of the environmental changes that occurred during the 20th and 21st centuries, mostly governed by changes in land use, water management policies and hydroclimatic influence. The multi-proxy analysis of the paleolimnological record makes it possible to identify four main environmental stages throughout the history of the SRr. The two first stages (from 1911 to 1978 CE) were mainly controlled by natural drivers such as hydroclimatic conditions along with secondary anthropic influence, such as those related to changes in reservoir volume. The last two stages (1978-2018 CE) were mostly controlled by anthropic forcing, associated with the urban development in the catchment.
Stage 1 (1911-1958 CE), recorded by sedimentary facies D, can be considered the environmental base level of the reservoir since the anthropic impact was the lowest of all stages. During this stage, the input of organic matter derived mostly from littoral vegetation, and the low volume of the reservoir favored the accumulation of coarse-grain fluvial sediments. Stage 2 (1958-1978 CE), with dominant pelagic sedimentation, represents a change to a larger reservoir volume after the second dam was built. The low content of organic matter showed low primary production from allochthonous inputs. At the end of the stage, a generalized increase of regional precipitation took place. Stage 3 (1978-2000 CE), is characterized by an increase in the internal primary production, mainly caused by an anthropic input of nutrients due to urban expansion. Consequently, a higher level of eutrophication (eutrophic state) than the previous stages characterizes this period. Stage 4 (2000-2018 CE) corresponds to the highest trophic scenario in the SRr, which has led to a hypereutrophic state. This is mainly associated with the increase in urbanization throughout the catchment, especially in the littoral area of the reservoir.
The environmental reconstruction of the SRr makes it possible to identify multiple types of disturbances over time, including the enlargement of the reservoir’s water volume and the increase of nutrient load due to increased urbanization. In addition, the great hydroclimatic jump after the 70s favored the maintenance of a lacustrine zone and the increase of nutrient input from the catchment. It is therefore likely that anthropic and natural forcing synergistically promoted the generalized degradation of the water quality in the SRr.
Future research should focus on a detailed analysis of the temporal changes in land use throughout the SRr catchment to infer their effects on its water quality and distinguish synergic couplings with natural forcing. Our results can provide tools not only to model future scenarios but also to establish watershed management policies. In the future, climatic changes and population increase will play a determining role in access to drinking water. In South America, an effective land use policy in fluvial catchments should consider the climatic condition and assume measures aimed at mitigating eutrophication (i.e., controlling the nutrient sources by sewage treatments, the deforestation, the soil erosion and fires) along with the application of territorial ordering plans.

