


 Inglés (pdf)
 Articulo en XML
 Referencias del artículo
 Enviar articulo por email
 Citado por SciELO
  Similares en
SciELO
Similares en
SciELO 
 Permalink
I. Introduction
Cerium oxide (ceria or CeO2) based materials have generated extensive interest due to their exceptional electronic, optical, magnetic, and mechanical properties. Ceria is used in a broad array of applications such as catalysts (1,2), photocatalysts, optoelectronics and opto-magnetic devices (3,4). One of the features that renders ceria useful for catalysis is its ability to release or uptake oxygen from its lattice without substantial structural re-arrangement or the loss of its fluorite lattice (5,6). In the fluorite structure, Ce atoms demonstrate a change in oxidation state from Ce4+ to Ce3+ and increase the tendency for redox (7). Nickel-based compounds, on the other hand, are being revealed to have fundamental and technological applications (8-10). It has been reported that the introduction of dopants into ceria can facilitate band gap reduction, which in turn leads to the extension of light absorption into the visible range of electromagnetic radiation. Corma et al. (11) suggested that non-dye-sensitized solar cells with suitable dopant levels may deliver a new group of effective solar cells that, without photosensitization, have photovoltaic behaviour in the visible range. Qi-Ye proposed that, while pure CeO2exhibits a trivial dielectric constant of 4, inserting a small amount of Fe (0.9 at. %) promotes densification and results in a larger dielectric constant of 23. Furthermore, the absorption coefficient of Fe-doped CeO2at frequencies extending from 0.2 to 1.8 THz is less than 0.35 cm−1, suggesting that Fe-doped CeO2is a probable terahertz (THz) optical substance (12). Moreover, Xia et al. (13) have fabricated Mn-modified CeO2 nanorods and reported that the peak of the absorption spectrum of CeO2 shifts from ultraviolet into the region of visible light after Mn insertion. Likewise, photoluminescence spectra analysis of Ni-doped CeO2 films demonstrates that oxygen vacancies are formed upon Ni-doping of CeO2. The shift in the UV peak indicates that Ni-doping can notably tailor the electronic structure and band gap of CeO2. Tiwari et al. (14) reported the synthesis of Ce 1−x Ni x O2 (0 x 0.1) nanopowders. UV-visible analysis suggests a reduction of band gap upon incorporation of Ni atoms into the host lattice. They attributed the decrease in band gap to the augmented disorder caused by defect formations between valance and conduction bands. Another study reported the impact of Mg inclusion on optical performance of CeO2 nanowires. They concluded from the absorption spectra that band gap energy is minimized to 3.00 eV when incorporating Mg ions (15). Fe-doped CeO2 enhanced photocatalytic activity towards the degradation of Methyl Orange (MO) (16). The inclusion of Fe and Ni ions into the crystal lattice of CeO2 nanoparticles significantly reduces the dielectric constant value of the pure CeO2 (17). Literature regarding density functional theory (DFT) has revealed that inclusion of Ni into the CeO2 lattice would improve the catalytic and optical properties of the resulting system (18). Likewise, we have theoretically confirmed that Titanium (Ti) doped ceria promotes a band gap reduction which in turn leads the modified system to be useful in optical and catalytic applications (19). To this end, and motivated by the above-mentioned literature, this contribution demonstrates the theoretical prospect of Ni-substituted CeO2, aiming to gain insight into the electronic, structural, and optical properties of the adapted configurations.
II. Methodology
The computational modeling in this investigation was performed using the Cambridge Serial Total Energy Package (CASTEP) under the frame of density functional theory (DFT) (20). The bare DFT was reported to undervalue the energy of the electronic band gap because of the robust Coulomb interaction between the electrons in the Ce 4f state (21). Therefore, the Hubbard factor (U) has been added to the DFT functional (GGA) in the form of (GGA+U), by which all the simulated findings were computed (22). The DFT+U approach has previously been utilized to investigate thermo- dynamic stability of CoCu2O3 surfaces (23). Additionally, according to the suggested values of the default CASTEP settings, the U values were fixed at 6.0 eV for Ce and 2.5 eV for Ni. Ultrasoft pseudopotentials were utilized to describe the interaction between electrons and ions in reciprocal space with valence electron arrangements of 2s 2 2p 4 for O, 3d 8 4s 2 for Ni, and 4f 1 5s 2 5p 6 5d 1 6s 2 for Ce. To set the Ni-doped concentrations, the substitution systems were built at x = 0.25, and 0.50, suggesting that at x = 0.25, only one Ce atom has been replaced by Ni, whereas for x = 0.50, two vacant Ce atoms are occupied by Ni. In a similar approach, the Ce 1−x Ni x O2 systems correspond to Ni concentrations of x = 0.25 and 0.50, as depicted in Fig. 1. In order to minimize the total energy of Ce 1−x Ni x O2 structures, a cut off energy of 300 eV was set along with a Monkhorst-Pack grid of 3 × 2 × 2 k-points in the Brillouin zone. The energy convergence tolerance was fixed at 5.0 × 10⁻⁶ eV/atom. For the geometry optimization process of the investigated structures, the maximum displacement tolerances, maximum stress, maximum force and energy change were set at 0.001˚A, 0.05 GPa, 0.03 eV/˚A and 1 × 10⁻⁶ eV/atom, respectively. Electronic properties such as total and partial density of states and the Mulliken bond population, as well as optical properties, were directly computed by CASTEP. Lastly, to reproduce the exact electronic band gap energy of CeO2, a scissor operator of 1 eV was applied and employed for all the following optical calculations.
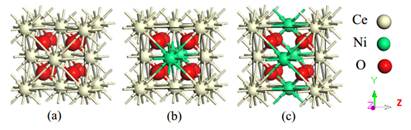
Figure 1 The optimized unit cell structures of Ce 1−x Ni x O2 systems as plotted by VESTA visualization software at (a) x = 0, (b) x = 0.25, (c) x = 0.50. White spheres represent Ce atoms; light green spheres denote Ni atoms, and O atoms are indicated by red spheres.
III. Results and discussion
i. Geometrical relaxation
The relaxed configurations of bare and Ni-doped CeO2 are displayed in Fig. 1. Typically, CeO2 adopts a cubic fluorite-type structure with a space group of (Fm-3m). The number of formula units in the unit cell corresponds to four (i.e. 4 cerium atoms and 8 oxygen atoms). The calculated lattice constants confirmed the experimental amount of a = 5.410 ˚A (24), and these constants, along with the Mulliken population findings of the relaxed structures, are presented in Table 1. The atomic radius of Ce is larger than the atomic radius of Ni, which correspond to 2.7 ˚A and 1.62 ˚A, respectively. Therefore, a reduction in the lattice constants can be observed when Ni contents increase, suggesting a lattice alteration by the insertiion of Ni ions. To assess the stability of the chosen doped matrix along with the difficulty of Ni-doping such a system, the doping formation energy (E f ) has been computed for the systems via the following relationship (25): wherein the parameters k, l and m, refer to the molar fractions of elements Ce, Ni, and O in the alloyed systems.
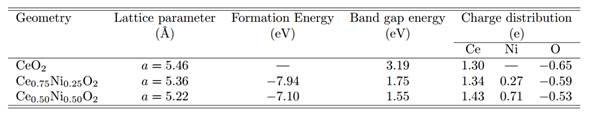
Figure 2 The calculated electron density difference for the studied systems. (a), (b), (c) corresponding to CeO2, Ce 1−x Ni x O2 (x = 0.25), Ce 1−x Ni x O2 (x = 0.50), respectively.

The negative values of doping formation energy depicted in Table 1 indicate that the selected structures are stable and some amount of energy is released with the introduction of Ni atoms into the host system. Regarding the comparison between the current system and the system studied in Ref. (19), both systems are stable since the formation energies reveal negative values. Table 1 reports Mulliken’s charge populations of Ce, O and Ni atoms in the Ce 1−x Ni x O2 system. As the table shows, Ce and Ni atoms in the studied structures tend toward positive charges whereas O atoms are linked to negative charges.
The simulation results of Mulliken’s charge values also indicate a covalent behaviour for the NiCe bond in the designated structures that comprise
Ni and Ce atoms, and ionic properties for Ni-O and Ce-O bonds. Furthermore, the findings show that Ce atoms lose more electrons once Ni is implanted into the host lattice, whereas the increase in O atoms’ electrons is approximately constant as Ni contents increase (26). Figure 2 displays the distribution of the charge density, and the blue colour around the O atoms demonstrates the electron density gain resulted from inserting Ni atoms.
Furthermore, Table 2 demonstrates the calculated interatomic bonds and angles between select atoms of the optimized structures. The findings indicate a reduction in the bonds and angles of the doped systems as compared to the host CeO2 lattice.
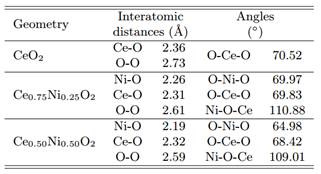
Table 2 The interatomic distances (˚A) and angles (◦) between the selected atoms of the studied systems.
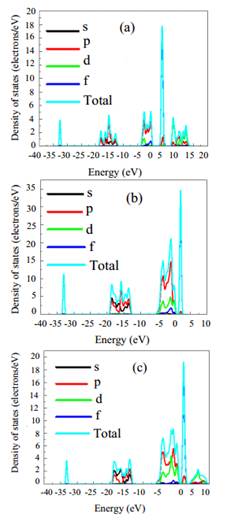
Figure 3 The total density of states (TDOSs) and partial density of states (PDOSs) of Ce 1−x Ni x O2 unit cell versus the energy of electrmagnetic wave at (a) x = 0, (b) x = 0.25, (c) x = 0.50.
ii. Electronic properties analysis
The electronic properties of the Ce 1−x Ni x O2 system can be investigated by studying the density of states (DOSs) of the relaxed geometries. Results of DOSs are plotted and shown in Fig. 3. CeO2 demonstrates non-metallic behaviour, indicating

a semiconducting nature. The Fermi level is situated at zero energy in order to clearly identify the band gap energy. Regarding the bare CeO2 unit cell, the DOSs plotted correspond well with the results of previously published studies (27). The uppermost valance band is extended from -3.7 to 0 eV (Fermi level), while the conduction band is located at 3.19 eV above the Fermi level. This finding signifies the possibility of reproducing the experimentally assessed band gap energy of (28) 3.19 as portrayed in Fig. 3(a). Moreover, Ni-doped ceria at various contents (0.25 and 0.50) involve high intensity states in the conduction and valence bands. On the other hand, band gap energy is minimized to 1.75 eV and 1.55 eV at Ni concentrations of 0.25
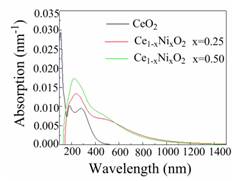
Figure 6 Reflectance spectra of pure CeO2 and Nidoped CeO2 configurations. As Fig. 6 shows, spectra representing Ni-added CeO2 reveal high reflectivity values in the ultra-violet region when compared to the pure ceria reflectivity spectrum. Further, all the spectra demonstrate a moderate trend to reflect incident photons within the visible range (29).
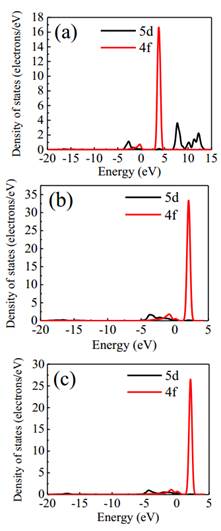
and 0.50, correspondingly, thus demonstrating that Ni integration into ceria would minimize the band gap energy. Figure 4 shows DOS plots of 5d and 4f states of Ce atom in pure and doped Ce 1−x Ni x O2. As seen from the figure, 4f states in the conduction band shift toward the Fermi level as the Ni concentration increases, resulting in a reduction of the electronic band gap.
Furthermore, comparing the Ni 3d states in the
Ce 1−x Ni x O2 (x = 0.25) with (x = 0.50) structures (depicted in Fig.5), it is observed that the Ni 3d states are positioned at the same energy level, signifying that the Ni 3d states would improve with rising Ni contents. Additionally, further reduction in the band gap energy with the introduction of Ni can be possibly ascribed to the accumulation of Ni 3d states in the conduction band, leading to improved photocatalytic and optical performance of Ce1−xNixO2.
iii. Optical properties
The reflectivity of pure and Ni-doped CeO2 in terms of wavelength is shown in Fig. 6. As demonstrated, spectra represented by Ni-added CeO2 reveal high reflectivity values in the ultra-violet region when compared to the reflectivity spectrum of pure ceria. Furthermore, all the spectra demonstrate a moderate trend to reflect incident photons within the visible range (29).
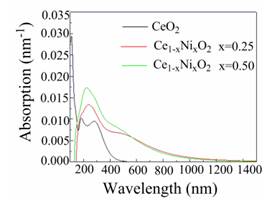
Absorption coefficients specify how far light of a certain energy or wavelength is able to enter a substance before absorption. The absorption spectra of the studied structures are shown in Fig. 7

Figure 8 The real and imaginary components of dielectric function of Ce 1−x Ni x O2 at (a) x = 0; (b) x = 0.25; (c) x = 0.50. Black and red curves represent the real and imaginary parts, respectively.
and demonstrate a semiconductive character because the spectra originate at non-zero values of wavelength.
It is well known that the dielectric function is an important factor related to the absorption and polarization properties of materials. The examined dielectric constant of undoped and Ni-doped CeO2 are depicted in Fig. 8. The non-zero values of the imaginary component of the dielectric constant indicate the process of absorption in that energy region.
IV. Conclusions
The current study demonstrates the influence of Ni addition on the electronic, structural and optical properties of CeO2. The attained outcomes recommend that addition of Ni into ceria would reduce the band gap to 1.75 eV and 1.55 eV at 0.25 and
0.50, respectively. Moreover, Ni-doping introduces 3d states in the conduction band of CeO2. The 3d states have a significant effect on dropping the band gap energy. Furthermore, the absorption spectra of CeO2 is shifted from ultraviolet towards the visible ranges after Ni incorporation. This implies that optical absorption is elongated to a longer wavelength region. Mulliken’s charge distribution displayed an ionic behaviour for Ce-O and Ni-O bonds, whereas Ce-Ni bonds exhibited a covalent behaviour. Results from this study demonstrate that Ni-doped CeO2 is a potential candidate in photocatalytic and optical applications.

