


 Inglés (pdf)
 Articulo en XML
 Referencias del artículo
 Enviar articulo por email
 Citado por SciELO
  Similares en
SciELO
Similares en
SciELO 
 Permalink
INTRODUCTION
Dental ceramic technology has developed significantly over time in response to clinical needs. Feldspathic ceramic crowns were first introduced by Land, and aluminum oxide (A12O3) was added in 1965 by McLean, with the aim of improving ceramic mechanical-physical properties. Since then, the literature records the introduction of numerous metal-free materials and systems 1 .
As techniques for the fabrication of all-ceramic restorations advanced, monolithic restorations were created, i.e., parts made entirely from a single type of ceramic and at the same time. This technique eliminates the need for an overlay or top layer, thereby shortening fabrication time, eliminating problems associated with bonding between layers, and allowing more conservative tooth wear for prosthetic purposes 2 .
Monolithic dental restorations using CAD-CAM technology have become popular due to their excellent mechanical properties and favorable esthetics, without the need for a veneering ceramic. Monolithic restorations can be shaped into final form using CAD-CAM equipment and materials such as zirconia, lithium disilicate ceramics, zirconia-reinforced lithium disilicate, feldspathic ceramics, leucite-based ceramics, and glass/ceramic polymer materials 3 .
The complexity of tooth color does not appear to be achievable with any existing restorative material. Light reaching the surface of the tooth is partially absorbed, making it difficult for hard tooth structures to scatter, transmit or reflect it. Recent research has shown that these physical effects occur as optical phenomena on the surface and within tooth structures, and are strongly influenced by tooth type 4 .
Although color change has been extensively studied in dentistry, there is still no consensus in the literature on acceptable and unacceptable values of AE change. The most usual classification states that AE values below 1 are considered clinically imperceptible and are not perceived by the human eye. Values between 1 and 3.3 are considered clinically acceptable and are perceived only by trained operators, while values above 3.3 are considered clinically unacceptable because they can be perceived by untrained observers 5 .
Ceramic systems offer different opacities and a wide range of colors to suit any clinical situation and act as “biomimetic,” with optical and mechanical properties similar to those of the tissue being replaced. However, these materials must be handled with care, as significant color differences have been observed between the same shades from different lot numbers and between brands with similar color designations, which may affect the esthetic outcome of the final restoration 6 .
When a ceramic restoration is placed, the occlusal adjustment of a crown may roughen the surface, so the restoration must be polished and finished. Many different polishing systems are recommended for ceramic restorations, though it is unclear whether they can all achieve a smooth surface that is the same as or better than the original or untreated surface 7 . The aim of this study was to investigate the effects of chemical and mechanical finishing/polishing (glaze and manual mechanical polishing) and immersion in a coloring substance on the roughness, color stability, and microhardness of CAD-CAM lithium silicate monolithic ceramics: zirconia-reinforced, lithium disilicate-reinforced, and leucite-reinforced. The null hypothesis tested was that there was no effect of the type of ceramic, finishing/polishing type, or immersion substances on the roughness, microhardness or color stability of the materials.
MATERIALS AND METHOD
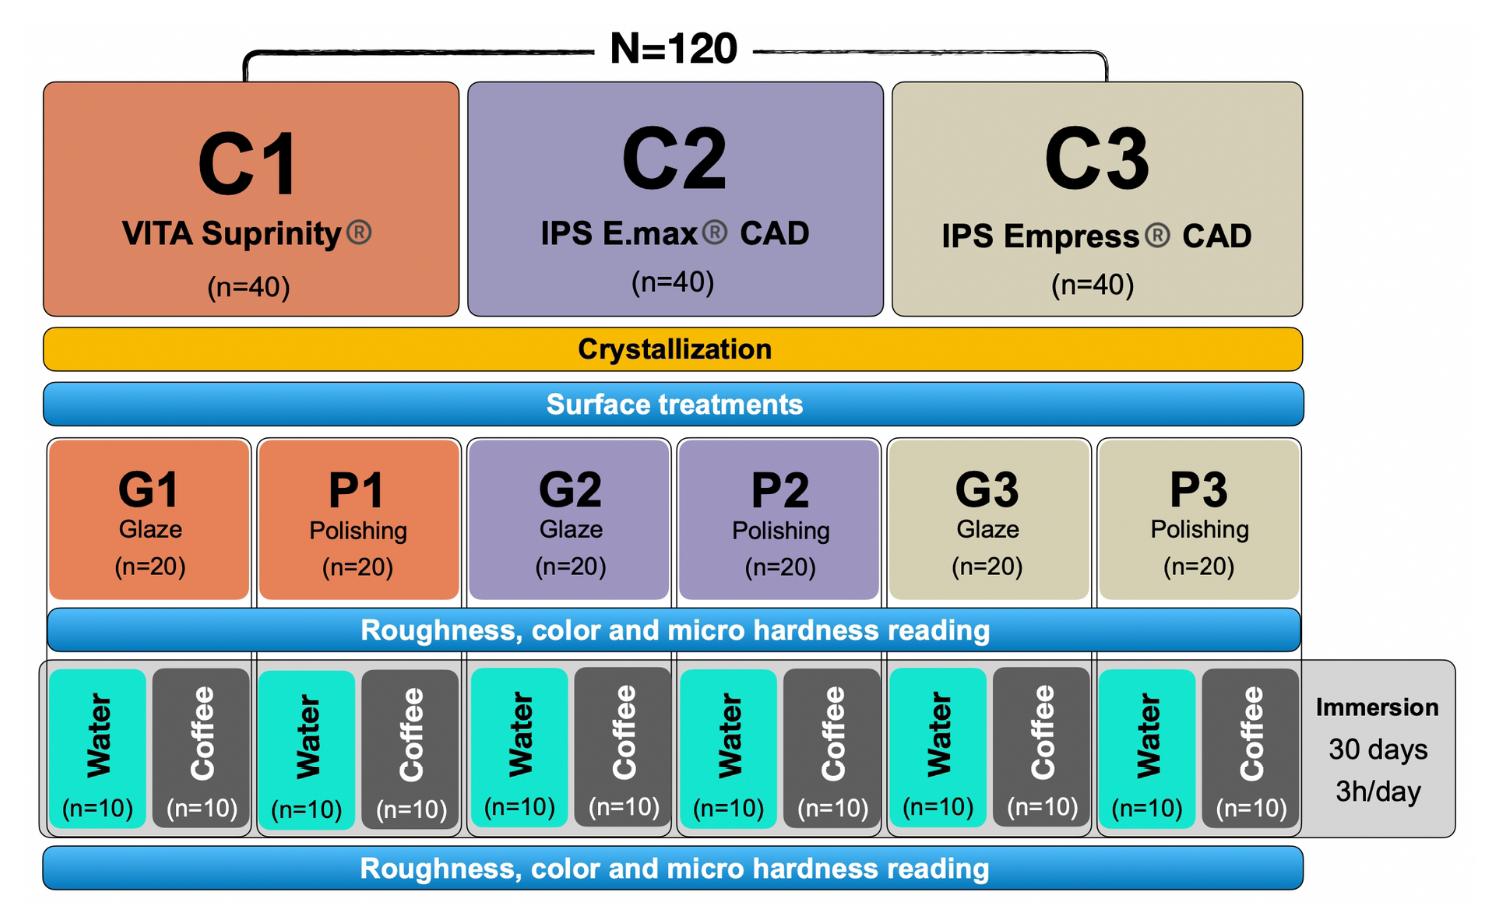
Experimental setup
Experimental units: 120 rectangular plates of ceramic CAD-CAM material (14 mm x 12 mm x 2 mm).
Factors studied:
3-stage ceramic CAD-CAM: (1) lithium disilicate reinforced with zirconium dioxide (SiO2-Li2O-ZrO2) (VITA Suprinity® - Vita Zahnfabrik®), (2) lithium disilicate (Li2Si2O5) (IPS E.max® CAD - Ivoclar Vivadent®) and (3) reinforced with leucite (SiO2-Al2O3-K2O) (IPS Empress® CAD - Ivoclar Vivadent®).
Staining substances in two stages: Coffee and distilled water.
Two surface treatments: (1) Glaze (IPS Ivocolor Glaze Paste - Ivoclar Vivadent® / Akzent Plus Glaze Paste - Vita Zahnfabrik®) and (2) mechanical polishing with sandpaper in three grit levels: 600, 800 and 1200.
Reaction variables - evaluation of surface roughness, color and microhardness (before and after immersion in the staining substance). Figure 1 illustrates the experimental design.
Test specimen preparation
To obtain the ceramic specimens, a high concentration diamond disk (BUEHLER® - IsoMetMT Diamond Wafering Blades 102 x 0.3 mm 15HC) was used in a metallographic cutter (BUEHLER®) to cut the ceramic blocks at a thickness of 2 mm, obtaining rectangular slices with dimensions 14 mm x 12 mm x 2 mm. The slices were placed in the ceramic oven to crystallize, according to the recommendations of the respective manufacturers.
Finishing/Polishing Process
The specimens were subjected to two types of finishing/polishing: In groups G1, G2 and G3 (n=20), a thin layer of glaze was applied according to the recommendations of the manufacturer of the respective ceramic brand. In groups P1, P2 and P3 (n=20), the specimens were mechanically polished in a polishing machine (Aropol 2V - Arotec Ind. e Comércio) with sandpaper (WetordryTM Sandpaper - 3M ESPE®) at three grit levels (600, 800 and 1200) under running water for 60 seconds. They were then cleaned ultrasonically in distilled water for 10 minutes and air dried.
Immersion in staining solutions
The specimens were again divided into two subgroups (n=10) according to the staining substance. Each subgroup was immersed in 200 mL of either a solution of Melitta soluble coffee or distilled water (control), both refreshed daily. During immersion, the containers were sealed with PVC film to prevent evaporation. Immersion time was 3 hours daily at room temperature for a test period of 30 days.
At the end of each immersion period, specimens were washed with distilled water, dried, and stored in plastic bottles with cotton soaked in distilled water and placed in a bacteriological oven at 37°C. Two weeks after the end of immersion, the specimens were tested for surface roughness, color, and microhardness.
Surface roughness
Specimen surface roughness (Ra) was determined after surface treatment and again after immersion in coloring substances, using a roughness meter (SJ-210, Mitutoyo, Kanagawa, Japan). Roughness
valúes were obtained by averaging 3 measurements with a cutoff valúe of 0.25 mm.
Microhardness
Surface microhardness was tested before and after immersion in water and coffee using a microhardness tester (Pantec HVS, Panambra, São Paulo, SP, Brazil) and a Knoop indenter with a load of 50 grams and an application time of 5 seconds. Three impressions were made on the top of each specimen.
Color stability
Specimen color was recorded twice: after surface treatment and after immersion in the staining solutions, using a digital spectrophotometer (VITA Easyshade® - VITA Zahnfabrik), following the manufacturer’s instructions. Color was evaluated based on the difference of the CIELab parameters (ΔL, Δa, Δb), AE00 and ΔWID; according to the following formulas: AE00 = V(ΔL’/kLSL)2 + (ΔC’/ kCSC)2 + (ΔH’/kHSH)2 + RT (ΔC’/kCSC) (ΔH’/ (kHSh).
In the AE00 formula, ΔL* represents the variation in the L* coordinate, which indicates brightness (black-white axis); AC represents differences in saturation (chroma); AH represents differences in hue; and RT is a function that accounts for the interaction between chroma and hue differences in the blue region of the spectrum. The valúes of AE00 are calculated sequentially following Sharma et al. 8 . In addition to the above formulas, the variation between the time points and the initial values of the CIEL*a*b* coordinates are calculated by the whiteness index in dentistry (ΔWID) considering the linear formula (WID) at each time point studied: WID = 0.511L* -2.324a* -1.100b*.
Statistical analysis
The SPSS 23 program (SPSS Inc., Chicago, IL, USA) was used for the statistical calculations, and the significance level was set at 5%. The data for roughness, microhardness, and color parameters L, a, and b, obtained in the first phase of the experiment, when the ceramics had been subjected to surface treatment, were subjected to two-way ANOVA. These were also used after the glazed or polished ceramics had been immersed in distilled water or coffee. The mean differences between the values measured in the second and first stages were presented descriptively. The ΔE2000- and ΔWID-data were subjected to a three-way repeated measure ANOVA. Multiple comparisons were performed using Tukey tests.
RESULTS
The results were ordered according to the analyses performed: 1) in the first phase of the experiment, when the ceramics were subjected to surface treatment; 2) in the second phase of the study, after the glazed or polished ceramics were immersed in distilled water or in coffee; 3) for ΔE2000 and ΔWID.
First stage: ceramics subjected to surface treatment
The two-way analysis of variance applied to the first stage of the experiment showed statistically significant interaction between the ceramics and the surface treatments in terms of roughness, microhardness, and color parameters ‘a’ and ‘b’ (p < 0.001). For the color L parameter, there was no interaction between ceramics and surface treatments (p = 0.318), but a significant difference was observed between ceramics and between surface treatments (p < 0.001).
Roughness
For each of the ceramics tested, smoothness was significantly higher when polished than when glazed. During polishing, Suprinity and Empress ceramics, which did not differ from each other, were significantly less rough than E.max. After glazing, Empress ceramics had an average roughness significantly different from Suprinity and E.max, which were the least and most rough, respectively (Table 1).
Table 1 Means and standard deviations of roughness, microhardness and color parameters L, a and b, according to the ceramic and its surface treatment and these groups after immersion in coffee and distilled water.
|
First stage of the experiment: ceramics subjected to surface treatments (glazing or polishing) | ||||||||||||
|---|---|---|---|---|---|---|---|---|---|---|---|---|
|
Ceramic |
Roughness (μm) |
Microhardness (kg/mm2) |
Color 'L' parameter |
Color 'a' parameter |
Color 'b' parameter |
|||||||
|
Glazing |
Polishing |
Glazing |
Polishing |
Glazing |
Polishing |
Average |
Glazing |
Polishing |
Glazing |
Polishing |
||
|
E.max CAD |
0,603 Cb (0,170) |
0,144 Ba (0,145) |
511 Ba (79) |
505 Ba (84) |
87,9 (1,2) |
90,0 (1,6) |
89,0 B (1,7) |
1,2 Aa (0,4) |
1,0 Ba (0,1) |
23,6 Aa (1,6) |
24,5 Ba (0,8) |
|
|
Empress CAD |
0,462 Bb (0,129) |
0,075 Aa (0,028) |
462 Ab (60) |
372 Aa (58) |
88,6 (1,0) |
91,5 (0,9) |
90,0 B (1,7) |
1,1 Ab (0,3) |
0,4 Aa (0,1) |
23,3 Ab (1,5) |
21,6 Aa (0,9) |
|
|
Suprinity |
0,148 Ab (0,083) |
0,054 Aa (0,046) |
547 Ca (45) |
616 Cb (33) |
82,1 (7,6) |
86,4 (1,5) |
84,2 A (5,8) |
8,9 Bb (4,2) |
0,2 Aa (0,4) |
47,7 Bb (14,3) |
23,6 ABa (2,4) |
|
|
Overall average |
⎯ |
⎯ |
⎯ |
⎯ |
86,2 a (5,3) |
89,3 b (2,5) |
⎯ |
⎯ |
⎯ |
⎯ |
⎯ |
|
|
Second stage of the experiment: groups formed by ceramics with treated surface and submitted to immersion in distilled water or coffee | ||||||||||||
|---|---|---|---|---|---|---|---|---|---|---|---|---|
|
Ceramic and treatment |
Roughness (μm) |
Microhardness (kg/mm2) |
Color 'L' parameter |
Color 'a' parameter |
Color 'b' parameter |
|||||||
|
Water |
Coffee |
Water |
Coffee |
Water |
Coffee |
Water |
Coffee |
Water |
Coffee |
|||
|
E.max CAD glazing |
0,563 Da (0,130) |
0,715 Db (0,250) |
483 Ca (66) |
538 Db (52) |
87,3 Aa (1,4) |
88,4 ABa (1,0) |
1,1 Ba (0,4) |
1,1 Ba (0,4) |
23,5 Aa (1,9) |
23,8 ABa (1,9) |
||
|
E.max CAD polishing |
0,174 Ba (0,200) |
0,148 Ba (0,132) |
476 Ca (51) |
529 Db (37) |
90,1 Ba (1,9) |
89,2 Ba (0,7) |
1,2 Ba (0,1) |
1,1 Ba (0,2) |
24,9 Aa (0,9) |
27,4 Ba (9,8) |
||
|
Empress CAD glazing |
0,409 Ca (0,125) |
0,603 Cb (0,108) |
440 Ba (80) |
505 Cb (63) |
88,5 Aa (0,8) |
88,1 ABa (1,3) |
1,2 Ba (1,0) |
1,1 Ba (0,4) |
22,2 Aa (1,4) |
23,6 ABa (1,8) |
||
|
Empress CAD polishing |
0,078 Aa (0,071) |
0,074 Aa (0,048) |
377 Aa (29) |
411 Ab (86) |
92,0 Ba (1,0) |
91,1 Ba (0,8) |
0,5 Aa (0,1) |
0,5 Aa (0,1) |
22,0 Aa (0,6) |
21,7 Aa (0,3) |
||
|
Suprinity glaze |
0,181 Ba (0,074) |
0,176 Ba (0,101) |
512 Da (49) |
494 Ca (75) |
96,0 Cb (9,3) |
86,2 Aa (9,9) |
2,4 Ca (4,0) |
7,6 Cb (4,9) |
24,0 Aa (12,6) |
42,6 Cb (16,5) |
||
|
Suprinity polida |
0,052 Aa (0,039) |
0,048 Aa (0,026) |
575 Eb (20) |
447 Ba (25) |
86,0 Aa (0,8) |
86,4 Aa (2,0) |
0,2 Aa (0,3) |
0,5 Aa (0,5) |
24,5 Aa (1,2) |
23,8 ABa (3,3) |
||
Microhardness
For E.max ceramic, microhardness did not differ significantly between glazed and polished surfaces. For Empress ceramic, microhardness was significantly higher for glazed surface, while for Suprinity ceramic, it was significantly higher for polished surface (Table 1).
Color ‘L’ parameters
Significantly higher values were found when polished, regardless of the ceramic used. Regardless of whether the specimens were glazed or polished, the highest L valúes were found for the E.max and Empress ceramics, with no significant difference between the two (Table 1).
Color ‘a’ parameters
No difference was found between specimens of E.max ceramics that were glazed or polished, while in the other ceramics, the values of ‘a’ were significantly higher when glaze was applied. No statistically significant difference was found between glazed E.max and Empress, but they both had significantly lower ‘a’ values than Suprinity. After polishing, the ‘a’ parameter was significantly higher in E.max ceramics, with no significant difference between the other two ceramics (Table 1).
Color ‘b’ parameters
The results are identical to those found for the ‘a’ parameter. The only difference was that the Suprinity ceramic did not differ significantly from Empress when polished (Table 1).
Second stage: after immersing the glazed or polished ceramics in distilled water or coffee
Two-way analysis of variance showed that there was a statistically significant interaction for roughness data (p = 0.017), microhardness, and parameters L, a, and b (p < 0,001). There was a statistically significant interaction between the surface-treated ceramics and the immersion factor in staining solution.
Roughness
After immersion in coffee or distilled water, there was no significant change in surface roughness of the polished specimens or the glazed Suprinity specimens. However, surface roughness of the glazed E.max and Empress specimens increased in coffee.
After immersion in water, glazed E.max had significantly higher surface roughness than Empress specimens, which in turn were rougher than polished E.max and glazed Suprinity. Polished E.max and glazed Suprinity did not differ from each other, but were rougher than polished Empress and Suprinity, which had the lowest roughness values.
After immersion in coffee, the results for the glazed or polished ceramics were identical to those described for immersion in distilled water (Table 1).
Microhardness
Except for the glazed and polished Suprinity ceramics, which showed no significant difference when immersed in coffee or water and showed significantly lower microhardness when immersed in coffee, microhardness was significantly lower for all other combinations of ceramics and surface treatment after immersion in distilled water.
After immersion in water, polished Suprinity had significantly higher microhardness than glazed Suprinity. It was followed by E.max (both polished and glazed, which did not differ significantly from each other). E.max in turn had significantly higher microhardness than the glazed Empress, while polished Empress had the lowest values under all conditions.
After immersion in coffee, polished and glazed E.max, which did not differ significantly from each other, had higher microhardness than glazed Empress and Suprinity, which also did not differ from each other. Polished Suprinity and Empress had the lowest microhardness values (Table 1).
L Parameters
The values of parameter L of the specimens immersed in water or coffee did not differ significantly for any combination of ceramics and surface treatment, except for glazed Suprinity, which showed a significantly lower L value after immersion in coffee.
After immersion in water, glazed Suprinity ceramic had a significantly higher L-value than the polished E.max and Empress ceramics (with no significant difference between the two), and these had higher values than glazed E.max, glazed Empress and polished Suprinity.
After immersion in coffee, polished and glazed Empress and E.max, which did not differ from each other, had significantly higher L values than both glazed and polished Suprinity, while glazed E.max and Empress had medium values of the color L parameter (Table 1).
Color ‘a’ parameters
The only ceramic whose ‘a’ color parameter was significantly affected by coffee was glazed Suprinity. After both water immersion and coffee immersion, this was the group that had the highest ‘a’ value, followed by E.max (both glazed and polished) and glazed Empress (with no significant difference between these three groups). The lowest value of a was measured in the polished Suprinity group (Table 1).
Color ‘b’ parameters
Coffee only increased the value of parameter ‘b’ significantly in glazed Suprinity.
After immersion in distilled water, there was no significant difference among the various ceramic and surface treatment combinations.
After immersion in coffee, the highest ‘b’ value was found for glazed Suprinity, followed by polished E.max, which was in turn higher than polished Empress. After immersion in coffee, glazed E.max, glazed Empress and polished Suprinity did not differ significantly from each other or from any of the other groups (Table 1).
ΔE2000 and ΔWID
The three-way repeated measure ANOVA found no significant interaction among the factors studied (ceramic, surface treatment, and staining solution) for either the ΔE2000 (p = 0.268) or the ΔWID (p = 0.495) data. The dual interactions between ceramics and surface treatment (ΔE2000: p = 0.127; ΔWID: p = 0.633) and between surface treatment and staining solution (ΔE2000: p = 0.083; ΔWID: p = 0.838) were not significant. The interaction between ceramic and surface treatment was statistically significant for the ΔE2000 and ΔWID data (p < 0.001) (Table 2). Breaking down the interaction between ceramics and surface treatment for the ΔE2000 data, no difference was found between glazed and polished E.max or Empress, but for Suprinity, delta values were significantly higher for glazed. While the polished ceramics did not difer significantly from each other, glazed ceramics differed significantly, with Suprinity having significantly higher values than the other materials, between which no significant difference was found (Fig. 2).
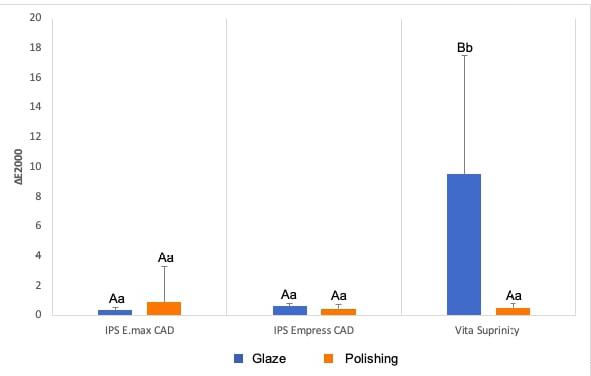
Fig. 2 Column diagram of the average values of ΔE2000, according to the ceramic and its surface treatment, regardless of immersion in water and coffee. Caption: Blue columns indicated with distinct capital letters indicate a significant difference between ceramics that received glaze. Red columns indicated with equal capital letters indicate no significant difference between polished ceramics. Columns with equal lowercase letters indicate no significant difference between glazed and polished samples, considering each ceramic separately.
For the ΔWID data, the comparisons between the ceramics gave the same results as for ΔE2000. Analysis of the effects of glazing and polishing on the individual ceramics showed that the only difference from the ΔE2000 data was that polished E.max resulted in greater changes (Fig. 3). Immersion in water or coffee had no effect on ΔE2000 values [p = 0.378; water immersion: 2.33 (5.15); coffee: 1.79 (4.29)], or on ΔWID [p = 0.363; water immersion: 5.53 (18.92); coffee: 3.09 (17.29)], regardless of the ceramic and surface treatment.
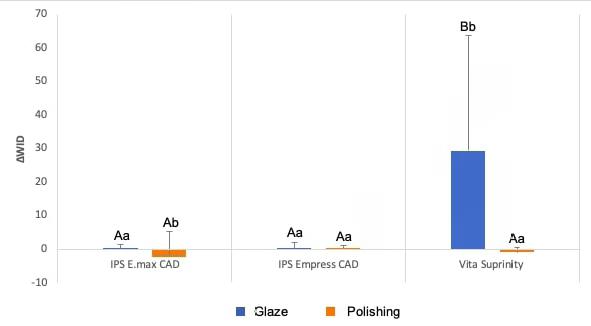
Fig. 3 Column diagram of the average values of ΔWID, according to the ceramic and its surface treatment, regardless of immersion in water and coffee. Caption: Blue columns indicated with distinct capital letters indicate a significant difference between ceramics that received glaze. Red columns indicated with equal capital letters indicate no significant difference between polished ceramics. Columns with distinct lowercase letters indicate a significant difference between glazed and polished samples, considering each ceramic separately.
Table 2 Means and standard deviations of the ΔE2000 and ÁWID parameters, according to the ceramic, its surface treatment and immersion in water and coffee.
|
Response variable |
Ceramic |
Glaze |
Polishing |
||
|---|---|---|---|---|---|
|
Water |
Coffee |
Water |
Coffee |
||
|
∆E2000 |
E.max CAD |
0,40 (0,17) |
0,33 (0,23) |
0,31 (0,21) |
1,47 (3,4) |
|
Empress CAD |
0,64 (0,81) |
0,62 (0,20) |
0,33 (0,20) |
0,60 (0,26) |
|
|
Suprinity |
11,89 (7,18) |
7,13 (8,38) |
0,45 (0,27) |
0,61 (0,35) |
|
|
∆WID |
E.max CAD |
-0,77 (0,78) |
0,81 (0,89) |
-0,68 (0,73) |
-3,75 (10,72) |
|
Empress CAD |
-0,04 (2,56) |
0,46 (0,99) |
0,22 (0,80) |
-1,31 (1,04) |
|
|
Suprinity |
34,87 (34,49) |
23,83 (35,40) |
-0,42 (1,06) |
-1,49 (1,47) |
|
DISCUSSION
Surface roughness plays a critical role in preventing extrinsic discoloration 9 . The roughness data from this study showed that smoothness was significantly greater for polished than for glazed ceramics in all three cases (before and after immersion in solutions), although in another study, polishing was found to produce rough surfaces while glazing produced a smoother surface 10 . The difference may be attributed to different specimen preparation techniques, polishing techniques 11 , materials 12 or Ra machine used 13 . The surface roughness of polished specimens did not differ after immersion in coffee or water. Sandpaper with different grits was used for polishing in this study. A final mirror polish after milling or setting is essential to ensure smooth surfaces (< 0,2 pm) with optimal clinical performance. The E.max specimen surface roughness was below this value after each polishing application 14 . Polishing in the office is as effective as polishing in the laboratory 11 .
After immersion in distilled water, microhardness was lower for all polishing and ceramic combinations. Suprinity showed lower microhardness with coffee and glaze. Empress microhardness was higher with glaze. E.max showed no difference between glaze and polish. Suprinity consists mainly of ZrO2 (zirconia) 8-12 wt%, SiO2 (silica) 56-64 wt%, Li2O (lithium oxide) 15-21 wt%, and La2O3 (lanthanum oxide) 0.1 wt%. According to the manufacturer, the composition of E.max consists mainly of SiO2, Li2O, P2O5, ZrO2, ZnO, K2O and Al2O3, as well as additional dye ions, which are combined using glass technology through a pressure casting process (Vivadent Ivoclar). The partially crystallized blocks used for milling in E.max consist of 40% lithium metasilicate crystals (Li2SiO3), with sizes of 0.2 and 1.0 mm and platelet format, fixed in the glass phase together with disilicate cores of lithium (Vivadent Ivoclar). Therefore, the differences in ceramic materials can be attributed to the type and size of the crystalline phase (lithium silicate vs. lithium disilicate) or additional ZrO2 particles. Polishing increased the L-value regardless of the material because color stability is affected by the surface structure of the material. The higher L-value could be related to surface irregularities 12 . The discoloration caused by coffee can be attributed to the penetration of the yellow coffee dye into the microstructure of the materials. E.max and Empress achieved the highest L values, regardless of whether they were polished or glazed.
Distilled water and coffee affected the surface hardness of the materials studied, which may have increased their susceptibility to staining 15 . Fahmy et al. 16 reported a significant increase in the hardness values of a ceramic material after storage in saliva for 3 weeks. This increase in microhardness was related to ion exchange through the Si- OH layer reportedly formed on the ceramic surface 16 .
After immersion in water or coffee, the ceramics, whether polished or glazed, showed no difference in the value of L. Glazed Suprinity had the lowest value of ‘a’ and L after immersion in coffee and the highest value of L after immersion in water. Immersion in coffee also increased the values of ‘a’ and ‘b’ for glazed Suprinity. Due to their low polarity, coffee dyes tend to soak into the ceramic 17 . Increases in ‘a’ and ‘b’ and a decrease in ‘L’ always occurred in the presence of glaze. The type of soaking solution can affect the extent of color change. In the present study, a coffee solution was used as the colorant. Odioso et al. 18 reported that coffee/tea consumption was one of the factors that significantly affected ‘b’ and ‘L’ values. People who drank coffee or tea daily had an average increase of 1.2 units in ‘b’ and a decrease of 1.5 units in L. The average time to drink a cup of coffee is 15 minutes, and for coffee drinkers, average coffee intake is 3.2 cups per day 17 . Therefore, 48 hours of storage simulated coffee consumption for 2 months 19 . It was postulated that 24 hours of immersion in vitro is approximately equivalent to one month in vivo 19 . Therefore, three hours per day of immersion for 30 days is equivalent to 90 days of clinical immersion.
The ΔE2000 and ΔWID data confirm that the presence of glaze on all ceramics resulted in higher delta values. Glazed Suprinity exhibited the highest values. Kilinc & Turgut 20 reported that manual polishing techniques can achieve similar results to glazing in terms of color stability, which contrasts with Yilmaz et al. 21 , who found that glazed preparations had better color stability, although the observed color was not clinically noticeable in the polished preparations. Suprinity and E.max ceramics treated with different surface treatment procedures (glazing or polishing) showed significant and clinically acceptable differences in color changes after coffee thermal cycling 22 . Kilinc and Turgut 20 also reported clinically acceptable color changes in glass-ceramics, regardless of the type of surface treatment (control, manual polishing, or glazing). They reported that polishing and glazing produced similar results in terms of roughness 23 .
Sarac et al. 24 investigated the effects of polishing systems on the color and surface texture of ceramics, finding significant differences between polishing techniques in terms of color differences, with AE values ranging from 1.03 to 3.36. Glazed specimens showed better color stability; on the other hand, the discoloration observed in polished specimens was not clinically noticeable 12 .
To conclude, mechanical polishing performed better in terms of roughness, surface microhardness, and color retention of the ceramics studied compared to glazing. Zirconia-based ceramics generally showed more homogeneous results in terms ofmicrohardness and roughness when manual polishing and glazing were considered.

