


 Inglés (pdf)
 Articulo en XML
 Referencias del artículo
 Enviar articulo por email
 Citado por SciELO
  Similares en
SciELO
Similares en
SciELO  uBio
uBio 
 Permalink
INTRODUCTION
Gymnocalycium (subfamily Cactoideae) is a genus endemic to southern South America and comprises about 50 species, most of them with a narrow geographical distribution (Charles, 2009). In Argentina, it is the Cactaceae genus with the highest number of species (41), representing 18% of the total richness of the subfamily in the country (Kiesling et al., 2008). Gymnocalycium is divided into subgenera based on the characteristics of seeds, floral anatomy and fruits (Schütz, 1986; Demaio et al., 2011). G. quehlianum (subgenus Trichomosemineum) is endemic to Córdoba province (Argentina) and is distributed along the Sierra Chica up to the Sierra Norte (Figure 1). It is abundant in mountain environments between 500 and 1200 m a.s.l. (Charles, 2009; Gurvich et al., 2014). It has depressed grayish green conical stems, ribs consisting of a hump with small radial spines, and white flowers with a reddish throat (Charles, 2009, Kiesling and Ferrari, 2009)

Figure 1 Location of the four collection sites (altitudinal provenances: 615, 744, 948, 1257 m a.s.l.) of G. quehlianum along an altitudinal gradient in Córdoba Mountains (Córdoba province, Argentina). Map obtained with DIVA-GIS 2 (Hijmans et al. 2002).
The altitudinal gradient is the main factor that influences vegetation patterns in mountain environments. As altitude increases, temperature decreases and solar radiation becomes more intense. However, the effects of precipitation are variable, depending on the different mountain ranges (Körner, 2007). These environmental changes condition the presence of different species along the gradient (Cabido et al., 2010), although many species have wide distribution ranges (Knight and Ackerly, 2002, Bauk et al., 2015). Climate change will lead to changes in distribution range of many species and, therefore, to the loss of genetic diversity within each species. When addressing the impacts of climate change on biological diversity, each species is considered as one unit in most studies, neglecting intraspecific genetic variations (Thuiller et al., 2008). Maintaining genetic diversity within a species is crucial for adaptation in the short- and long-term (Jump et al., 2009).
Genome size and ploidy level, two important variables that determine genetic diversity, have been related to ecological characteristics (Knight and Ackerly, 2002; Ramsey and Ramsey, 2014). Genome size (C-value) is a feature that may change between populations, varying between 0.05 and 127.4 pg in Angiosperms; however, this variation is not necessarily related to ploidy level (Bennett and Leitch, 2005). Genome size has been related to different features, such as minimum cell generation time, life history, plant phenology, and some important parameters for plant breeders, such as frost resistance, biomass production, ecological adaptations, cellular cycle time, and DNA synthesis, all of which could affect plant growth rate (Ohri, 1998; Burton and Husband, 2001). Some genetic traits, like DNA content and ploidy level, may vary along environmental gradients (Knight and Ackerly, 2002). Numerous studies have related C-value changes to morphological characters, habitat and distribution (Bennett, 1976; Knight and Ackerly, 2002; Bennett and Leitch, 2005; Slovák et al., 2009). However, the functional significance of this variation and the mechanisms of these changes are diverse. When comparing species, Knight and Ackerly (2002) found that those having a higher 2C content were more frequent at intermediate latitudes and altitudes. Cx values, representing the DNA content of one non-replicated monoploid genome with the chromosome number x (Greilhuber et al. 2005) There are few cacti examined to date, presenting a range of Cx- values from 1.53 to 8.94 pg (Palomino et al., 1999; Zonneveld et al., 2005; Del Angel et al., 2006; Negron-Ortiz, 2007; Las Peñas et al., 2014, 2017; Bauk et al., 2016).
Eupolyploidy refers to the possession of three or more complete sets of chromosomes representing the haploid genome (Ramsey and Schemske, 1998; Soltis et al., 2003). Ploidy level has played significant roles in diversification and speciation processes in flowering plants (Stebbins, 1971; Grant, 1981; Leitch and Bennett, 1997; Levin, 2002; Coghlan et al., 2005; Leitch and Leitch, 2008; Soltis et al., 2009; Soto-Trejo et al., 2013). Chromosome counts have been performed only in a few of the 1,400 species of Cactaceae (of which 26.2% are diploid, 13.4% are both diploid and polyploid, and 60.4% are polyploid), confirming that the frequency of genome duplication in the group is far more common than diploidy (Pinkava, 2002; Las Peñas et al., 2019).
The cytogenetic data available for G. quehlianum indicate that it is diploid (2n=22) and its DNA content is 2C=6.46 pg (Das and Das, 1998). Ploidy level is an important characteristic that may be affecting speciation and patterns of species diversity. Chromosome number of a species may vary with altitude (Grant, 1981; Levin, 2002; Morales Nieto et al., 2007). The main aim of this work was to explore possible relationships between altitudinal range, cytogenetic characteristics, and DNA content in G. quehlianum.
MATERIALS AND METHODS
Species and study area
Gymnocalycium quehlianum occurs in rocky outcrops from 600 to 1200 m a.s.l. (Demaio et al., 2011; Gurvich et al., 2014). We studied four populations from Córdo ba (Argentina) located along an altitudinal gradient be tween the localities of San Marcos Sierra (31° 28´ S, 64° 34 W) and Camino del Cuadrado (31° 41´ S, 64° 50´ W), at 615, 744, 948, and 1257, m a.s.l. (Figure 1). Vegetation varies from subtropical dry forest to temperate grass lands at the extreme sites (Giorgis et al., 2011).
Collection data of the studied populations are presented in Table 1. Voucher specimens were deposited in the herbarium of the Museo Botánico de Córdoba (CORD). Living plants were placed in earthenware pots in an equal part mixture of sand and potting soil in the Experimental Garden of Museo Botánico (Córdoba, Argentina) to obtain adventitious roots.
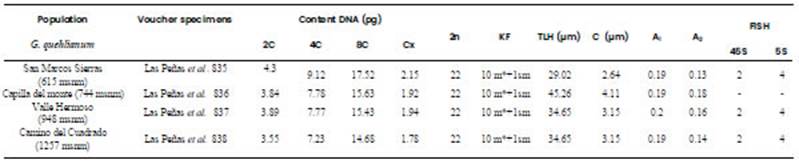
Table 1 Content DNA and cytogenetic characteristic in four populations of G. quehlianum. Voucher data (all from Argentina, Córdoba province), 2C (diploid DNA amount), Cx (basic DNA amount), 2n (somatic chromosome number), FK (karyotype formulae), TLH (mean total haploid chromosome length), C (mean chromosome length), A1, (intrachromosomal asymmetry index), A2 (interchromosomal asymmetry index), FISH (fluorescent in situ hybridization, 45S: number of rDNA 18-5.8-26S loci, 5S: number of rDNA 5S loci).
Nuclear DNA content analyses
The amount of DNA was measured by flow cytometry in three individuals per population and three runs per individual. DNA content was measured by obtaining nuclear suspensions, according to Dolezěl et al., (2007), with minor modifications. Small pieces of fresh leaves from each sample individual and from Zea mays L. CE-777 (2C = 5.43 pg), which was used as internal standard, were co-chopped with a sharp razor blade in a glass petri dish containing 0.5 ml of Otto I solution (0.1 M citric acid 0.5% Tween 20) and 0.2 ml of 5 % PVP (PVP 40, Sigma-Aldrich). Nuclear suspensions were then filtered through a 45μm mesh nylon membrane and maintained at room temperature for 10-60 min. After that, 0.5 mL of Otto II buffer (0.4 M Na2HPO4_12 H2O), propidium iodide (50 μg mL-1), and RNAse (50 μg mL-1) were added to stain DNA and avoid the labeling of double stranded RNA. Samples were kept at room temperature and analyzed after 10 min in a Bd Accuri™ C6 Flow Cytometer equipped with a 488 nm and a 633 nm Laser. Three DNA estimations were made for each plant (5,000 or 10,000 nuclei per analysis) on three days. Nuclear DNA content was calculated as (Sample peak mean/Standard peak mean) *2C DNA content of the standard (in pg). Cx values, were calculated as the 2C nuclear DNA amount divided by ploidy level (Greihuber et al., 2005).
1.1. Cytogenetic analyses
Metaphase chromosomes were prepared from adventitious root tips pretreated with 2 mM 8−hydroxyquinoline for 24 h at 4°C and fixed in 3:1 ethanol:acetic acid. For slide preparation, root tips were washed twice in distilled water (10 min each), digested with a pectinex solution for 45 min at 37°C, and squashed in a drop of 45% acetic acid. The coverslip was removed in liquid nitrogen and then the slides were stored at -20°C.
Karyotype analysis. Slide preparations were stained with Giemsa and permanent mounts were made with Entellan© (Merck, Germany). Ten metaphases of dif ferent individuals per population were photographed with a phase contrast optic Olympus BX61 with software Cytovision® (Leica Biosystems) and camera JAI® mod el CV-M4+ CL monochromatic. The following measure ments were taken: length of the short arm (s) and long arm (l), and total chromosome length (c) for each pair. The arm ratio (r = l/s) was calculated and used to clas sify chromosomes and determine homologs, according to Levan et al., (1964). Karyograms were constructed by organizing the chromosomes into groups according to their arm ratio and ordering them by decreasing length within each category. The resulting idiograms were based on the mean values obtained from the measure ments of all individuals of each population. Karyotype asymmetry was estimated using the intrachromosomal (A1 = 1 - [P(b/B)/n]) and interchromosomal (A2 = s/x) indices of Romero Zarco (1986), where b and B are the mean length of short and long arms of each pair of ho mologues, respectively, n is the number of homologues, s is the standard deviation, and x the mean chromosome length.
Chromosome banding. Slides for fluorescent banding were stained with a drop of 0.5 mg/ml Chromomycin A3 (CMA) in McIlvaine’s buffer, pH 7.0, and distilled water (1:1) containing 2.5 mM MgCl for 90 min, subsequently stained with 2 μg/ml 4′-6-diamidino-2-phenylindole (DAPI) (both Sigma-Aldrich, Austria) for 30 min, and finally mounted in McIlvaine’s buffer-glycerol v/v 1:1 (Schweizer, 1976; Schweizer and Ambros, 1994). The relative lengths of short and long chromosome arms (data not shown) and bands were calculated (consid ering haploid karyotype length = 100%) in five meta phases per population, each from a different individual. The amount of heterochromatin was expressed as per centage of the total length of the haploid karyotype.
Fluorescent in situ hybridization (FISH). The proto col of Schwarzacher and Heslop-Harrison (2000) was used with the pTa71 probe to identify the 18S−5.8S−26S rDNA loci (Gerlach and Bedbrook, 1979) labeled with bi otin-14-dUTP by nick translation (Bionick, Invitrogen) and subsequently detected with avidin-FITC (Sigma). For analysis of the 5S rDNA loci, a specific probe from Pereskia aculeata was used (Las Peñas et al., 2011). These fragments were labeled with Digoxigenin-11-dUTP (DIG Nick translation mix, Roche) and detected with Anti-DIG-Rhodamine (Roche, USA). The slides were mounted with Vectashield antifade (Vector Laboratories) con taining DAPI.
1.2. Statistical analyses
The analysis of variance or its nonparametric equivalent Kruskall Wallis was used for the analysis of DNA content and cytogenetic variables, followed by a comparison of means (Tukey, p <0.05). The analyses were performed using the INFOSTAT statistical package (Di Rienzo et al., 2012).
RESULTS
Genome size of G. quehlianum varied between 3.55 pg and 4.30 pg in the four populations, with no significant differences (p = 0.11) among them (Table 1). However, a trend of DNA content decrease with increasing altitude was observed. In addition, endopolyploidy with peaks for 4C and 8C (Table 1) was observed in all the analyzed populations.
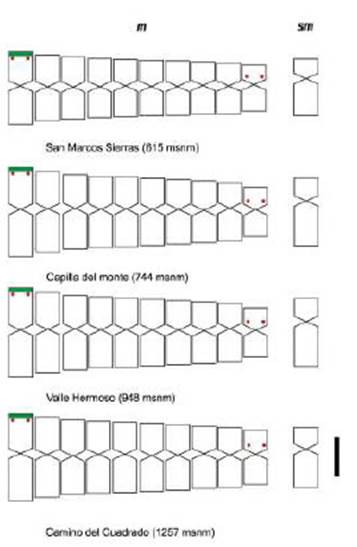
Regarding the cytogenetic characteristics, all the populations presented 2n = 22 (Table 1; Figure 2). No differences were found in the 10 m and 1 sm karyotype formula; the first m pair had a terminal satellite on the short arms, which was detected in 75% of the examined cells (Figure 2).
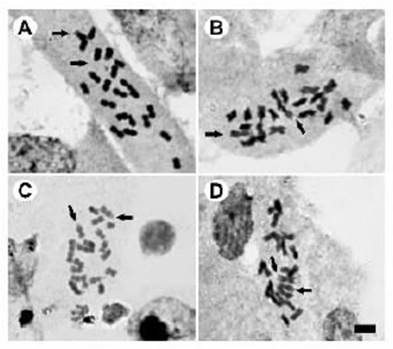
Figure 2 Somatic metaphases of G. quehlianum with Giemsa staining. A San Marcos Sierra (615 m a.s.l), B Capilla del monte Km 101 (744 m a.s.l), C Valle Hermoso (948 m a.s.l), D Camino del Cuadrado (1257 m a.s.l). Arrows indicate satellites. Bar = 5 μm.
The average chromosomal length was 3.26 μm. The highest chromosome length value (5.50 μm) was found in pair 1 from Capilla del Monte (744 m a.s.l.), and the lowest value (2.27 μm) was found in pair 10 fromVal le Hermoso(948 m a.s.l). Statistically significant dif ferences were found in C values (p <0.0001), with the shortest chromosomes (2.64 μm) being detected in the population from San Marcos Sierra (615 m a.s.l.), and the longest ones (4.11 μm), at Capilla del Monte (744 m a.s.l). The length of the haploid genome (TLH) varied between 29.02 μm (615 m a.s.l) and 45.26 μm (744 m a.s.l). No significant differences in intra- and inter-chromosom al asymmetry indices (A1 and A2), respectively, were ob served (Table 1).
The populations of G. quehlianum at 615, 948, and 1257 m a.s.l were analyzed with the banding technique and FISH. All of them presented constitutive heteroch romatin bands CMA+/DAPI- associated with nucleolar organizing regions (NORs) in the first pair of m chromo somes (Figure 3). On the other hand, FISH showed that the probe for 18-5.8-26S ribosomal genes hybridized in the terminal regions of the first m pair, coinciding with the CMA+/DAPI- bands described above (Figure 3). The 5S locus was located in two chromosome pairs: in the first m pair below the 18-5.8-26S gene and in the last m pair in a paracentromeric position (Figure 3, 4). Both genes had similar sizes, being homomorphic. No differ ences between populations were observed when using either the banding or the FISH techniques (Figure 4).
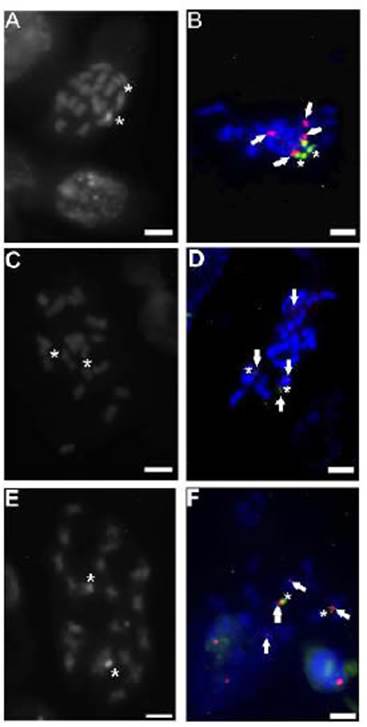
Figure 3 Populations of G. quehlianum: A and B. San Marcos Sierras (615 m a.s.l); C and D Valle Hermoso (948 m a.s.l); E and F: Camino del Cuadrado (1257 m a.s.l). A, C and E Fluorochrome chromosome banding CMA/DAPI; B, D and F. FISH using 18-5.8-26S (green) and 5S rDNA (red) probes. Arrows: rDNA 18-5.8-26S and CMA+/DAPI-/NORs, Asterisks: rDNA 5S. Bar= 5 μm.
DISCUSSION
The DNA content has been related to ecological features along altitudinal gradients in some Angiosperms (Knight and Ackerly, 2002; Šmarda and Bureš, 2006). In previous data on DNA content in G. quehlianum, Das and Das (1998) obtained a value of 6.46 pg for 2C using the Feulgen densitometry method. This value is higher than the one obtained in this study, which yielded an average of 3.86 pg among the four populations. These differences in the results could be due to the use of different methodological techniques to obtain the values of DNA content. The Feulgen densitometry method may not be as precise as flow cytometry (Dolezer and Bartos, 2005).
Species of several genera of New Zealand grasslands (Agrostis, Festuca, Poa, Puccinellia) with the highest C values were found in extreme environments, such as the sub-Antarctic region (Murray et al., 2005). Knight and Ackerly (2002) analyzed the correlation between nuclear DNA content and environmental gradients in different species of California, USA. Those with a higher content were more frequent in intermediate locations of the gradients, with lower contents being found at both extremes. In G. quehlianum, a decrease in DNA content values with increasing altitude was observed (4.30 pg at 615 m a.s.l., and 3.55 pg at 1257 m a.s.l.). Non significant statistical differences were found in the DNA content values among populations.Furthermore, in the analysis of the DNA content of all populations, a mixture of nuclei with three peaks, 2C, 4C and 8C, was observed, which suggests endopolyploidy. This process is considered an important mechanism of adaptation to high temperatures and water scarcity (Nagl, 1978; Negron-Ortiz, 2007; Leitch and Leitch, 2013). This pattern occurs in species with a small genome, which also gives them advantages in arid environments (Palomino et al., 1999; Del Angel et al., 2006). In Cactaceae, endopolyploidy was found in the subfamily Opuntioideae (Negron-Ortiz, 2007; Segura et al., 2007) as well as in some species of Cactoideae (Palomino et al., 1999; Del Angel et al., 2006; Bauk et al., 2016). However, it has not been observed in Gymnocalycium. The processes of endoduplication of the genome can vary among individuals of the same species in response to the effects of different environmental conditions (Barow, 2006; Leitch and Leitch, 2013).
The most common basic chromosome number in Cactaceae is x=11 (Pinkava, 2002; Goldblatt and Johnson, 2006; Das and Mohanty, 2006; Las Peñas et al., 2009, 2014). In all populations, the chromosome number of G. quehlianum was 2n=2x = 22, except for one individual of the population at 948 m a.s.l., indicating that a greater number of individuals should be analyzed in each population in order to explore whether the different chromosome numbers are associated with the altitudinal gradient. The chromosome numbers reported here coincide with meiotic studies that included the determination of pollen stem cells (Das and Das, 1998). Furthermore, no significant differences in the cytogenetic variables were detected among populations. Thus, G. quehlianum chromosomes had an average length of 2.98 μm and a symmetric karyotype, with most of the chromosomal pairs being metacentric. These characteristics coincide with the karyotypic homogeneity presented for the family (Cota and Philbrick, 1994; Cota and Wallace, 1995; Das et al., 2000; Das and Mohanty, 2006; Las Peñas et al., 2008, 2009, 2014).
Results of the CMA/DAPI chromosome banding and FISH techniques show that G. quehlianum presented the 18-5.8-26S loci in the terminal regions of the first pair of metacentric chromosomes, coinciding with the CMA+/DAPI- band pattern. No differences among populations were observed along the altitudinal gradient. The location of this gene is highly conserved in Cactaceae (Las Peñas et al., 2009, 2014, 2017). On the other hand, the 5S probe hybridized in the first m pair next to the 18-5.8-26S, and in the smallest m pair. In most of Cactoideae, a pair of 18-5.8-26S and 5S loci is present in a haploid genome (Bauk et al.,2016; Las Peñas et al., 2016, 2017). In the genus Pfeifera, the 5S gene is duplicated in a chromosome different from the one carrying the 18-5.8-26S gene (Moreno et al., 2015), as it was found in this work. The 5S rDNA unit is located independently of other rDNA sequences, which can be related to the fact that it is transcribed by RNA polymerase III, whereas the polycistronic 45S rDNA uses RNA polymerase I (Garcia and Kovařík, 2013; Brasileiro-Vidal et al., 2007).
In most Angiosperms, the 18-5.8-26S and 5S sites are found in different chromosomes (Roa and Guerra 2015). However, in this work, the 5S locus was located adjacent to the 18-5.8-26S gene and in the last m pair.
The dispersion of 5S sites here reported for G. quehlianum may be attributed to several factors, including structural chromosomal rearrangements, such as translocations (Hayashi et al., 2001); dispersion of rDNA repeats; and amplification of new minor loci and deletion or not of original major loci (Pedrosa-Harand et al., 2006). The latter two factors were proposed as the mechanisms by which 5S rDNA loci repeatedly changed position during the radiation of species, without changing the co-linearity of other markers. These position changes can be mediated by mobile elements (Kalendar et al., 2008; Raskina et al., 2008).
This work makes one of the first contributions of information about DNA content and cytogenetic characteristics (karyotype, heterochromatin distribution and position of ribosomal genes) of G. quehlianum along an altitudinal gradient. Furthermore, we previously reported greater variation in ecological characters (Martino et al., 2021) than in cytogenetic ones among the four populations; this result may be attributed to the great phenotypic plasticity of morphological traits in response to environmental differences of this species. At the same time, our results indicate that changes in DNA content as well as cytogenetic changes are due to cryptic chromosome rearrangements for the species adaptation to the altitudinal gradient.
Climate change is affecting organisms throughout the world. Therefore, understanding the relationships between species characteristics and environment would help predict species responses to climate change (Gurvich et al., 2002; Aragón-Gastélum et al., 2014). Species with wide distributions along climate gradients would be less affected by climate than species with more limited distribution, such as G. quehlianum. In order to conserve this species, it is important to know its genetic characteristics all across its distribution range. Further research of these aspects is necessary to predict species responses to environmental changes.

