


 Inglés (pdf)
 Articulo en XML
 Referencias del artículo
 Enviar articulo por email
 Citado por SciELO
  Similares en
SciELO
Similares en
SciELO 
 Permalink
Introduction
Guava is a relatively common tropical fruit grown in many tropical and subtropical regions of the world 16, such as in the United States, Asia, Africa and Oceanía. Psidium guajava is a species of the myrtle family (Myrtaceae) that is widely planted. In addition, there are some other Psidium species, such as Psidium guineensis and Psidium acutangulum. Guavas have been grown in many countries around the world with high yields. According to statistics released in 2019 4, guava production in the world achieved 46.5 million tons, and the largest producer was India, followed by China and Thailand. The guava has many different shapes, such as circle or oval, depending on the species, and also has high nutritional value. Guava fruit contains a large amount of vitamin A, vitamin B, vitamin C, minerals, polyphenolic and flavonoid compounds that play an important role in preventing cancer, ageing, etc. 2,4. Additionally, antioxidant, anticholesterol and anticancer effects have been reported. As a result of its economic and medicinal benefits, guava is becoming an important crop in many countries around the world. Changes in physiological and biochemical parameters during the ripening of guava fruit take place over a relatively short period of time. Consequently, guava has a very short shelf life, which in turn leads to diffi culties in transportation and storage 10. Thus, a comparative study on various physio logical and biochemical parameters associated with fruit quality between different guava cultivars will provide great value, especially for selecting a guava cultivar for the region, which could provide superior-quality fruit. Changes in sugar, pectin, and antioxidants of guava fruit at various stages of maturity and ripening were reported by several studies from different locations 19,23. These are important criteria for determining the optimum stage of fruit harvesting to obtain quality fruits with extended shelf life.
One of the world’s largest guava fruit exporters is Vietnam, in which Xa Li guava vari eties are widely grown and have significant economic value. Because of the economic benefits, gardeners have invested in planting guava trees in addition to fruit production in many provinces and cities. As a result of this investment, the number of products made from guava trees and fruit has increased nationwide. During the production process, fruit collection and preservation steps are crucial to ensure the quality of the fruit and may have direct effects on consumers 18. Therefore, it is necessary to understand the physiological and biochemical indicators of guava fruit from formation to fruit ripening to improve the quality, storage, and processing characteristics of the fruit. This research aims to determine the physiological ripening time of guavas to help consumers better use and preserve guavas.
Materials and methods
Research materials
Xa Li guava was harvested in Haiduong, Vietnam (20°56′00″N and 106°19′00″E). Phys iological and biochemical parameters were analysed at the Plant Laboratory, Hongduc University and the Department of Plant Physiology and Application, Hanoi National University of Education, Vietnam.
Sample collection method
Samples were collected from March to June following the mixed sampling method across the experimental area. We collected samples at many points on various trees. These plants grew normally and were free from pests. At each stage of the study, we collected samples from all plants, with 05 fruits per tree. A part of the sample was used to immediately analyse the contents of pigments and vitamin C, while the rest was stored at -80°C for later analysis of other parameters.
Determination of fruit length and diameter
At an interval of approximately 2 weeks after anthesis, the length and diameter of fruit were measured until the fruit ripened, and afterward it was harvested (Figure 1).

Figure 1: Figura 1: The growth and development of guava fruit El crecimiento y desarrollo de la guayaba.
Fruit length and diameter were measured from randomly selected fruit during the study. The length from the base of fruit to the base of the calyx and diameter at the largest bulge of fruit from both sides were measured with the help of Panme calipers. The mean values of length and diameter are presented in centimetres 19.
Determination of the pigment content in the peel by the spectral method 14
The chlorophyll content was calculated by the following formula: Ca (mg/l) = 9.784 x E662 - 0.990 x E644. Cb (mg/l) = 21.426 x E644 - 4.650 x E662. The carotenoid content was calculated by the formula Ccarotenoids (mg/l) = 4.695 x E440.5 - 0.268 x C(a+b). Then, the pigment content per 1 g of fresh fruit peel was calculated by the formula:

where:
E 662 , E 644 and E 440.5 = the results of measuring the chlorophyll at wavelengths of 662 nm, 644 nm and 440.5 nm
C a , C b , C a+b = the contents of chlorophyll a, b and total chlorophyll, respectively
X = the content of chlorophyll in 1 g of fresh fruit peel
C = the chlorophyll content of the pigment extract (mg/l)
V = the volume of pigment extract (10 ml)
g = the sample mass (g).
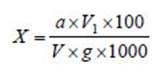
Determination of reducing sugar and starch contents by the Bertrand method 8
The reducing sugar content (X %) was calculated with the following formula:
The starch content (Y%) was calculated by the following formula:
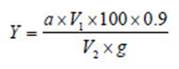
where:
V = the volume of the diluted sample solution (ml)
V 1 = the volume of the analysed sample solution (ml)
V 2 = the volume of diluted sample solution (ml)
a = the weight (mg) of glucose obtained
g = the weight of the analysed sample (g)
100 = the conversion factor to %
1000 = the coefficient of conversion from g to mg
0.9 = the coefficient of conversion from glucose into starch.
Determination of the pectin content by the calcium pectate precipitation method 17
The amount of pectin required for saponification (X) was calculated by the following formula:

where:
a = the weight of pectin introduced into the solution (g)
V 1 = the volume of the initial pectin solution (ml)
V 2 = the volume of pectin solution required for saponification (ml).
The content of pectin (Y %) was calculated by the following formula:

where:
b = the amount of calcium pectate precipitate (g)
X = the amount of pectin required for saponification (g)
0.92 = the transfer coefficient except for the calcium content of the precipitate
100 = the conversion factor to express the results in %.
Determination of the tannin content by the Leventhal method 8
The tannin content was calculated by the formula:

where:
X = the tannin content (%)
a = the volume of KMnO4 used for titration in the flask (ml)
b = the volume of KMnO4 used for titration in the control vessel (ml)
V = the total volume of extract (ml)
V 1 = the volume of the analysed extract (ml)
g = the weight of the analysed sample (g)
k = the tannin coefficient = 0.00582.
Determination of the total organic acid content 12
The total organic acid content was calculated by the following formula:

where:
X = the amount of total organic acid present in the extract
a = the amount of 0.1 N NaOH titrate (ml)
g = the amount of analytical sample (g)
V 1 = the total volume of the extract (ml)
V 2 = the volume to be titrated (ml).
Determination of the vitamin C content by the titration method 3
The vitamin C content (X mg/100g) was calculated by the following formula:

where:
V = the volume of diluted sample solution (ml)
V 1 = the volume of 0.01 N I2 solution (ml)
V 2 = the volume of analysed solution (ml)
g = the weight of the sample (g)
0.00088 = the weight (g) of vitamin C, which was equivalent to 1 ml of 0.01 N I2.
Methods of data analysis
The experiments were conducted three times, and the results are presented as the mean and standard deviation (SD) 1. The results were subjected to analysis of variance (ANOVA) of the data to determine the F ratio. If the value of the F ratio was greater than the appro priate critical F distribution (p < 0.05), the hypothesis was rejected, and it is assumed that at least one of the group means was significantly different from the other group means. The data were compared with Tukey's test using IRRISTAT software for Windows computers.
Results and discussion
The data in Table 1 (page 87) indicate that during the growth and development of guava, the length and diameter changed significantly.
Table 1: Tabla 1: Changes in length and diameter of guava fruits and pigment contents in guava peels. Cambios en la longitud, el diámetro de la guayaba y el contenido de pigmento en la cáscara de las guayabas.

In the same data column, values with similar letters represent non-significant differences, values with different letters represent significant differences (p < 0.05).
En la misma columna de datos, los valores con letras similares representan diferencias no significativas, los valores con letras diferentes representan diferencias significativas (p < 0,05).
From 2 weeks to 15 weeks after anthesis, fruit length increased 5.94-fold (1.515 cm to 8.991 cm), while fruit diameter increased 5.43- fold (1.462 cm to 7.934 cm). In particular, a sharp increase in fruit size was observed during the period from 2 weeks to 12 weeks. This was due to an increase in both the number and size of cells in the guava fruit. From 12 to 15 weeks, the fruit reached the maximum value for the cultivar under the study conditions (at 14 weeks, fruit length was 8.882 cm, fruit diameter was 7.934 cm). After 14 weeks, the fruit size increased very slowly and remained almost unchanged. The ripening process of guava fruit is marked by the colour change of the fruit pods. During this study, we observed that at 14 weeks after anthesis, the guava fruit peel began to show the first yellow spot. Therefore, it can be said that 14 weeks is the physiological maturity stage of guava. The growth of Xa Li guava showed a similar pattern to that of other guava varieties reported previously 22,24.
During the first weeks, the chlorophyll content in guava peels was low. The chlorophyll a content was 0.039 mg/g fresh peel, and the chlorophyll b content was 0.053 mg/g fresh peel at 2 weeks after anthesis. From 2 to 10 weeks, the chlorophyll content increased rapidly and reached the highest value at 10 weeks (chlorophyll a was 0.131 mg/g fresh peel, chlo rophyll b was 0.275 mg/g fresh peel). After 10 weeks, the contents of chlorophyll a and chlorophyll b gradually decreased and then decreased rapidly to 15 weeks because fruits began to move to the stage of ripening, at which time chlorophyll was decomposed and carotenoid pigments were synthesized. Some studies suggest that the maturation of some fruits is related to chlorophyll resolution; for example, during litchi colouration, a visible degreening process associated with chlorophyll degradation has been reported 13,26. This result is consistent with several studies stating that chlorophyll breakdown is asso ciated with the maturity of some kinds of fruits 11,27.
The carotenoid content in guava peel increased with the growth and development of the fruit. In the first week, a low carotenoid content (0.012 mg/g fresh peel) was observed (Table 1). From 2 to 10 weeks, the content of carotenoids increased slowly and then increased rapidly with the maturity stage of the fruit. At week 15, the content of carotenoids reached 0.172 mg/g fresh peel. At the early stage, the fruit is primarily green due to the large amount of chlorophyll that obscures carotenoids; when entering the ripening process, the yellow colour of carotenoids becomes more apparent due to chlorophyll breakdown 7. This result is consistent with the finding that ripening in tomatoes is accompanied by significant increases in carotenoids 21.
Guava fruit contain carbohydrates such as sugars and starches 5 with varying levels from fruit formation to maturity. The results in Table 2 (page 88) show that in the early period of guava fruit development (first 2 weeks), the reducing sugar content was rela tively low, reaching 2.026% of the weight of fresh fruit.
Table 2: Tabla 2: Contents of reducing sugar, starch, pectin, and tannin in guava fruits. Contenido de azúcar reductor, almidón, pectina y tanino en guayabas.

In the same data column, values with similar let ters represent non-sig nificant differences, values with different let ters represent significant differences (p < 0.05).
En la misma columna de datos, los valores con letras similares repre sentan diferencias no significativas, los valores con letras diferentes representan diferencias significativas (p < 0,05).
From 2 to 12 weeks, the content of reducing sugars increased slowly and reached 3.547% when the fruit was 12 weeks old. During the fruit development period from 12 to 15 weeks, the content of reducing sugar increased rapidly and reached 6.204% when the fruit was 14 weeks old. These research results are consistent with research on total sugar, which increase rapidly in the later stages of fruit development 19. At week 15, the reducing sugar content decreased to 6.184% of the fresh fruit weight, indicating a decrease in fruit quality.
When the fruit had just formed, the starch content reached 3.921% of the weight of fresh fruit (2 weeks). The highest starch content was 6.494% at 10 weeks after anthesis (Table 2, page 88). This is the time when fruits tend to accumulate nutrients in preparation for the ripening process. After 10 weeks, the content of starch in the fruit decreased due to the strong metabolism in the fruit. At week 15, the content of starch decreased to 1.975% of the weight of fresh fruit. During this period, the activity of the α-amylase enzyme also increased. Due to increased α-amylase enzyme activity, starch converts into the sugar required for respiration. From the unripe stage to the ripe stage, the starch content declined. When the fruit enters the ripening period, starch decomposes into sugar to increase the amount of reducing sugar to create sweetness in the fruit 28.
The pectin content increased rapidly from week 2 to week 12 (from 0.238% to 0.605% of fresh fruit weight) and decreased in the period from week 12 to week 15 (from 0.605% to 0.418%), making the fruits softer. The pectin content decreased at a later stage due to the increased activity of the pectinase enzyme, which reduced the pectin content in the fruit. The activity of the pectinase enzyme was associated with the softening of the fruit along with an increase in soluble pectin 15.
The tannin content in guava fruit was relatively high at 2 weeks (reaching 2.382%). The high tannin content in the early growth period of fruit made it acrid. The tannin content in guava gradually decreased at first and rapidly decreased at 9 weeks (from weeks 4 to 13). In the period of fruit maturity, the tannin content decreased to only 0.358% at week 15, indicating that the guava fruits were soft and not acrid. This decline was due to tannins being decomposed into pyrogallol and CO2 when the fruit entered the physiological ripening stage 9.
In plant cells, organic acids can be found in the free form, as ammonium salts or esters. Organic acids are characterized by their weakly acidic properties. These compounds are necessary for aerobic metabolism and as flavour constituents that contribute to fruit quality, organoleptic properties and fruit acidity 25.
The data in Table 3 (page 89) show that at the stage when fruit started to develop, the organic acid content was 68.428 mg/100 g fresh fruit.
Table 3: Tabla 3: The content of total organic acid and vitamin C in guava fruits. El contenido de ácido orgánico total y vitamina C en la guayaba.

In the same data column, values with similar let ters represent non-sig nificant differences, values with different let ters represent significant differences (p < 0.05).
En la misma columna de datos, los valores con letras similares repre sentan diferencias no significativas, los valores con letras diferentes representan diferencias significativas (p < 0,05).
During the growth period from 2 to 10 weeks, the total organic acid content increased gradually and reached the highest value of 136.667 mg/100 g fresh fruit after 10 weeks. Degradation of protein and lipids leads to the production of intermediate products such as amino acids, increasing the organic acid content. During the fruit growth period from 10 to 15 weeks, the organic acid content decreased because organic acids are used in respiration 6. On the other hand, energy continues to be needed for the biosynthesis of fruit-specific ripening substances such as enzymes for hydrolysis, esters to create fruit aromas during the ripening period and synthesis of sugars to create fruit sweetness, resulting in the decrease in the total acid content 20.
Vitamin C is synthesized by plants and is a main source of nutrition for humans. The vitamin C content is an important indicator to assess the nutritional value of many fruits. The content of vitamin C from 2 to 12 weeks increased rapidly. This is the major period of fruit development, and the accumulation of vitamin C along with other nutrients takes place at this time. After 12 weeks, the vitamin C content continued to increase, but at a slower rate, and the highest value (205.134 mg/100 g fresh fruit) was reached at week 14; there after, the vitamin C content decreased. Changes in the vitamin C content of guava fruits at different stages of maturity are related to different metabolic pathways and the enzymatic activity of decomposition 23.
Conclusion
The guava fruits gradually changed from green to light yellow at 14 weeks after anthesis due to decreased chlorophyll and increased carotenoid contents, at which time, the fruit size was maximum and almost unchanged, and most of the main components of the fruit such as vitamin C and reducing sugars were at their highest values, while some such as pectin and tannins showed low contents, making the fruit taste better. In this study, guava fruit reached physiological maturity at 14 weeks. Therefore, this is the most appropriate time to harvest guava fruits for excellent quality. If harvested earlier or later, the quality of guava fruit will decrease significantly.

