


 Articulo en XML
 Referencias del artículo
 Enviar articulo por email
 Citado por SciELO
  Similares en
SciELO
Similares en
SciELO 
 Permalink
Introducción
In many regions of the world, aquifers represent the largest source of water storage, often with orders of magnitude and more storage capacity than surface water storage. As is known, the largest portion of fresh water (68.7%) is concentrated in the form of ice in glaciers and mountainous regions; 29.9% is stored in aquifers; and only 0.26% is found in lakes, reservoirs, and rivers (Shiklomanov, 1998). According to Famiglietti (2014), groundwater currently represents up to 33% of total water withdrawals worldwide. Additionally, more than two billion people depend on groundwater as their main source of water, while half or more of the irrigation water used to grow the world's food comes from underground sources (Famiglietti, 2014).
In Mexico, in 2018, around 39.1% of the total volume of water rights granted for consumption came from groundwater; in addition, the main use of water, agriculture, has a granted volume of around 66 799 hm3 per year, of which 36.4% is extracted from groundwater; besides, at the national level, of the 12 628 hm3 a year granted for urban and domestic public use, 58.4% comes from groundwater (CONAGUA, 2018).
Groundwater is better protected against seasonal and climatic variability over the years and has less immediate vulnerability than surface water (Green et al., 2011). However, climate change and the growing demand for water will exert even more pressure on already highly exploited groundwater resources, in some areas, due to the growing water demand for irrigation (UNESCO and ONU-Agua, 2020, p. 23). Globally, the rate of groundwater depletion doubled between 1960 and 2000 (PBL Netherlands Environmental Assessment Agency, 2014).
According to the National Water Commission (CONAGUA), in Mexico, the demand for groundwater is also growing: the agricultural use of groundwater increased by 23.2% from 2001 to 2009 and the urban and domestic public uses of groundwater grew by 30.3%; over half of the extracted groundwater comes from overexploited aquifers (CONAGUA, 2011). Of the 653 aquifers in Mexico, 32 were overexploited in 1975; however, since 2001, the number of overexploited aquifers has oscillated annually between 100 and 106. At the end of 2017, 105 overexploited aquifers were reported (CONAGUA, 2018).
One of the most obvious environmental effects of aquifer overexploitation is salinization. In this regard, one of the effects of climate change is the rise in sea levels which at its time would increase the salinity of coastal aquifers, where groundwater recharge is also expected to decrease. This will cause an increased risk of water-borne diseases and an increase in non-communicable diseases due to high salt intake (UNESCO and ONU-Agua, 2020, p. 98).
In Mexico, by the end of 2017, 32 aquifers had been identified with the presence of saline soils and brackish water, located mainly in the north and center of Mexico; in addition, there was saltwater intrusion in 18 coastal aquifers nationwide (CONAGUA, 2018).
The Sonora River had an additional source of contamination on August 6, 2014 when 40,000 cubic meters of acidified copper sulphate (CuSO4) were spilled into the river by a mining company, Buenavista del Cobre, located in Cananea. Reports from federal agencies indicate that the spill was caused by the failure to tie a polyethylene tube in one of the pools of leachate and the lack of a valve in the sink excesses; some of the contaminants found are: copper, arsenic, aluminum, cadmium, chromium, iron, manganese and plumbum (SEMARNAT, 2014). According to groundwater monitoring carried out by the Mexican government, most of the wells in the area register the presence of metals outside the water quality standard (Díaz-Caravantes et al., 2021).
Despite the importance of overextraction, due to the large scale of the aquifer it is not possible to identify the specific areas in which it is being over- exploited. This prevents the adoption of measures to control over-demand. Experts argue that the study of intensive groundwater use provides a better understanding of sustainability than the extraction-recharge equation (Llamas & Custodio, 2002; Scott et al., 2010). This perspective states that the extraction of groundwater might be a better approximation to identify the impacts on the water resource. This approach is even more pertinent if we take into consideration that in Mexico the use of groundwater replaces the use of surface water, particularly on arid lands (Scott et al., 2010). The analysis of groundwater extraction also allows us to gain a better understanding of the pressure being exerted on surface waters.
Following these insights, in this study we propose a method based on the analysis of water rights information to identify the areas with the most intensive groundwater use. As an example, we use water rights information of the Sonora River basin of 2014, a database provided by CONAGUA (2014). The methodology analyzed the quantitative data using the Kernel density method. The results present the areas with the highest density of overextraction, as well as the volumes and main uses of water. At the end, we discuss the advantages of this analysis.
Study area
As shown in Figure 1, the Sonora River basin is in Northeast-Central Sonora, Mexico, with a total area of 30,913 square kilometers. The mean annual precipitation of the basin is 376 millimeters (Romo et al., 2014). The Sonora River descends from the Los Ajos, Cananea and Bacanuchi mountain ranges flows southwest along 294 kilometers towards the Rodolfo Félix Valdés Dam (aka El Molinito) with a storage capacity of 150 hm3 (cubic hectometers1) at the ordinary average water level (known as NAMO according to its Spanish acronym), and 23 kilometers further down, towards the Abelardo L. Rodríguez Dam, adjacent to the city of Hermosillo, with a NAMO storage capacity of 219.5 hm3 (Pallanez, 2002; Romo León et al., 2014). According to hydrometric information, the Sonora River has been turned from a perennial flow in the years 1960-1995 into an ephemeral regime from 1995 to 2015 (CONAGUA, 2013). In these two periods, annual runoff decreased from an average of 134 hm3 in the 1960-1995 period to 34 hm3 in the years 1995- 2015. The hydrology of the region is determined by a dry and semi-dry climate present in most of the state with little rainfall, as well as by a layer of vegetation that allows the infiltration of water to the subsoil (Pallanez, 2002).

Source: Own elaboration
Figure 1 Location of the Sonora River Basin in Mexico/ Figura 1. Ubicación de la cuenca del Río Sonora en México
The water users of the Sonora River basin extract their water mainly from aquifers. As can be seen in table 1, more than 1,000 hm3 granted water, almost 80%, was groundwater (Table 1).
Table 1 Water rights by type of source and use / Tabla 1. Derechos de agua según tipo de fuente y uso
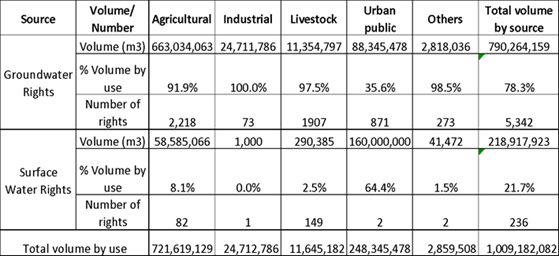
Source: CONAGUA (2014)
Due to this intensive use of groundwater, it is critical to know the status of the aquifers in the basin. Their water balance, according to the information of June of 2014 from the National Water Commission (CONAGUA, 2015) is shown in Figure 2.

Source: CONAGUA (2015)
Figure 2 Aquifer Water Balance on the Sonora River Basin in 2014/ Figura 2. Balance hídrico de los acuíferos en la Cuenca del Río Sonora en 2014
As it can be seen in Figure 2, there is a balance deficit in the Costa de Hermosillo, Mesa del Seri-La Victoria, Río Zanjón, Sahuaral and Río Bacoachi aquifers; in these aquifers, the recharge is less than the extraction and natural discharge. In the rest of the aquifers, the water balance is positive, as is shown in table 2.
Table 2 Water balance of the aquifers in the Sonora River basin /Tabla 2. Balance hídrico de los acuíferos en la Cuenca del Río Sonora
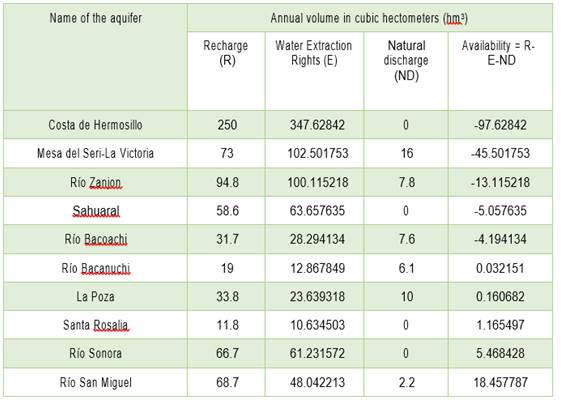
Source: CONAGUA (2015)
As shown in Table 2, aquifers named Río Bacanuchi, La Poza, Santa Rosalía, Río Sonora and Río San Miguel have a positive water balance, which CONAGUA placed as availability. Of all the aquifers, the most overexploited are La Costa de Hermosillo and Mesa del Seri-La Victoria. The first case of overexploitation is due to the extraction to irrigate a district of 66,296 ha, La Costa de Hermosillo, a large-scale commercial agricultural district that produces grapes, oranges, nuts and vegetables for export to the U.S. (Díaz- Caravantes and Wilder, 2014). The second case is due to the extraction to supply water to the city of Hermosillo, the capital of Sonora, with 936,263 inhabitants in 2020 (INEGI, 2021), and which has a water grant to draw about 50 hm3 of groundwater per year (CONAGUA, 2014).
Methods
In Mexico, since the approval of the National Water Law (LAN) in 1992, the Public Registry of Water Rights (REPDA) carries out the registration and approval of water rights. Although the LAN was enacted in 1992, it was not until 2006 that the REPDA became a reliable database when the water rights registration process was completed (Pineda et al., 2014; Scott et al., 2010).
The REPDA contains basic information to understand the use of groundwater in Mexico. Each water right register indicates the granted volume, its geographic location, the use water is authorized for and the drilling depth, among other data. This data provides an idea of the pressure exerted on the aquifers in the different regions of the country.
The database for this study comprises the 5,342 water rights from groundwater uses of the Sonora River Basin updated to June 2014 according to REPDA. The database was provided by personnel of the CONAGUA (2014) through a portable storage device at the request of the researchers. The database file had the Excel XP® program extension (xlsx). The data included the longitude and latitude of each water right which, using ArcMap®, we located the point record of each right.
The production of the spatial model was carried out using the Kernel density calculation method (Baxter and Beardah, 1997), which consists of converting points, in this case the water rights, to continuous surfaces based on the attribute of annual volume of water granted for each right. This transformation allowed us to visualize the areas according to high, medium or low level of density.
For the computation of the surfaces, the Kernel method calculates the density of observations around a pixel. ArcGIS® uses a Kernel-type quadratic function (Silverman, 1986, p. 76), as shown below (figure 3):
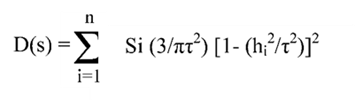
Where τ is the radius of the circle of neighboring points, hi is the distance between point s and the observed point Si, n is the number of observed points and D(s) is the density at that point.
One of the advantages of using Kernel density maps is the possibility of considering the attributes of each point, such as in this case the annual volume of water granted by CONAGUA.
For our study, the calculation to identify the areas of higher density was carried out with a spatial resolution of pixels of 100 x 100 meters.
In the Kernel method, the selection of the search radius of neighboring points depends mainly on the needs of the problem to be studied (Cai et al., 2013; Zhang et al., 2012).
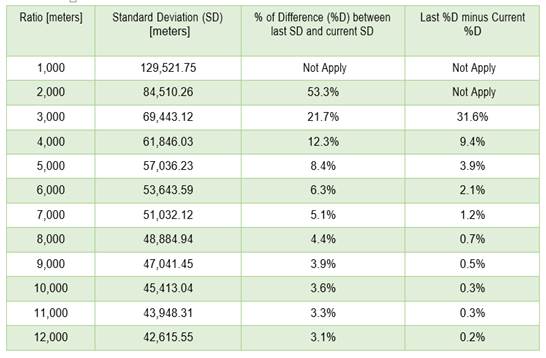
Spencer and Angeles, 2007). Another criterion is to identify the optimal radius based on the standard deviation of the resulting raster pixels at diverse radii. A high standard deviation shows areas with high density but little extension, while a low standard deviation shows the opposite. The most convenient standard deviation, and consequently the appropriate radius, might be considered when, at different radii, the difference between the standard deviations begins to be minimal, as shown in table 3.
Table 3 Standard deviation at different radii of selection of neighboring points / Tabla 3. Desviación estándar a diferentes radios de selección de puntos vecinos
Source: Own elaboration.
In our study, we chose the radius of eight kilometers which is when the subtraction of the differences began to be less than 1%, that is, the standard deviation began to be very similar to the immediate previous one.
After this calculation, the density zones were classified, using the Jenks method, into three classes: high, medium and low. This classification method is recommended when there is no normal distribution of the data, as is the case in the variables used in this study. Under this method, the data are subdivided into several classes, with class limits that allow minimizing the variance within them and maximizing the variance between different classes (Espinosa et al., 2013).
Results and discussion
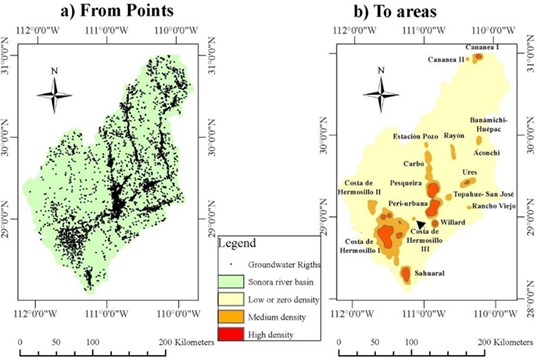
Figure 4 shows the conversion that the Kernel method allows to do from points representing water rights (a) into areas of density (b).
Source: Own research based on CONAGUA (2014)
Figure 4 Areas with the highest density use of groundwater/ Figura 4. Áreas con mayor densidad de uso de agua subterránea
As can be seen in Figure 4, there are 17 areas with the largest use of groundwater is located. As shown in table 4, these 17 zones comprise 88.5% of the groundwater rights in the basin.
Table 4 Basic information of highest density areas of groundwater use/ Tabla 4. Información básica de áreas de mayor densidad de uso de agua subterránea
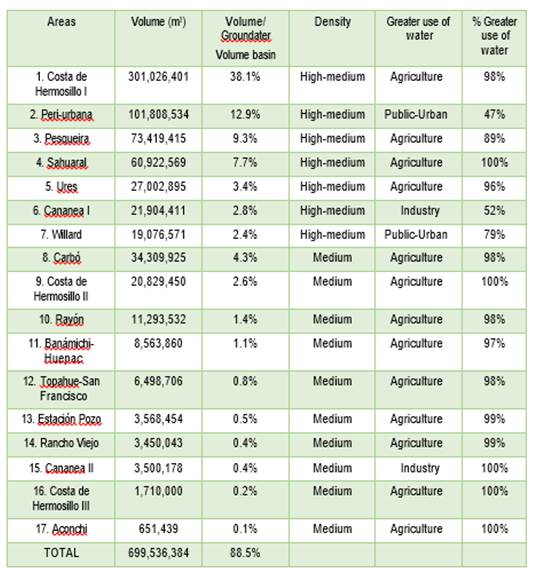
Source: Own research based on CONAGUA (2014)
There are seven areas where overlap high and medium density areas (high- medium): Costa de Hermosillo I, Peri-urbana, Pesqueira, Sahural, Ures, Cananea I, Willard and Carbó. Of these areas, Peri-urbana and Willard correspond to larger public-urban use, and are designated primarily to supply water to the city of Hermosillo, capital of the state of Sonora (Díaz- Caravantes and Wilder, 2014); Cananea I is an industrial use to supply water to the mining sector; the other four areas are mainly agricultural use, in which Costa de Hermosillo I and Pesqueira correspond to large-scale commercial agriculture (Díaz-Caravantes and Wilder, 2014). The areas of medium density are mainly for agricultural use, except Cananea II, which, like Cananea I, provides water to the mining activity in that region, such as the to the mine Buenavista del Cobre, a subsidiary of Grupo México company.
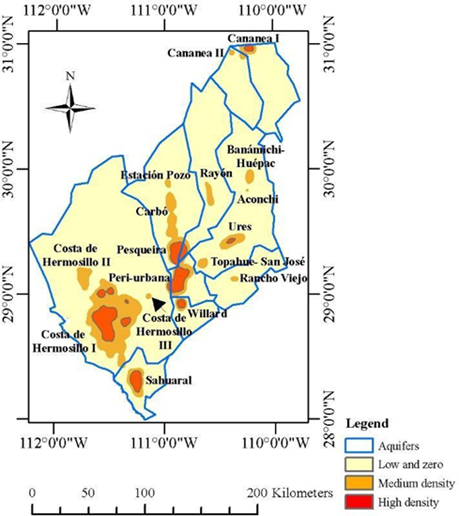
Finally, Figure 5 shows the information on the delimitation of the aquifers of the Sonora River basin together with the areas with the highest density.
Source: Own research based on CONAGUA (2014)
Figura 5 Highest density areas and bounded aquifers / Figura 5. Áreas de mayor densidad y acuíferos delimitados
As it can be seen in Figure 4, the areas with high-medium density of use overlap with the overexploited aquifers identified by CONAGUA in Figure 2: Costa de Hermosillo, Mesa del Seri-La Victoria, Río Zanjón, Sahuaral and Rio Bacoachi. Nonetheless, our analysis has two great advantages: 1) it outlines with more spatial precision the areas with the greatest intensive use of groundwater; and 2) it helps to prevent aquifers from being over-exploited in the future, such as the Willard area in the La Poza aquifer. Similarly, medium-density areas can help prevent the possible depletion of areas of the aquifer.
Another contribution of this analysis is that, since the information is of June 2014, it provides a baseline to observe how the aquifer overexploitation has evolved since the mine tailings spillover on the Sonora River occurred on August 6, 2014 (Díaz-Caravantes et al., 2021).
Conclusions
The water rights data from REPDA can be used as an input to generate a cartography of the pressure on groundwater in Mexico, especially if we need to identify more precisely the places where you are consumed the most water inside the basin. These data do not show up by themselves the state of the aquifers, but they constitute a necessary reference to understand their current condition and their likely evolution over time. Since it is possible to identify high and medium density areas that are not yet overexploited, this information might be used to prevent overexploitation in the future. It can also help to pinpoint where and who is putting pressure on overexploited aquifers.
From this perspective, the method developed in this work can be a powerful and useful tool as it outlines the areas in which public policy intervention is necessary to achieve the aquifers sustainability. Policies might include, for instance, diminishing the number of wells and water rights granted per unit of area, reducing the maximum allowable depth of the new water grants, or significatively diminishing the volume of extractions.

