


 Inglés (pdf)
 Articulo en XML
 Referencias del artículo
 Enviar articulo por email
 Citado por SciELO
  Similares en
SciELO
Similares en
SciELO 
 Permalink
Introduction
Syagrus schizophylla (Mart.) Glass. is an indigenous Arecaceae, naturally found in the Brazilian Sandy Coast (Restinga) and the Atlantic Rain Forest 17. Ordinarily known as aricuriroba, coco-babão and licuriroba, the fruits are considered an unconventional food and an alternative source of carbohydrates, proteins and lipids 23. Unfortunately, the species is considered endangered by the Flora Conservancy National Center (CNCFlora Red List, Brazil), mainly given to both urban and tourist pressures 25.
In forests, palm distribution depends on light and water availability. The Arecaceae family shows a wide diversity of genera and species, still unstudied regarding adaptive traits. Due to spatial distribution and diversity, palms are suitable models for studying biodiversity of tropical and subtropical ecosystems 17,23,25.
The photosynthetically active radiation (PAR, μmol fótons m-2s-1), ranges between 400 and 700 nm 10. Red light incidence (600-700 nm) on the leaf mesophyll enhances stomatal opening 1. However, exposure for long periods may cause red light syndrome, leading to low quantum yield, low photosynthetic capability and lack of stomatal response 20,27. Light intensity and quality vary according to daytime, season, location, climate, position within the plant canopy, and even within the cell 21. Such variations can result in morphoanatomical changes affecting leaf biomass allocation, chlorophyll a/b ratio, leaf thickness, stomatal density and photochemical dissipation 27, organization of the photosynthetic apparatus, etiolation, leaf area and carbohydrate storage, among others 14,20. Blue, red and infrared light activate specific receptors, triggering independent key physiological events 20. This research hypothesizes that using shade nets with light gradients in the blue and red ranges would result in optimized plant carbon allocation and photosynthesis. We studied the physiological response of S. schizophilla to different wavelengths determining the best environmental conditions for sapling yield. The experiments used different shade nets, assuming that specific wavelengths modify the intercepted energy, leading to optimized carbon fixation, growth and yield 5,10.
Given the need for the preservation and recovery of negatively anthropized areas, this study might contribute to optimizing plant conservation, preservation and sustainable use, while offering income diversification in rural areas.
Material and methods
Plant material, seedling transplant and light gradients
Seeds were obtained and germinated as described by Beltrame et al. (2019). Ninety days after emergence, seedlings of S. schizophylla were transplanted into pots of approximately 6.3 L, previously filled with a mixture of commercial substrate Plantmax® and coconut fibre (1:1; v:v) with the following physicochemical characteristics: P = 0.01 g kg-1, K = 5.47 g kg-1, S = 4.82 g kg-1, Ca = 7.89 g kg-1, Mg = 4.34 g kg-1; B = 15.07 mg kg-1, Fe = 1.54 mg kg-1, Mn = 4.34 mg kg-1, Zn = 26.46 mg kg-1, Cu = 0.2 μg kg-1, pH = 4.11, CE 0.8 μS cm-1, bulk density = 0.42 g cm-3, true density = 1.58 g cm-3 and total porosity of 73% of container volume.
Initially, the plants were kept for 270 days under an average of 534.77 μmol photons m-2 s-1 (May 2016 to February 2017), in a greenhouse, with mean PAR 534.77 μmol photons m-2 s-1. After that period, treatments lasted 210 days (from March to October 2017). The seedlings were randomly organized and grown under tunnels (1.80x1.50x1.80 m) covered with different shade nets resulting in different light gradient treatments: plain sunlight - control (G1) (PAR=1234.10 μmol photons m-2 s-1), red Chromatinet® 50% of shade (G2) (PAR=913.16 μmol photons m-2 s-1), two overlapping layers of red Chromatinet® 50% of shade (G3) (PAR=666.34 μmol photons m-2 s-1), black polyolefin 50% of shade (G4) (PAR = 419.56 μmol photons m-2 s-1) and overlapping layers of milky plastic film and polyolefin 50% of shade (G5) (PAR = 534.77 μmol photons m-2 s-1).
HOBO Pro v2 Data Loggers hourly monitored mean, minimum, and maximum temperatures throughout the experimental period. In addition, light spectral quality was evaluated using the USB2000+RAD Ocean Optics UV/Vis spectrum radiometer, obtaining three consecutive readings in each tunnel, at 9 am and three consecutive readings at noon, on bright sunny days.
Growth analyses
Before light treatments (BT), and at three, five and seven months, we measured collar diameter (DC), shoot height (SH), number of leaves (NL), petiole length (LP), leaf length (LL) and width (LW). The LP, LL and LW were measured with a ruler, on the second pair of fully expanded leaves.
After seven months, shoot (SDW) and root dry weight (RDW), and plant total leaf area (TLA) were determined. All leaves were detached, and leaf blades and petioles were separated with pruning shears for TLA determination using a Li-3100 (Li-Cor, USA) leaf area meter. For dry weight determination, plant shoot and roots were separated, paper bagged and dried in a convection oven at 70 ± 2°C for 96 hours. Root and shoot dry weights were gravimetrically determined (±0.0001 g).
Dickson quality index (DQI) was calculated according to Dickson et al. (1960) (eq. 1), using total dry mass (TDM), shoot height (SH), collar diameter (DC), shoot dry weight (SDW) and root dry weight (RDW).

Gas exchange, chlorophyll a fluorescence and green color intensity
Gas exchange was evaluated between 8 am and 10 am with a portable infrared analyzer (IRGA - model Li-6400 XT - Li-Corporation/USA). Evaluation cycles correspond to cycle 1 = one month after initializing treatments (AT)>, cycle 2 = three months after AT and cycle 3 = seven months after AT. Net photosynthesis (A), transpiration (E), stomatal conductance (g s ) and internal vs. external CO2 (C i /C a ), were determined on the second pair of completely developed leaves. For that purpose, a 6 cm2 chamber was conditioned with 1500 μmol photons m-2 s-1 light intensity, 500 μmol s-1 airflow, and 400 ppm standard CO2 concentration (obtained with a CO2 mixer) at room temperature, with mean temperatures varying between 25 and 30°C. Light response curves with 24 levels of PPFD from 1500 to 0 μmol m-2 s-1 allowed for Optimal photosynthetic photon flux density (PPFD) determination. Meanwhile, and on the same leaf used for gas exchange measurements, chlorophyll fluorescence was determined using a Pocket fluorimeter PEA (Plant Efficiency Analyser, Hansatech, England).
Leaves were dark-adapted for 30 minutes with leaf clips (Hansatech), avoiding leaf veins, so that all reaction centres were in the oxidized state. Maximum quantum yield of photosystem II (Fv/Fm) and the photosynthetic index (PI) were determined according to Strasser et al. (2004). Leaf green colour intensity (SPAD index), which correlates with chlorophyll content, was measured with a portable chlorophyll meter (model SPAD-502 Minolta, Japan). Mean values were obtained from eight measures per plant.
Gas exchange and chlorophyll fluorescence were measured one, three and seven months later. SPAD measurements were taken before treatments (AT) and three, five and seven months later.
Statistical analysis
The experiment was conducted in a completely randomized design with five light gradient treatments and six replications, totalizing 30 plants. Data were subjected to ANOVA, and means were compared by Tukey test at 5% probability. Statistical analyses were performed with R26.
Results and discussion
Light, gas exchange and photosynthetic capacity
Under all light gradients, air temperature and humidity were very similar, with mean temperatures varying between 25 and 30°C, and air humidity around 80%. Light spectrum varied as follows: 300 - 900 nm in G1, 300 - 850 nm in G2, 300 - 800 nm in G3, 400 - 700 nm in G4 and 400 - 750 nm in G5. Net photosynthesis (A) varied independently of light gradient (Figure 1A).

Cycle 1 (one month of light treatment), cycle 2 (three months of light treatment) and cycle (seven months of light treatment). Upper case letters compare evaluation cycles; lower case letters compare light gradients, by Tukey test (p<0.05).
Ciclo 1 (un mes de fototratamiento), ciclo 2 (tres meses de fototratamiento) y ciclo (siete meses de fototratamiento). Letras mayúsculas comparan ciclos de evaluación; letras minúsculas comparan gradientes de luz, según la prueba de Tukey (p<0,05).
Figure 1: Net photosynthesis (A), stomatal conductance (g s ), transpiration (E) and internal vs. external concentration of CO2 (C i /C a ) of Syagrus schizophylla plants under light gradients (G1, G2, G3, G4 and G5) and evaluation cycles. Figura 1: Fotosíntesis neta (A), conductancia estomática (gs), transpiración (E) y concentración interna vs. externa de CO2 (Ci/Ca) de plantas de Syagrus schizophylla bajo gradientes de luz (G1, G2, G3, G4 and G5) y ciclos de evaluación.
At cycle 1, the highest A values were observed in G2 and G3, reaching approximately 8.0 μmol CO2 m-2 s-1 (Figure 1A).
At cycle 2, that is, after three months of light treatment, mean A values were different among light gradients. G2 and G5 were different from G3, showing the highest rates of net photosynthesis (Figure 1A, page 4). At seven months (cycle 3), higher mean values were observed in plants from G2, G3 and G4, varying between 6 and 7.5 μmol CO2 m-2 s-1 (Figure 1A, page 4). Gas exchange measurements, particularly net photosynthesis, allows understanding genotype x environment photosynthetic patterns 15, constituting a reliable indicator of plant physiological status 24.
Stomatal conductance (g s ) showed statistical differences among treatments. At evaluation cycle 1, the highest mean gs were observed in plants from G2 and G3 (Figure 1B, page 4). At cycle 2, no significant differences were observed in G2, G4 and G5. The lowest gs was observed in G3 (Figure 1B, page 4). However, at evaluation cycle 3, mean g s exceeded 0.11 mol m-2 s-1 regardless of light gradient (Figure 1B, page 4).
While studying S. schizophylla palm plants, the highest gs observed in G2, G3 (cycles 1 and 3) and G2 (cycle 2), suggested that red light somehow influences the stomatal opening. Our results might be related to light incidence and quality, resulting in fast gs increases and responses to white light components 1. Dumont et al. (2013) reported that stomata are especially sensitive to blue light. In this sense, a weak but significant linear correlation between A and g s (R = 0.45), corroborated our results.On the other hand, Lavinsky et al. (2014) reported that A increased 3.5 fold in Euterpe edulis saplings acclimated at 25.0 mols photons m-2 d-1, in relation to understory saplings, acclimated at 1.3 mol photons m-2 d- 1, and presenting low respiration rate and rapid gas response.
Transpiration rate (E) of S. schizophylla plants showed statistical differences among light gradients at evaluation cycles 1 and 3. At evaluation cycle 1, E was highest in G2 (Figure 1C, page 4). No significant differences in E under light gradients were observed in cycle 2. At cycle 3, the highest E values were close to 6.0 mmol H2O m-2 s-1 in G1 and G2 plants (Figure 1C, page 4). Assimilation of CO2 inevitably requires water loss (E), as gas diffusion rates increase with stomatal conductance 18.
Mean internal vs. external CO2 ratio (C i /C a ) of S. schizophylla plants showed statistical differences, with the highest C i /C a in G2 plants (Figure 1D, page 4). At evaluation cycle 2, mean C i /C a ratios in G1, G2, G4 and G5 showed no differences (Figure 1D, page 4). In cycles 2 and 3, at three and seven months, mean C i /C a ratio increased significantly under light treatments, probably related to plant growth and development, and light quality, since gas exchange is maximized under blue (400-500 nm) and red (600-700 nm) lights 25. In this study, S. schizophylla plants showed different responses under different shading, stating a species-dependent need to use shade nets.
Cycles 1 and 2 showed no statistical differences among F v /F m (Figure 2A, page 6).
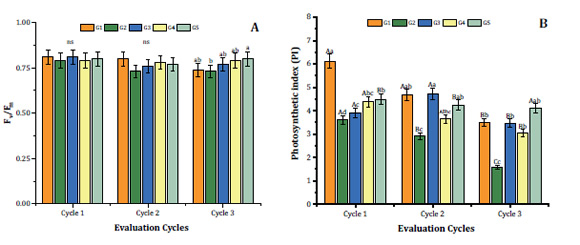
Upper case letters compare evaluation cycles; lower case letters compare gradients by Tukey test (p < 0.05). *ns = non-significant (p < 0.05).
Las letras mayúsculas comparan los ciclos de evaluación; las letras minúsculas comparan gradientes mediante la prueba de Tukey (p < 0,05). * ns = no significativo (p < 0,05).
Figure 2: Maximum quantum yield of photosystem II (F v /F m ) and photosynthetic index (PI) of Syagrus schizophylla plants under light gradients (G1, G2, G3, G4 e G5) at evaluation cycles 1 (one month of light treatment), 2 (three months of light treatment) and 3 (seven months of light treatment). Figura 2: Rendimiento cuántico máximo del fotosistema II (Fv/Fm) e índice fotosintético (PI) de plantas de Syagrus schizophylla bajo gradientes lumínicos (G1, G2, G3, G4 y G5) en los ciclos de evaluación 1 (a un mes de tratamiento con luz), 2 (a los tres meses de tratamiento con luz) y 3 (a los siete meses de tratamiento con luz).
In contrast, cycle 3 resulted in F v /F m significant differences among G2 (lower value) and G5 (higher value) plants, all exceeding 0.75 (Figure 2A, page 6). These results suggest that despite the light treatment, S. schizophylla did not suffer photoinhibition, in accordance with Bolhàr-Nordenkampf et al. (1989) who reported that F v /F m varied from 0.75 to 0.85 in plants with intact photosynthetic apparatus. These authors state that photoinhibitory damage on PSII reaction centres causes decreased F v /F m . Lavinsky et al. (2014) reported that E. edulis acclimated to understory conditions showed a steep drop in F v /F m , from 0.8 to 0.5, during the first week after being transferred to a more luminous environment. After 21 days of re-acclimation, Fv/Fm increased, and at 110 days it was almost re-established to the initial value (0.7). Another study also observed that stressed plants tend to decrease F v /F m values, dissipating the exceeding energy and preventing photoinhibition 12. In accordance with our findings, other authors found decreased F v /F m and photosynthetic index (PI) in cucumber plants exposed to red light 19,20,27. Osório et al. (2012) also state low Fv/Fm for photosynthesis, photochemical efficiency and photoinhibition studies.
Regarding photochemical efficiency, the photosynthetic index (PI) showed interaction among treatments. The highest PI value at cycle 1 exceeding 6, was observed in plants from G1, while other treatments had PI values under 4.5 (Figure 2B, page 6). At evaluation cycle 2, the highest values were observed in G1, G3 and G5 (Figure 2B, page 6). Cycle 3, showed no significant differences among PI in G1, G3, G4 and G5, varying from 3.5 to 4.5 (Figure 2B, page 6). Finally, excepting G5 plants, PI of S. schizophylla plants decreased along cycles, probably given by light stress 13.
Plant growth and development as a function of light
Total leaf area was higher in G2, G3 and G4, followed by G5 and G1 plants; the latter presenting the smallest leaf area, 250 cm2 (Figure 3A, page 7).

Different letters indicate significant differences for Tukey test (p < 0.05). *ns = non-significant (p < 0.05).
Diferentes letras indican diferencias significativas según la prueba de Tukey (p < 0,05). * ns = no significativo (p < 0,05).
Figure 3: Leaf area (A), shoot dry weight (B), root dry weight (C), plant dry weight (D), Dickson quality index (E) of Syagrus schizophylla plants at seven months under different light gradients (G1, G2, G3, G4 and G5). Figura 3: Área foliar (A), peso seco del brote (B), peso seco de la raíz (C), peso seco de la planta (D), índice de calidad de Dickson (E) de plantas de Syagrus schizophylla bajo diferentes gradientes de luz (G1, G2, G3, G4 y G5) a los siete meses de tratamiento.
Similarly, Gatti et al. (2011) observed decreasing leaf area of E. edulis plants as light intensity increased.
Significant differences were only observed among shoot dry weights in G3 and G4 (Figure 3B, page 7). However, the highest root dry weight, 14.5 g plant-1, was observed in G2 (Figure 3C, page 7). Mean plant dry weight under G2 exceeded 33 g plant-1 (the highest mean), while the lowest mean was 22.5 g plant-1, in G4 (Figure 3D, page 7).
The highest Dickson quality index (DQI) was observed under G2 (above 10.0); followed by G3, G1, G5 and G4 plants, in decreasing order and ranging from 7.0 to 4.0 (Figure 3E, page 7). DQI is considered a good parameter for quality assessment in nursery plants, considering the amount and even the distribution of phytomass, pondering different parameters that help estimate plant performance in the field 9. De Oliveira et al. (2009) observed DQI ranging from 2.29 to 2.77 for Copernicia hospita seedlings after three months of growth, and values from 15.78 to 20.70 after nine months of growing in different-size containers under plain sunlight. For B. capitata,Costa et al. (2018) recommended red shade nets, inducing stomatal and leaf anatomical changes enhancing light harvesting, photosynthesis and plant growth and development. B. capitata plants grown under red shade net (50%) showed higher biomass than plants from other shade treatments 4.
The present research suggests that red shade nets contribute to increased plant growth rates and vigour of S. schizophylla by enhancing photosynthetic efficiency. Moreover, gas exchange, growth and development of S. schizophylla plants throughout the experiment with light gradients generated valuable information in relation to productivity. Plants exposed to a greater amount of light had greater biomass. Additionally, in G2, a higher DQI suggested this index may also predict plant survival after field transplanting and/or shade environments. The results not only confirm that this species is tolerant to light variations but also suggest it undergoes acclimation, optimizing resource allocation through structural and physiological adaptations.

