


 Inglés (pdf)
 Articulo en XML
 Referencias del artículo
 Enviar articulo por email
 Citado por SciELO
  Similares en
SciELO
Similares en
SciELO 
 Permalink
Introduction
Among the annual crops traditionally cultivated by small and medium farmers in the Northeast region of Brazil, cowpea ( Vigna unguiculata, L. Walp), also called macassar bean or green bean according to the location, stands out with economic, social and food impor tance. Cowpea is one main source of employment and income for rural population, besides being rich source of vegetable protein, daily consumed in a variety of dishes 43. Grains constitute important sources of protein, amino acids and dietary fiber, considered for public policy programs focused on improving life quality 44.
Irregular rainfall and traditional farming, highly dependent on labor and little use of agricul tural inputs, have recurrently promoted low yields, with 328 kg ha -1 on average in the Northeast and 366 kg ha -1 in Brazil 30. For Oliveira et al. (2001) , low productivity levels are mainly given by traditional cultivars with low agronomic quality. Measures promoting cultivar identification and greater adaptation would determine the revitalization of the culture’s productive chain 33.
According to Ferreira et al. (2007) , understanding the relationships among variables related to productivity is key for cultivar identification and selection. Besides, knowing these relationships allows the indirect selection of hard-to-measure variables with low heritability by considering another simpler-to-assess and associated variable 14.
Phenotypic correlation measures the association between two variables 21. This correlation has two known origins: genetic and environmental. When a gene conditions more than one variable, the genetic correlation is known as pleiotropy 16.
According to Nogueira et al. (2012) , correlations are not measures of cause and effect. Determining a selection strategy based on a direct interpretation of correlation values can compromise the achievement of superior cultivars. In other words, high correlations between two variables may result in indirect effects of a third variable. In this case, other methodologies, such as partial correlations or path analysis, are better choices 25,48,49.
In this sense, path analysis uses regression equations to unfold the direct and indirect effects of a set of variables on a basic or main variable 11, determining the most suitable selection strategy for each variable and identifying the most promising cultivar.
Available literature mentions correlation studies and path analysis on cowpea 19,35,42. However, new sets of variables in path analysis with chain diagrams should be further studied in order to identify easy-to-measure yield components with high heritability 2,47.
Given the above, this work aimed to quantify the direct and indirect effects of primary and secondary components on grain production, identifying selection strategies of greater potential for cultivar selection in the semiarid region of Paraíba.
Material and methods
The experiment was carried out in an experimental field at the Center for Agri-food Science and Technology, Federal University of Campina Grande, CCTA/UFCG, Campus de Pombal - Paraíba. With geographic coordinates 06°46’ south latitude, 37°48’ west longitude of the Greenwich Meridian 3. According to Köppen’s classification, the climate is Aw, semi-arid, with average annual rainfall of 800 mm, and February, March and April concen trating 60 to 80% of total annual precipitation 29.
Before the experiment, plowing was carried out 15 days before sowing, followed by cross harrowing 5 days before bean planting, providing weed control and conditions for good germination. Soon after this procedure, the plots were marked and distributed in the field. Sowing was done in manually opened holes with a hoe at approximately 5 cm depth, placing three seeds per hole. Spacing was 0.5 m with five plants per linear meter.
Fertilization was according to the Fertilization and Liming recommendations for the state of Ceará 17. Thinning occurred about 15 days after emergence, keeping two plants per hole. For pest management, Dimethoate was sprayed twice at a dosage of 1.0 liter/ ha, against aphid ( Apis cracyvora Koch) and thrips (Order Thysanoptera), Methomyl was sprayed once at 0.5 liter/ha against caterpillars ( Spodoptera frugiperda) and Imidacloprid and Beta-cyfluthrin, once at 270 g/ha to control whitefly (Order Hemiptera).
The experimental design consisted of randomized blocks with eight treatments and four replications, totaling 32 experimental units, with 2.0 m between blocks and plots. The treat ments consisted of eight cultivars of cowpea, namely: Costela de Vaca, BRS Marataoã, BRS Itaim, BR-17 Gurguéia, BRS Novaera, Paulistinha, Setentão and BRS Patativa.
Each experimental plot was 3m x 3m (9 m 2) with six rows of plants and a useful area of 2m x 2m (4 m 2). Spacing between rows was 0.5 meters, with fifteen holes and two plants. Two lateral rows were considered borders. Data collection was carried out in the third and fifth rows.
Cultivar evaluation involved the study of phenology. Precocity was evaluated by consid ering initial flowering (FL) and initial fruiting (DAFFF), determined by the number of days between sowing and flowering until 50% of the studied plants had at least one flower or an open pod, respectively. Precocious plants reach full flowering 70 days after sowing. Then, the number of days between flowering and fruiting (DAFFH) was calculated.
Harvest of dry pods was manually performed. At harvest time, yield components were measured: total number of pods per plant (TNP); pod unit mass (PUP), in kilograms; pod length (PL), in cm; pod diameter (PD) in mm with the aid of a caliper; pod grain number (NGP), counting the grains of a sample of 10 pods; number of pods per plant (NPP), obtained by the ratio between total pods and number of plants; grain yield (GY) in tons ha -1; pod bark productivity (SS), in tons ha-1; pod yield (PP), in tons ha -1, and seed/pod ratio (PSR), as the ratio between total grain mass and pod number.
The collected data were subjected to ANOVA, and genetic parameters were estimated 10. The correlations and phenotypic, genotypic and environmental trail analysis were performed as described by Cruz et al. (2012) . For correlations and path analyses, grain yield (GY) was classified as a basic or main variable. The variables TNP, PUP, PL, PD, NGP and NPP were classified as primary components of production, while SS, POS, PSR, FL, DAFFF and DAFFH were classified as secondary components of production. Thus, the path analysis followed a chain diagram scheme ( Figure 1, page 129).
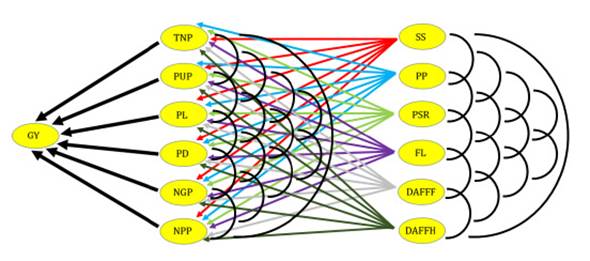
Figure 1: Causal diagram illustrating the direct and indirect effects of secondary components on primary components and grain yield in cowpea. Figura 1: Diagrama de causas que ilustra los efectos directos e indirectos de los componentes secundarios sobre los componentes primarios y el rendimiento de grano en caupí.
Heritability coefficients and measurement allowed variable classification into primary and secondary components. More complex variables, with low heritability and selection difficulty, were classified as primary components. Those with high heritability and easy to measure were classified as secondary components.
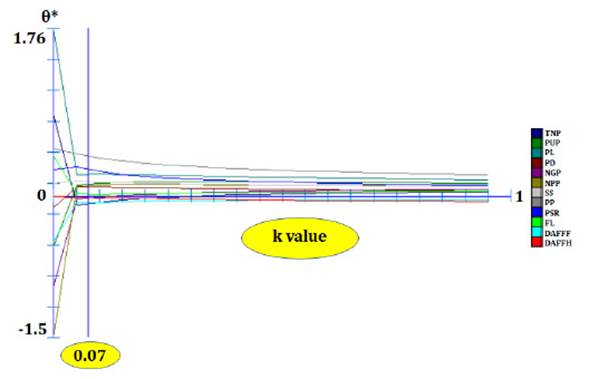
Before the path analysis, all variables were submitted to multicollinearity diagnosis by verifying the condition number (NC) as established by Montgomery and Peck (1981). Once severe multicollinearity was verified, the crest regression analysis 8 established a constant k ( Figure 2).
All genetic-statistical analyses were performed by Genes software ( Cruz 2012).
Todos los análisisenético-estadísticos fueron interpretadosor Genes software ( Cruz, 2012).
Figure 2: Estimates of path coefficients (θ*) as a function of k values and obtained in the analysis using grain yield as the basic variable. Figura 2: Estimaciones de los coeficientes de ruta (θ *) en función de los valores k y obtenidos en el análisis utilizando el rendimiento de grano como variable básica.
Results
The ANOVA showed significant differences between variables except for TNP, PUP and NPP. The coefficient of variation ranged between low, for FL, and very high, for TNP ( Table 1).
Table 1: ANOVA of variables evaluated in an experimental field at the Center for Agri-food Science and Technology of the Federal University of Campina Grande in the city of Pombal - Paraíba. Tabla 1: ANOVA de variables evaluadas en campo experimental del Centro de Ciencia y Tecnología Agroalimentaria de la Universidad Federal de Campina Grande en la ciudad de Pombal - Paraíba.

** and * significant at 1 and 5% probability; respectively; by F test; ns non-significant; by F test
** y * significativo al 1 y 5% de probabilidad; respectivamente; por prueba F; ns no significativo; por prueba F
Regarding genetic parameters, the genotypic variance exceeded the environmental variance for variables PL, NGP, PSR, FL, DAFFF and DAFFH ( Table 2).
Table 2: Estimates of genetic parameters of the evaluated variables in an experiment conducted at the Center for Food Science and Technology of the Federal University of Campina Grande in the city of Pombal - Paraíba. Tabla 2: Estimaciones de parámetros genéticos de las variables evaluadas en el campo experimental del Centro de Ciencia y Tecnología de Alimentos de la Universidad Federal de Campina Grande en el municipio de Pombal - Paraíba.
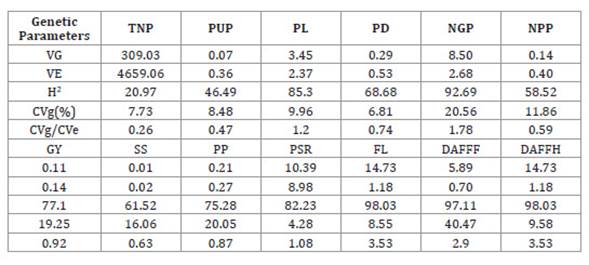
Heritability coefficients showed high magnitude for PL, NGP, GY, PP, PSR, FL, DAFFF and DAFFH; average magnitude for PD, NPP and SS; and low magnitude for TNP and PUP.
The genotypic coefficients of variation exceeded 10 for NGP, NPP, GY, SS, PP, DAFFPF and DAFFH. Also, for PL, NGP, PSR, FL, DAFFF and DAFFH, the b index, i.e. the ratio between geno typic variation coefficient and experimental variation coefficient (CVg/CVe), exceeded unity.
Table 3 shows direct and indirect effects of the explanatory variables on grain yield per hectare. Even with multicollinearity, the crest regression analysis showed high precision considering determination coefficients, residual effects and the adjustment of the k constant.
Table 3: Phenotypic, genotypic and environmental path analysis among the explanatory variables. Tabla 3: Correlaciones fenotípicas, genotípicas y ambientales entre las variables explicativas.
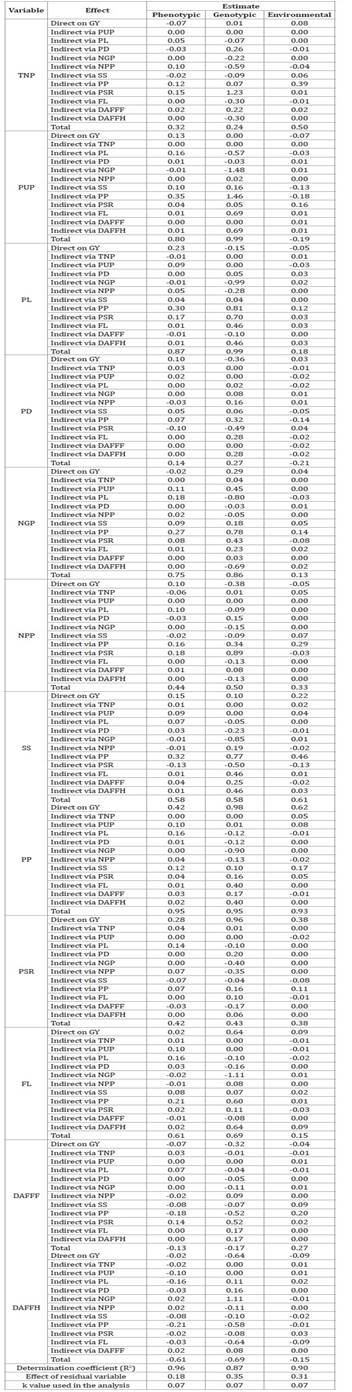
Total number of pods (TNP), pod unit mass (PUP), pod length (PL), pod diameter (PD), pod grains number (NGP ), number of pods per plant (NPP), pod yield per hectare (SS), pod yield per hectare (PP), seed to pod ratio (PSR), flowering (FL), days after flowering to fruiting (DAFFF), days after flowering for fresh harvest (DAFFH) and the basic variable grain yield per hectare (GY), evaluated in cowpea cultivars in an experiment conducted in Pombal - PB.
Número total de vainas (NTV), unidad de masa de vaina (MUV), longitud de vaina (COMPV), diámetro de vaina (DIAMV), número de granos de vaina (NGVA), número de vainas por planta (NVPL), rendimiento de corteza por hectárea (PDC), rendimiento de vaina por hectárea (PDV), proporción de semilla a vaina (RSV), floración (FL), días después de la floración para fructificación (DAFPF), días después de la floración para cosecha fresca (DAFPCF) y la variable básica rendimiento de grano por hectárea (PDG), evaluados en cultivares de frijol común en un experimento realizado en la ciudad de Pombal - PB.
Initially, phenotypic and genotypic correlations of the explanatory variables with the basic variable GY showed the same sign and similar magnitude. The genotypic and environ mental correlations between PUP x GY, PD x GY and DAFOPF x GY, showed different signs. Environmental correlations showed positive and negative values.
PUP, PL and PP showed high phenotypic and genotypic correlation with GY, while NGP, SS and FL moderately correlated with GY and TNP, PD, NPP and PSR weekly correlated with GY. Finally, GY correlated weakly and negatively with DAFOPF and moderately and negatively with DAFFH.
A high environmental correlation was observed between POS and GY, moderate environ mental correlation of SS with GY and weak environmental correlation of TNP, PL, NGP, NPP, PSR, FL and DAFPOF with GY, and of PUP, PD and DAFFH with GY.
Among the variables showing high phenotypic correlation with GY, only PL and PP had direct high-magnitude effects exceeding the residual effect estimate. Despite a high correlation with GY, PUP had a direct effect, not exceeding the residual effect. Among the variables that showed moderate phenotypic correlation with GY, NGP had a direct negative effect on GY. SS and FL had a direct effect, not exceeding the residual effect. Among the variables showing weak phenotypic correlation with GY, TNP had a direct negative effect on the main variable, while PD and NPP had a direct effect not exceeding the residual effect. Despite a weak phenotypic correlation with the main variable, PSR showed a direct effect exceeding the residual effect.
Regarding the genotypic path analysis of the variables showing high correlation with GY, only PP had a direct effect exceeding 2.5 times the residual effect. PUP had no direct effect, and PL had a negative direct effect. NGP and SS had a direct effect not surpassing the residual effect, while FL had a direct effect 1.5 times higher than the residual effect. Among the variables with a weak correlation with the main variable, TNP had no direct effect. PD and NPP had a direct negative effect, and PSR showed a direct effect 2 times higher than the residual effect.
Among most variables, considering the environmental trail analyses, the direct effects did not exceed the magnitude of the residual effect. However, the direct effect of POS on GY, exceeding twice the residual effect, was noteworthy.
Table 4 (page 135) shows the direct and indirect effects of the secondary components on the primary components of grain yield in cowpea beans based on the causal diagram shown in Figure 1 (page 129).
Table 4: Direct and indirect effects of six secondary components (SS, PP, PSR, LFL, DAFFF and DAFFH) on six primary components (TNP, PUP, PL, PD, NGP and NPP) of grain yield evaluated in cowpea cultivars in an experiment conducted in the municipality of Pombal - PB. Tabla 4: Efectos directos e indirectos de seis componentes secundarios (PDC, PDV, RSV, LFL, DAFPF y DAFPCF) sobre seis componentes primarios (NTV, MUV, COMPV, DIAMV, NGVA y NVPL) del rendimiento de grano evaluado en cultivares de frijol caupí en un experimento realizado en la ciudad de Pombal - PB.
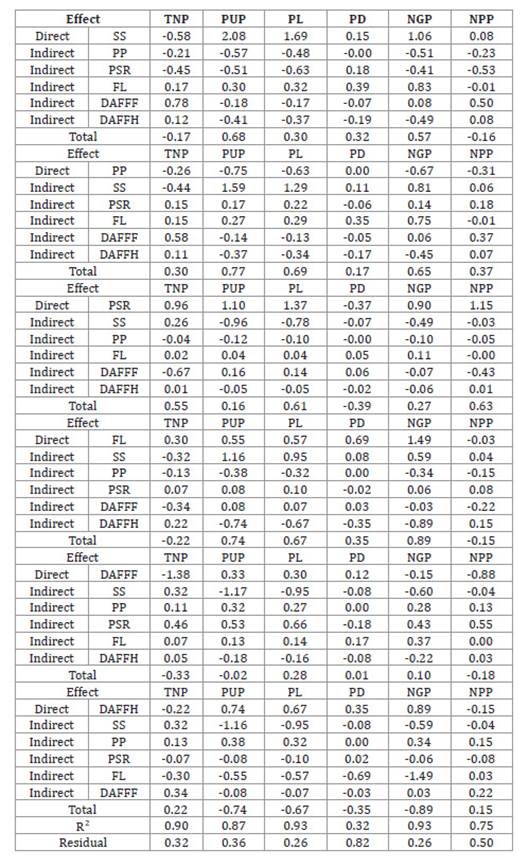
Once again, considering the coefficient of determination, there was good precision in the regression analysis. It appeared that the SS variable had a moderate correlation and a high magnitude direct effect with PUP and NGP. The variable SS, despite a weak correlation with PL, haD a direct high-magnitude effect exceeding the residual effect.
The PSR variable had a moderate correlation with TNP, PL and NPP and a high-mag nitude direct effect, and weak correlation with PUP and NGP, with a high-magnitude direct effect outweighing the residual effect. The FL variable had a strong correlation with PUP and NGP and a high-magnitude direct effect outweighing the residual effect, and moderate correlation with PL, but with a direct effect exceeding the residual.
Finally, DAFFH had a low correlation with PUP, PL and NGP, but with direct high-mag nitude effect exceeding the residual effect.
Discussion
The existence of genetic variability explains the significant differences between the vari ables evaluated in cowpea cultivars 4. Specifically, this variability is caused by different alleles and the phenotypic expression of these variables under evaluation 13. For genetic improvement, this crucial result allows the artificial selection of superior cultivars regarding these important production components 46.
The calculated coefficients of variation were heterogeneous. According to the classification proposed by Gomes 20, values were low for PL, PD, PSR, FL and DAFFH, average for NGP and DAFFF, and high for TNP, PUP, NPP, GY, SS and POS. According to Marques Júnior et al. (1997) , the heterogeneity of the experimental material contributes to a higher coefficient of variation. This heterogeneity would explain why experiments with cowpea show higher estimates of the coefficient of variation than other cultures. It should also be noted that many of these variables were previously evaluated in other studies with coefficients of variation between similar ranges 26,41. Thus, our experimental precision may be considered adequate 5,45.
According to Dutra Filho et al. (2020) , the phenotypic expression of PL, NGP, PSR, FL, DAFFF and DAFFH is mostly due to genetic effects since the genotypic variance exceeded the environ mental variance. This result points to a repetition in the phenotypic expression of these important production components in the respective environment for selection of superior cultivars.
The genotypic variation coefficient (CVg) allows measuring genetic variability 40. Although the ANOVA had previously identified variability among the variables, the CVg identifies those variables with the greatest genetic variability for a breeder to practice selection and obtain greater gains. According to Oliveira et. al. (2008) , CVg >10, is considered high; therefore, in the present work, NGP, NPP, GY, SS, PP and DAFFF showed high potential for breeding strategies.
The ratio between the genotypic coefficient of variation and the experimental coeffi cient of variation (CVg/CVe) was greater than unity for PL, NGP, PSR, FL and DAFFH. This genetic parameter, also called index b, identifies variables with greater genetic variability and cultivar selection potential, guiding the most suitable breeding method for the crop 6. In other words, the greater the magnitude, the simpler methods with a high probability of significant genetic gains. When index b shows heterogeneity in the variables considered production components, applying different methods of selection indices turns out important for maximizing genetic gains in each analyzed variable.
Heritability coefficients indicate high reliability of the phenotypic value as an indicator of genetic value in NGP, NPP, GY, SS, PP, DAFFPF and DAFFH, considering the estimated values were high > 75 22. Heritability coefficients for PD, NPP and SS showed medium magnitude. Thus, ample possibilities for significant genetic gains can be inferred in cowpea selection based on variables with high-magnitude heritability 38. Variables with medium magnitude coefficients may allow genetic gains to a lesser extent.
Heritability corresponds to the heritable proportion of the total genetic variability of the variables under evaluation 7. High magnitude estimates in the present work indicate the need to study correlations among these characters, especially heritable genotypic correla tions guiding an adequate selection strategy 23. This procedure, with the respective devel opments in path analysis, will allow defining the best selection index model maximizing genetic gains through direct and indirect selection and, thus, increasing farm productivity with new cultivars in the hinterland of Paraíba.
Regarding the correlations, according to Cruz et al. (2012) , sampling errors are the main cause of different signals in phenotypic and genotypic correlations of a given variable. Phenotypic and geno typic correlations of explanatory variables with GY presented in Table 3 (page 131-134), with same sign and similar magnitude, demonstrate an excellent experimental and analytic precision 18. When genotypic and environmental correlations show different signs, such as PUP x GY, PD x GY and DAFOPF x GY, the causes of genetic and environmental variations influence these variables by different physiological mechanisms 1. In environmental correlations, TNP x GY, SS x GY and POS x GY present the same sign and are influenced by the same sources of environmental variations, while different signs evidence how the environment favors one character over the other 36.
As explained, the correlation coefficient measures the association between two variables, assuming that for high correlation and positive sign, a gain on one variable can be obtained through indirect selection on the other 37. However, the type of strategy, whether direct or indirect selection, should initially be designed by path analysis, carefully observing the direct and indirect effects when a large number of variables is available. The study is finally complemented by evaluating selection indices.
In the path analysis, the variable PUP had a high phenotypic and genotypic correlation with the basic variable GY, however, the direct effect is low and null ( Table 3, page 131-134). This means that direct selection will not provide significant genetic gains in the basic variable GY 41. In addition, PUP had a low magnitude heritability coefficient ( Table 2, page 130). The recommended strategy would be simultaneous selection of characters with emphasis on those with high indirect effects, such as POS 15. This emphasizes the impor tance of evaluating and identifying suitable models of selection indexes.
The variable PL also presented a high phenotypic and genotypic correlation with GY. However, in this case, the direct effect is low in the phenotypic correlation and negative in the genotypic correlation, given by the absence of cause and effect; i.e. pod length is not the main determinant of GY. Therefore, our recommendation is to identify other variables providing greater selection gain 11.
Regarding PP, high phenotypic correlation with GY and a direct effect in favor of selection defines an efficient indirect selection. This result is even more promising when observing the genotypic correlation between PP and GY. In addition to being a high genotypic correlation, and therefore heritable, the direct effect has a high magnitude exceeding 2.5 times the residual effect. These variables have a true cause-and-effect association. POS is the main determinant of GY, and since this association is directly proportional (with a positive sign in the correlation), it implies that cowpea selection with higher pod yield will be an effective indirect selection of higher grain yield 39. It should also be noted that in the present work and due to its high heritability, POS was classified as a secondary component of production.
For NGP, the simultaneous selection strategy should pay special attention to the PP variable with high-magnitude indirect effects 18.
The variables NPP, SS, FL and DAFFH showed moderate phenotypic and genotypic correlation with GY. NPP did not correlate with GY. Considering SS, simultaneous selection must be adopted, and for FL, a direct selection strategy is the most suitable, i.e., the shorter the flowering time, the earlier the harvest and consequent investment return. The variable DAFFH presents an inversely proportional relationship of cause and effect with GY, meaning early cycle cultivars allow higher productivity and earlier harvests.
Variables showing weak correlations obtained costly direct and indirect selection gains. Again, we recommend selection index models verifying feasibility.
In the environmental path analysis, the POS variable highly correlated with GY with a direct and favorable effect. As this experiment was conducted under an irrigated system, we could infer that both variables benefited from the same environmental variations, in particular, fertilization, irrigation and pest control 9.
The path analysis of the secondary components for each primary component demon strated that for SS, the direct selection strategy maximized selection gain for PUP and NGP.
The high and moderate correlation of PP with PUP, PL and NGP was determined by the indirect effect via SS. Thus, a good strategy in POS selection obtaining significant gains in PUP, PL and NGP, should consider SS through simultaneous selection. Direct PSR and FL selection strategy should maximize gains in TNP, PL and NPP, and in PUP, PL and NGP, respectively.
After carefully approaching path analysis of secondary components with primary components of production, no easy-to-measure secondary morphological components of great importance could determine the primary components of grain production (GY), with the exception of FL and DAFFH. This difficulty has already been reported by other authors working with bean crops 24. New correlations and path analyses should consider other secondary components in the semi-arid region of Paraíba.
Conclusions
Variables with greater potential were identified for the selection of superior cultivars of cowpea in the semiarid region of Paraíba.
The pod yield variable (PP) seems promising for cultivar selection considering higher grain yield (GY).
Direct and simultaneous selection are the most suitable strategies.
Maximized genetic gains call for further studies on selection indices.

