


 Inglês (pdf)
 Artigo em XML
 Referências do artigo
 Enviar este artigo por email
 Citado por SciELO
  Similares em
SciELO
Similares em
SciELO 
 Permalink
KEY POINTS
• In the present study we examined the key role of TGF-β1, deiodinases and thyroid hormones in the development of hepatocellular carcinoma in a rat model
• There is little information available about deiodinase D1 involvement in hepatocarcinogenesis
• TH may have a potential therapeutic role in HCC and this kind of studies is the translational way to evaluate their effect in preclinical models
• Further studies are ongoing to evaluate the effect of TH in HCC progression.
Primary liver cancer is the fifth most diagnosed malig nancy in adult men and remains the third leading cause of cancer death in the world1-3. Hepatocellular carcinoma (HCC) is the most common form of primary liver cancer and accounts for 70% to 85% of total liver cancer4. HCC is a complex multistep process in which several signal ing cascades related to cell survival and proliferation are activated. There is growing evidence suggesting that gradual accumulation of mutations and genetic changes in preneoplastic hepatocytes cause malignant transfor mation and lead to the development of HCC. Several rodent models have been used over the years to study HCC pathogenesis5. The model described by Ito et al. (199) uses medium-term bioassays for the development of preneoplastic foci in rat liver; in this model, the use of diethylnitrosamine (DEN) as an initiator in hepatocarcino genesis and hexachlorobenzene (HCB) as a promoter of proliferation results in the carcinogenic transformation of hepatocytes by similar pathways than those reported in human HCC5-7.
HCB is a widespread environmental pollutant and a liver tumor promoter in rodent medium-term bioassay study designs8. We have previously reported that HCB induces cell proliferation in hepatic preneoplastic foci and expression of hepatic growth regulators, such as transforming growth factor beta-1 (TGF-β1), in rat liver9,10. We have also demonstrated that HCB is an endocrine disruptor that alters thyroid hormones (TH) homeostasis in several rat tissues11. TH deiodinase activity is important in the metabolism, signaling, and regulation of TH status. Both type 1 and 2 deiodinases (D1 and D2) can convert T4 into T3 via outer-ring (5’) monodeiodination. The primary role of D1 is to provide circulating T3 and it is highly ex pressed in the liver, kidney, and thyroid gland12. In contrast, type 3 deiodinase (D3) has inner ring deiodinase activity and catalyzes the conversion of T4 and T3 to the inactive metabolites, reverse T3 (rT3) and 3, 3’-diiodothyronine (T2), respectively. So far, this enzyme controls local TH homeostasis and protects tissues from TH excess13. It has been shown that local hypothyroidism favors the progres sion of preneoplastic lesions to HCC in rats14. Recent findings demonstrated that increased expression of D3 enhance tumor proliferation15, while decreased D1 activ ity has been reported in the non-thyroid illness syndrome and in several human neoplasms16. These data support the idea that deiodinating enzymes may influence cancer development. Cytokines, such as TGF-β1, are involved in the regulation of cell differentiation and neoplastic trans formation through alterations in the transcription of their target genes17. TGF-β1 induces endogenous D3 in diverse human cell types, including fetal and adult fibroblasts from several tissues18.
The aim of this study was to investigate alterations in D1, TGF-β1, p27, and p21 -key molecules involved in cell growth regulation- and its relation to TH metabolism in a rat liver tumor promotion model and in HepG2 cells treated with HCB.
Material and methods
HCB, anti-β-actin, immunoglobulin, anti-proliferating cell nuclear antigen (PCNA), phosphorylated protein mothers against decapentaplegic homolog 2/3 (pSMAD 2/3), triiodo thyronine, thyroxine, and Modified Eagle’s Medium (MEM) were purchased from Sigma-Aldrich Co. (St Louis, MO). Anti- Deiodinase 1, 3, anti-p21, and anti-p27 were purchased from Santa Cruz, Argentina. TRI-Reagent used for the extraction of mRNA was purchased from MRC (Molecular Research Center, Inc. Montgomery Road, Cincinnati, OH). The reagents used for cDNA synthesis, reverse transcriptase, molecular weight markers, random primers and dNTPs, and Taq enzyme polymerase were purchased from SRL Biodynamics, (Buenos Aires, Argentina). Polyvinyl difluoride membranes (PVDF) for immuno-blotting, secondary goat anti-mouse IgG, and anti-rabbit IgG were purchased from Bio-Rad Laboratories, Inc. (Hercules, CA). The CP-BU plates were purchased from AGFA-Gevaert Argentina SA. Monoclonal anti-TGF-β1 was obtained from Abcam Inc. (Cambridge, MA) and polyclonal anti GST-P+ was from Assay Designs Inc. (New York, NY). Both the Texas Red dye conjugated IgG and the IgG conjugated with Alexa dye were acquired from Jackson Immuno Research Laboratories (West Grove, PA). Specific primers for D1, D3, TGF-β1, GADPH, and L19 were purchased from Invitrogen Life Technologies (Carlsbad, CA). Heat-inactivated fetal bovine serum (FBS, Natocor, Cordoba, Argentina). All reagents were of analytical grade.
Female Wistar rats (100g) were acquired from the Fac ultad de Farmacia y Bioquímica, Universidad de Buenos Aires, Argentina. Rats were fed Purine 3 rat chow (Cabeca S.C.A, Argentina) and water ad libitum. The animal protocol was designed to minimize pain or discomfort to the animals. The general health of the animals was not affected by the employed doses of HCB or DEN as evaluated by the behav ior and appearance of the rats including examination of the coat, mucous membranes, body weight, and food and water consumption. All experiments were performed in compliance with institutional and international guidelines for laboratory animal care. Ethical approval was obtained from the ethics committee of the School of Medicine, Universidad de Buenos Aires. The animals were kept in environmental conditions that consisted of a 12 h light-dark cycle, 20-24 °C, and 45-75% humidity. Thirteen-day-old animals, following a 7-day acclima tion period, were randomly divided into 4 groups, containing 3-5 animals per group and treated (Fig. 1) with the following schedule: Control group received an i.p injection of saline solution (9%) on day 0; DEN group received an i.p injection of DEN (100 mg/kg dissolved in 0.9% saline) on day 0 and, on day 45, saline solution by gastric tube; HCB group received i.p. saline solution on day 0 and, on day 45, HCB (100 mg/ kg/day) by gastric tube; finally, DEN + HCB group received i.p. DEN (100 mg/kg dissolved in 0.9% saline) on day 0 and, on day 45, HCB (100 mg/kg/day) by gastric tube. All groups underwent partial hepatectomy on day 52 and were sacrificed on day 100 of treatment. At this time, all animals were eu thanized by i.p. ketamine and xylazine overdose injection for tissue collection; complete necropsies were done, and about one-half of the left and right lateral liver lobes were immedi ately frozen by immersion in liquid nitrogen for subsequent western blotting of different proteins. The remaining parts of the left and right lateral lobes were fixed overnight in freshly prepared 4% paraformaldehyde, and embedded in paraffin for light microscopy. Small portions of the tissue were also frozen at -70 °C for mRNA extraction. Serum was obtained for hormone analyses.
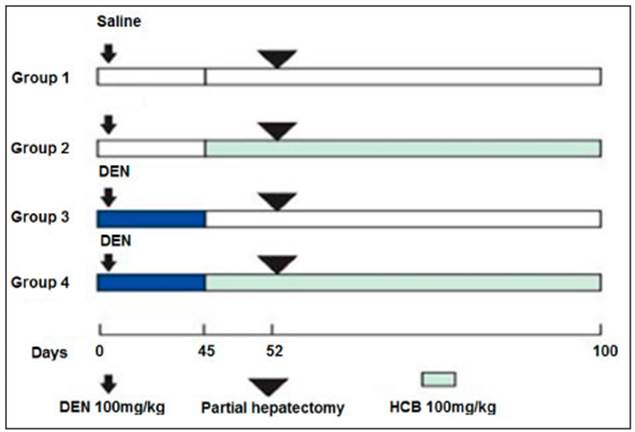
Fig. 1 Experimental design for the initiation/promotion study. The animals were treated as indicated in M&M
In vitro studies were performed in the human liver cancer cell lines HepG2 and Huh-7 obtained from the American Type Culture Collection. The cells were grown in MEM supplemented with 10% fetal bovine serum (FBS) and gentamicin (50 mg/ml) in cell culture flasks at 37°C, under 5% CO2. Cells in exponential growth with 80% confluence were washed with phosphate buffer solution (PBS) and then treated with 0.25% trypsin-0.03% EDTA for 1-5 minutes at 37 °C. Cells were seeded in 6-well plates at a density of 5 x 10³ cells per well. The plates were preincubated for 24h to allow cell adherence and then MEM or HCB were added. HCB was dissolved in ethanol (ETOH) and final concentrations in the incubation medium were 0.005, 0.05, 0.5, and 5 μM. Cells were treated for 24h. Control cells were treated with the same volumes of ETOH.
For experiments performed with exogenous T3 or T4, HepG2 cells were pre-treated with HCB (5 μM) for 24h, and then received T3 (10-9, 10-7, and 10-5 M), T4 (10-8, 10-6, and 10-4 M), or dimethyl sulfoxide (DMSO) vehicle for T3, for 24h. Then we evaluated the expression of PCNA levels. T3 or T4 were selected based on our previous experience and that from other authors.
To analyze the role of TGF-β1/SMAD pathway in the prolif erative effect of HCB as well as in the involvement of D1, p21, and p27, HepG2 cells were pretreated for 2h with SB431542, a specific inhibitor of TGF-β1 receptor 1 tyrosine kinase. To determine the effective inhibitory dose of SB431542, HepG2 cells were pretreated for 2h with SB431542 (0.5 and 1 μM), followed by 24h treatment with 5 μM HCB. Then we evaluated the expression of PCNA, pSMAD, D1, p21, and p27.
The expression of glutathione S-transferase placental type (GST-P) in three or more contiguous cells is used as an early marker of preneoplastic foci in the hepatic carcinogenic process19. Histological sections of rat liver were incubated with primary antibodies anti-GST-P+ and anti-D1 or with anti- D3 (which are expressed in the cytoplasm) and anti-TGF-β1 (which is externally bound to the cell membrane). Slides were stained with a double system of secondary antibodies conju gated to Alexa or Texas Red fluorophores. Each of the D1, D3, and TGF-B1 proteins were quantified as the number of labeled cells relative to total cells, for the focal and non-focal areas. One thousand cells were analyzed, for focal and non-focal areas, and the staining was quantified and expressed as the number of stained cells per total cells analyzed (1000). The value obtained in the control group was normalized to value of “1”. Proteins were analyzed and quantified using a fluo rescence Nikon C1 (Plan Apo 40/0.95) confocal microscope.
Rat liver, HepG2, or Huh-7 cell protein lysates were sub jected to 12% sodium dodecyl sulfate-polyacrylamide gel electrophoresis (SDS-PAGE), transferred to PVDF mem branes, and immunodetected with anti-PCNA (1:500), anti-D1 or D3 (1:500), anti-pSMAD (2/3) (1:500), anti-TGF-β1 (1:500), anti-p21(1:500), anti-p27 (1:500), or anti-β-actin (1:1000) anti bodies. The suitable horseradish peroxidase-conjugated anti-species antibodies (1:1000) were used for protein detection, visualized by an enzyme-linked enhanced chemoluminescence kit, and quantified by scanning laser densitometry in a Foto dyne (Foto/Analyst), Gel-Pro Analyzer 3.
Total RNA was extracted with a phenol-isothiocyanate of guanidine (TRI-Reagent) solution20. An aliquot of 2 μg of total RNA was used to synthesize the first-strand cDNA with random primers, deoxynucleotide triphosphates, reverse transcriptase (RT), and RT buffer. The reaction mixture for TGF-β1, GAPDH, and L19 amplification contained specific GoTaq reaction buffer (1.25 U GoTaq DNA polymerase, 0.5 μM of each forward and reverse primers, and 1 μl of RT products). PCR was performed as follows: reaction mixture for TGF-β1 amplification was incubated at 94 °C for 5 min and then amplified at 94 °C for 1 min, 60 °C for 1 min, and 72 °C for 1 min. Reactions were repeated for 27 cycles. Re action mixture for glyceraldehide 3-phosphate dehydrogenase (GPDH) amplification was incubated at 94 °C for 5 min, and then amplified at 94°C for 1 min, 55 °C for 1 min, and 72 °C for 1 min. Reactions were repeated for 27 cycles. The sequences of forward and reverse primers were as follows:
TGF-β1: 5´-CTGCTGGCAATAGCTTCCTA-3´
5´-CGAGCCTTAGTTGGACAGGAT-3´.
L19: 5´-TGAACGGGAAGCTCACTGG-3´
5´-TCCACCACCCTGTTGCTGTA-3´.
GAPDH: 5´CCTGGTAGACAAGTTTCCCTTGTTCATG GC-3´
5´-GGCCCTCGTAGCACACCTT-3´.
L19 and GAPDH cDNAs were used as loading controls. PCR products were detected as a single band on 2% agarose gel, containing 0.05% (v/v) ethidium bromide. Bands were detected and intensity was quantified by scanning laser den sitometry in a Fotodyne (Foto/Analyst), Gel-Pro Analyzer 3.1.
Thyroid hormone concentrations were determined in liver extracts using specific and sensitive radioimmunoassays (RIAs), as previously described, using methanol-chloroform extraction, back-extraction into an aqueous phase, and pu rification of tissue extracts using Dowex columns21. TH were determined in the purified liver extracts using sensitive RIAs. The sensitivity of the RIAs is 2.5 pg T4/tube and 0.7 pg T3/ tube and cross-reactivity of the RIAs have been described previously21. Samples were processed in duplicate.
Data are expressed as mean ± SEM. Differences between treated and control groups were analyzed by one-way ANOVA, at a 95% confidence interval, followed by Tukey post hoc test to identify significant differences between the means of samples and controls, after testing homogeneity of variance using Barlett’s procedure. Differences between control and treated animals were considered significant when p values were < 0.05.
Results
HCB induces cell proliferation in rat liver preneoplastic foci and is a disruptor of TH status. DEN is an extremely potent liver tumor initiator in rats. When combined, DEN and HCB act sinergistically9-11. Since TH regulates key cellular processes including proliferation, differentiation, and apoptosis in virtually all human cells, we evaluated T4 and T3 rat liver concentrations in a medium-term carcinogenicity bioassay. Our results showed that in the DEN + HCB group, liver T3 levels were significantly decreased (45 and 50%), and T4 concentration increased (64 and 77%) compared to the DEN or HCB group, re spectively (Fig. 2).
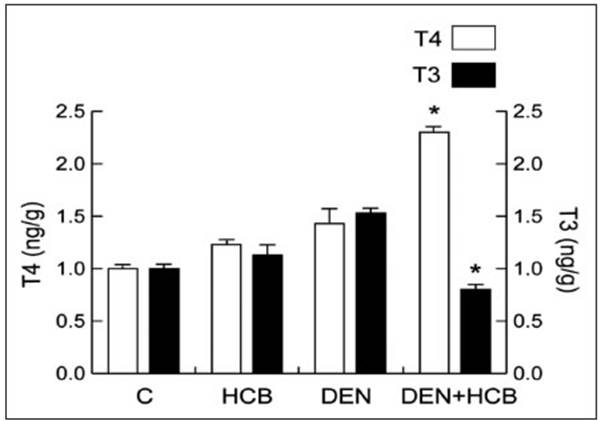
Fig. 2 Liver TH concentrations. T4 and T3 tissue levels were estimated as described in M&M. The re sults are the mean ± SEM of three independent experiments. Significantly different from DEN or HCB values (*p < 0.05)
Since benign or malignant neoplastic transformation of different cells can be associated with hormonal changes22, we evaluated the mRNA expression of iodothyronine de iodinase enzymes D1 and D3, involved in TH metabolism.
Our results showed a significant decrease in D1 mRNA expression in the DEN + HCB group (46 and 43%) compared to DEN or HCB, respectively (Fig. 3A). D3 is undetectable in most mature tissues, including the liver; however, D3 robust reactivation has been documented in many disease states15. Figure 3B shows an increase in D3 mRNA levels in the DEN + HCB group (51 %) compared to DEN or HCB groups. These observations were cor roborated in rat liver by immunohistochemistry.
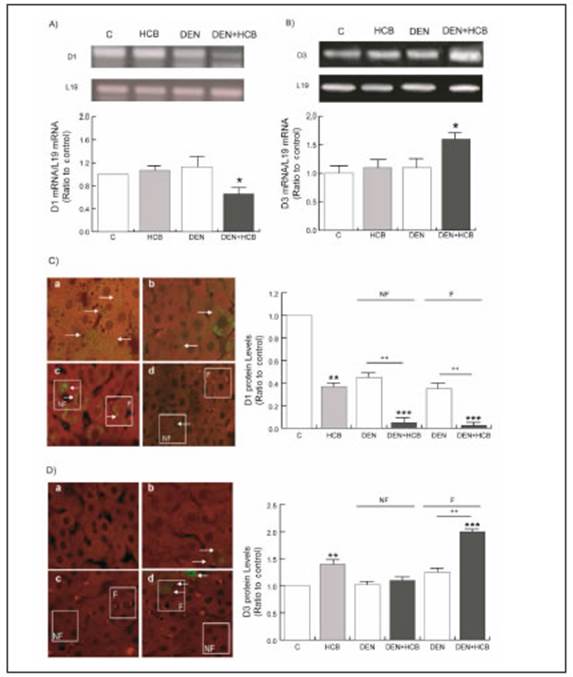
Fig. 3 Expression of D1 and D3 mRNAs and protein in liver tissue of HCB-treated rats. Rats were treated as indicated in M&M. The upper panels show (A) representative pattern of RT-PCR amplification of D1 cDNA and (B) Representative pattern of RT-PCR amplification of D3 cDNA. Quantification of D1 mRNA/ L19 mRNA or D3 mRNA/ L19 mRNA is shown in the lower panels. Values are the mean ± SEM of three independent experiments. Significantly differences (*p<0.05) compared to DEN as well as HCB group. Immunolocalization of D1 (C) and D3 (D) expression in rat liver histological sections. (a) control, (b) HCB, (c) DEN and (d) DEN/HCB. Magnification: 400x. The white squares indicate the focal and non-focal areas of the DEN and DEN + HCB groups. Arrows show D1 and D3 expression (green staining). The red staining corresponds to GST-P positive cells. The D1 and D3 protein quantification levels are shown in the right panels. Values are means ± SEM of three independent experiments. Significantly different (**p< 0.01 and ***p< 0.001) compared to C, (++p < 0.01) compared to DEN group
The expression of D1 protein levels showed a decrease in the HCB group (60%) compared with the control group. (Fig. 3C, photo A and B).
In the same way, the expression of D3 protein levels showed an increase in the HCB group (41%) compared with the control group (Fig. 3D, photo A and B). When analyzing the expression of D1 and D3 between focal and non-focal areas, it was observed that D3 increased in the focal zone (Figure 3D, Photos C and D) while D1 decreased in both focal and non-focal zones (Fig. 3C, Photos C and D).
On the other hand, the expression of D1 and D3 mRNA in the HCB group in rat liver did not show significant dif ferences with respect to control groups. Contrarily, at the protein level, we found significant differences between these groups. D1 expression decreased (33%) while D3 increased (35%) compared to the control, suggesting a differential regulation of transcription and translation (Figs. 3, A and B).
TGF-β1 is one of the most important cytokines in liver cell growth maintenance and it induces D3 expression18. We evaluated TGF-β1 protein levels (red staining) in liver focal (three or more contiguous green staining) and non-focal areas from DEN and DEN+HCB groups (Figure 4). Immunohistochemical staining showed that HCB induced a significant increase of TGF-β1 protein levels in HCB (40%) and DEN (50%) groups compared to the control group (Figure 4, Photos C and D). On the other hand, in focal areas, HCB increased TGF-β1 protein levels in the DEN+HCB group compared to the DEN group (156%) (Figure 4E). We also found that in the DEN+HCB group the number of preneoplastic foci (Figure 4G) and the foci size [(cell number/foci, (Figure 4H)] were increased (110 and 48%, respectively) when compared to the DEN group.
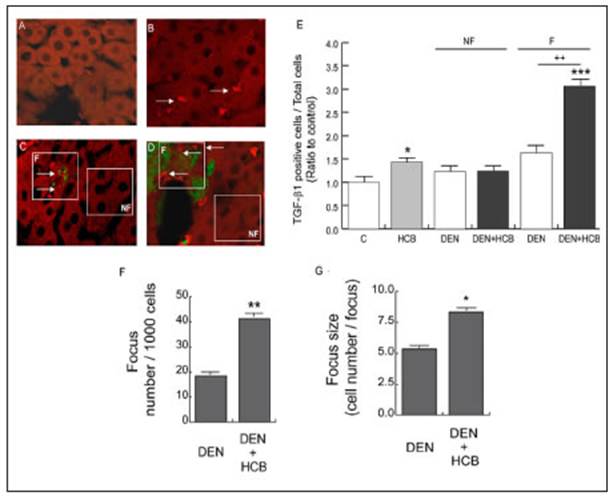
Fig. 4 Immunolocalization of TGF-β1 in liver histological sections. Representative images are shown in the upper panel; (A) Control, (B) HCB, (C) DEN, and (D) DEN + HCB. Magnification: × 400. The white squares indicate the focal and non-focal areas of the DEN and DEN + HCB groups. Arrows point to TGF-β1 positive cells. Green staining corresponds to GST-P+, and red staining to TGF-β1+ cells. Quantitative analyses of TGF-β1 per 1000 cells for the different treatments are shown on the side panel (E). The control value of TGF-β1 positive cells / total cells was normalized to 1. Significantly different (*p<0.01) and (***p < 0.001) compared to control. Focus number/1000 cells is shown on the panel (F). Focus size (cell number/focus) is shown in panel (G). Values are means ± SEM of three independent experiments. Significantly different (*p<0.01) and (**p<0.001) compared to DEN group
HepG2 is a well-differentiated human HCC cell line that preserves numerous liver-specific functions and thus can serve as an in vitro model. In addition, this cell line is char acterized by presenting high levels of D123. We observed that the treatment of the HepG2 cell line with increasing concentrations of HCB induced a reduction of D1 mRNA and protein levels (Fig. 5A). Similar results were obtained with the Huh-7 cell line (Fig. 5C). Regarding protein levels, the enzyme presented a slightly different profile than the mRNA (Fig. 5B). Similar results were obtained with the Huh-7 cell line (Fig. 5D).
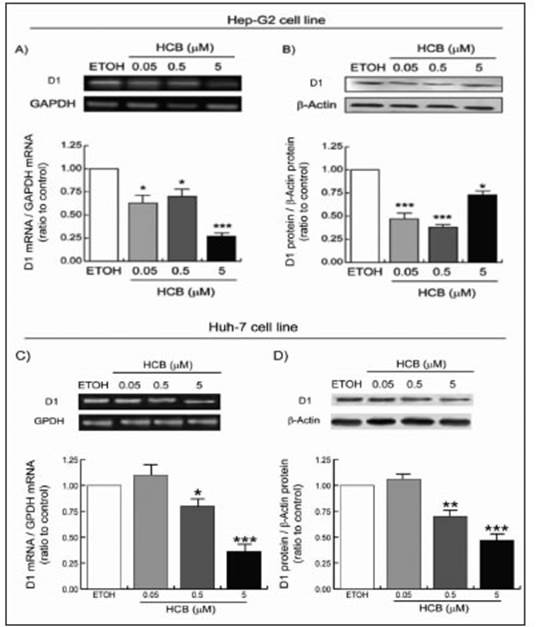
Fig. 5 D1 mRNA and protein expression in HCB treated HepG2 and Huh-7 cell lines. Cells were treated as indicated in M&M. In the upper panel (A)(C) representative pattern of RT-PCR amplification of D1 cDNA and (B)(D) representative western blot of D1 protein expression are depicted. Quantification of D1 mRNA/GAPDH or D1/β-actin is shown in the lower panel. Values are the mean ± SEM of three independent experiments. Significant differences (*p < 0.05; **p < 0.01; ***p < 0.01) compared to ETOH
Next, we hypothesized that the effect of HCB on the proliferation observed in rat liver, as well as in the HepG2 cell line8, is probably due to a reduction of T3 levels be cause of HCB reducing D1 expression levels.
Thus, HepG2 cells were pre-treated with HCB (5 μM) for 24h and then received increasing concentrations of T3. HCB treatment increased PCNA protein levels (172% compared to ETOH) as it has been previously reported9. When HCB-treated cells were administered 10-5 M T3, PCNA levels returned to ETOH values. However, lower concentrations of T3 (10-7 and 10-9 M) resulted in a de crease of HCB-induced proliferative effect without reach ing basal levels (Fig. 6A). When adding exogenous T4, no effect was observed on the increased PCNA levels by HCB. This result coincides with the observed decrease in D1 expression (Fig. 6B).

Fig. 6 Dose-dependent effect of T3 (A) or T4 (B) on PCNA protein content in HCB-treated HepG2 cells. Cells were treated as indicated in M&M. PCNA protein levels were analyzed by Western blot in the upper panel. Quantification of PCNA/β-actin ratio to ETOH is shown in the lower panel. Values are means ± SEM of three independent experiments. Significant differences (*p < 0.05; **p < 0.01) compared to ETOH, and (+p < 0.05; ++p < 0.01) compared to 5 μM HCB
Since TGF-β1 is a positive regulator of cell growth in HepG2 cells, its mRNA levels were evaluated in these cells treated with different doses of HCB. Our results showed that HCB increased TGF-β1 mRNA expression in a dose-dependent manner (50, 102, 150, and 145%), when compared to ETOH (Fig. 7A). On the other hand, HCB treatment increased TGF-β1 protein levels only at the two highest concentrations compared to the ETOH group (180% and 270%, respectively) (Fig. 7B).
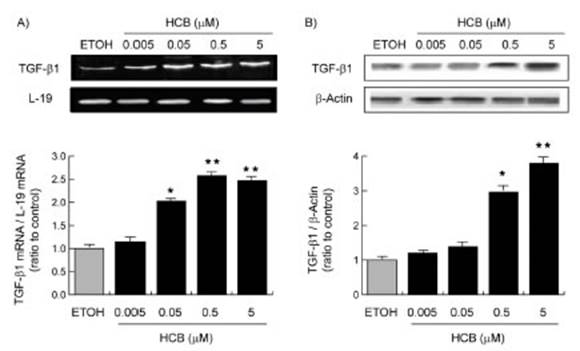
Fig. 7 HCB effect on TGF-β1 mRNA and protein expression in HepG2 cell line. Cells were treated as indicated in M&M. (A) A representative pattern of RT-PCR amplification of TGF-β1 cDNA from control and HCB-treated cells, synthesized from total RNA, and (B) TGF-β1 protein levels were analyzed by Western blot are shown in the upper panel. Quantification of TGF-β1 mRNA/ L19 mRNA or TGF-β1 protein levels are shown in the lower panel. Values are means ± SEM of three inde pendent experiments. Significantly different (*p < 0.05; **p < 0.01; ***p < 0.01) compared to ETOH
We evaluated whether HCB-induced cell proliferation was dependent on TGF-β1/SMAD pathway. As shown in Figure 8A, the proliferative effect of HCB (measured as PCNA levels) was decreased 25% with 0.5 μM SB431542 and returned to basal levels after 1 μM SB431542-treatment when compared to values without the inhibitor.
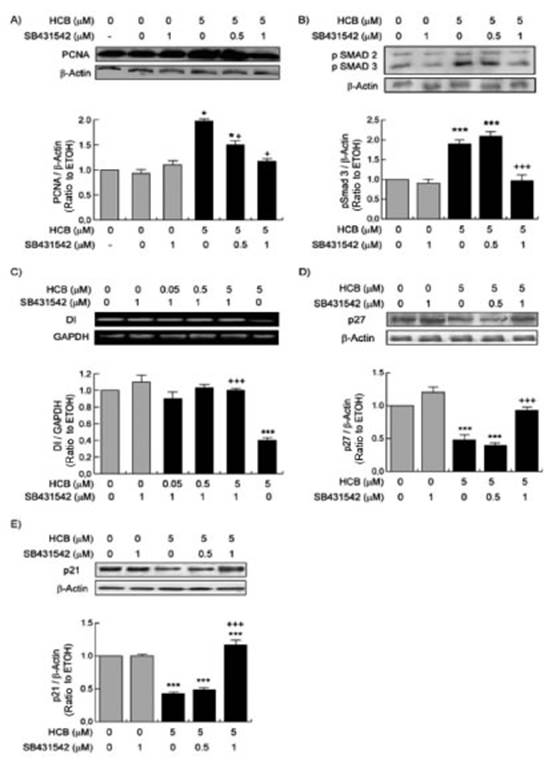
Fig. 8 Dependent effect of TGF-B1 on PCNA, pSMAD, p21, p27 protein levels and D1 mRNA expression in HCB-treated HepG2 cells. Cells were pre-treated a s indicated in M&M. The upper panels show (A) PCNA, (B) pSMAD2/3, (D) p27, and (E) p21 analyzed by Western blot and (C) D1 analyzed by RT-PCR. Quantification of protein/β-actin or protein/GAPDH is shown in the lower panels. Values are means ± SEM of three independent experiments. Significant di fferences (*p < 0.05; ***p < 0.01), compared to ETOH, and (+p <0.05; +++p <0.001) compared to 5 μM HCB.
To analyze if pSMAD 2/3 is involved on the proliferative effect of TGF-β1 induced by HCB, we evaluated pSMAD 2/3 levels in HCB-treated cells as well as after inhibiting TGF-β1 type II receptor. In a similar manner, pSMAD 2/3 protein levels were increased by HCB 5 μM (83%) and decreased when treating HepG2 cells with the TGF-β1 inhibitor. The 0.5 μM dose had no effect while the 1 μM dose reversed it completely (Fig. 8B).
We further addressed whether TGF-β1 signaling contributes to HCB effects on D1 mRNA expression. Our results showed that the TGF-β1 inhibitor prevents the HCB-induced decrease on D1 mRNA (Figure 8C). Finally, we investigated the effect of TGF-β1 signaling on the expression of the cell cycle regulatory proteins, p21 (Fig. 8D) and p27 (Fig. 8E). The results showed a decrease in the expression of both proteins upon HCB treatment with respect to ETOH (46 and 48%, respectively) and that such effect was mediated by TGF-β1.
Discussion
HCC becomes a global health problem as its incidence in creases. Given the limited therapeutic options for the treat ment of HCC, it is mandatory to find effective therapies for this tumor. To do this, the elucidation of mechanisms involved in its pathogenesis is a priority.
There is a clear relationship between liver pathologies and endocrine disruptors. The environmental pollutant HCB is an endocrine disruptor. Its tumoral promotor effect on liver of rats and mice has been demonstrated using chronic treatment trials; however, the molecular mecha nisms that trigger these events are still unclear25.
The objective of this work was to investigate the alterations in key molecules involved in the regulation of cell growth, in a model of induction/promotion of rat liver tumors and in HepG2 and Huh-7 cells treated with the endocrine disruptor HCB. Deregulation of TH homeostasis has been proposed as an important initial step in the neoplastic transformation process and subsequent tumor progression26. However, there is not enough data for a complete understanding of this process.
Assuming that HCB is an endocrine disruptor, we speculated that dysregulation of TH homeostasis in the liver may play an important role in the generation of hepatic preneoplastic foci27. In this study, we have shown that HCB decreased T3 and increased T4 concentrations in the liver. These findings are consistent with other authors that demonstrated that treatment with T3 or TH receptor agonists reduce the number of preneoplastic foci in rat livers28. These results and other observations made by other authors show the way T3 leads to a more normal phenotype. However, in this work we show that a decrease in D1 expression and an increase in D3 expression is the origin of this decrease in T3 tissue levels by regulating its intracellular concentration. Sabatino et al. reported in 2000 low levels of D1 expression in HCC compared to normal tissue28. Local control of TH signaling provided by regula tion of D3 activity has also been shown to be associated with the development, progression, and recurrence of cancer in other tissue types22.
D3 is undetectable in most mature tissues including the liver; however, robust D3 reactivation has been docu mented in many disease states15. In the present study, we demonstrated that D1 protein and mRNA expression were decreased, while D3 protein and mRNA increased in rat liver, consistent with the reduction in T3 tissue concentra tion observed in this group. Similarly, we have also shown that D1 expression levels are decreased in HepG2 cells. It should be noted that although HCB decreases D1 mRNA levels as well as protein levels, the degree of significance in the dose of 5 μM of HCB varies between both expression levels. This suggests an effective but differential action between mRNA and protein levels consistent with the expected actions of toxic endocrine disruptors. When we analyzed the effect of toxics on D1 expression in another cell type, Huh-7, we determined that the expression also decreases although the level of sensitivity for this cell line is lower. Only the two highest concentrations produced this decrease, presenting similar impact both at mRNA and protein levels. These findings suggest a link between deiodinase-mediated TH metabolism and HCB-induced cell proliferation. Other authors have also reported that with local hypothyroidism, a regulation of T3/TRβ re ceptor expression may contribute to the progression of preneoplastic lesions to HCC14,30. However, our results show that adding exogenous T3 to HCB treated HepG2 cells may prevent the increase observed in PCNA levels by HCB, unlike adding exogenous T4, which appears to have no impact. This is probably due to the decrease in the expression of mRNA as well as of the protein levels of D1 responsible for generating T3, a biologically active hormone, which negatively regulates cell proliferation. This appears to confirm the involvement of TH in the regulation of cell proliferation. Even though most studies showed a protective action of TH on HCC progression, other studies showed that T3 action on TR may increase HCC aggressiveness and that somatic point mutations of TRα and TRβ may increase its frequency31.
Unfortunately, most of the studies were performed in rats, mice or in vitro and human studies are very few. As far as we know, only one study reported human data showing that D1 expression was significantly lower and that D1 mRNA levels were reduced in human HCC pa tients compared with normal liver samples32. In the same study, serum T3 levels were decreased in HCC patients when compared with healthy individuals32.
Extensive evidence shows that endogenous or exog enous cytokines appear to block hepatic D1 activity in the HepG2 cell line33. Members of the TGF-β family control cell growth and regulate TH signaling. In this study, we have shown that HCB induces TGF-β1 expression in focal areas of rat liver from the DEN+HCB-treated group, as well as in HepG2 cells. It should be noted that the number of foci, as well as their size, increases significantly with HCB and this correlates with the increase in TGF-β1 expression in the foci. Other authors have also reported the involve ment of TGF-β1 in hepatic carcinogenesis, but none so far has linked this cytokine with deiodinases34. Our results showing that TGF-β1 inhibition prevents HCB-induced PCNA protein and pSMAD expression in HepG2 cells, demonstrate that the TGF-β1/SMAD signaling pathway is implicated in cell proliferation in our model. On the other hand, we demonstrated an increase in TGF-β1 and a decrease in D1 expression at the same treatment concentrations, and the inhibition of TGF-β1 impairs the effect on the expression of D1 mRNA. These results, together with the T3 reversal of induced cell proliferation, suggest that D1 might be involved in this cell proliferation process. To advance the probable mechanism of action of the downstream toxic, we studied the role of TGF-β1 at the levels of two of the negative cell cycle regulatory proteins p21 and p27. Inhibition of TGF-β1 reversed the decrease generated by HCB in p21 as well as in p27 at the same inhibitor concentrations that reversed the effect on PCNA, pSMAD, and D1 levels. These observations agree with those of Huang et al., confirming a link between TGF-β1, T3 and cell proliferation35.
In summary, in this study we have shown a relation between the expression of TGF-β1, D1, and D3 as well as local TH concentration in hepatocarcinogenesis in rat liver. Furthermore, we have shown that TGF-β1/pSMAD is involved in cell proliferation as well as D1 mRNA, p21, and p27 expression in HepG2 cells (Figure 9). These results suggest that TH metabolism plays a critical role in hepato carcinogenesis involving D1 and TGF-β1/pSMAD molecules.
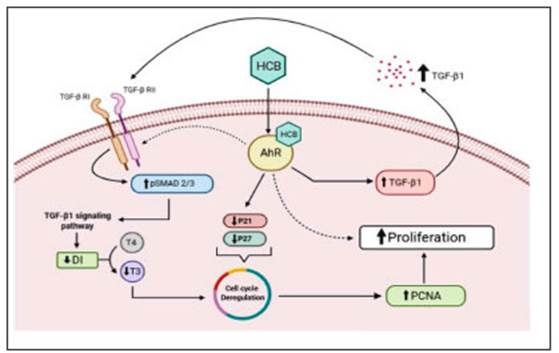
Fig. 9 Role of p21, p27, TGF-B1, pSMAD, D1, and T3 in the proliferative effect generated by HCB. HCB alters cell cycle regulatory proteins, decreases the expression of p21 and p27. On the other hand, it activates TGF-B1 / pSMAD 2/3 signaling, decreasing the expression of D1, which generates a decrease in the T3 pool. In this way, the negative regulation of T3 on the cell cycle is eliminated. Together, these processes favor the increase in cell proliferation evidenced by the increase in the expression of the PCNA protein

