


 Inglês (pdf)
 Artigo em XML
 Referências do artigo
 Enviar este artigo por email
 Citado por SciELO
  Similares em
SciELO
Similares em
SciELO 
 Permalink
Introduction
Tsunamis have been causing significant damage to the life and economy of vulnerable coastal regions. Many warning mechanisms like the DART (Data Assessing and Reporting of Tsunami) system have been established to eva-cuate people in time. But, as seen from the ear-lier tsunamis, the damage to the coastal struc-tures is also very important. Tsunami loads on structures have become a significant topic of research in recent years.
Extensive research has been conduc-ted on tsunami loads on significant structures like bridges and dams. One such work by Azadbakht and Yim (2015) calculates tsunami loads on bridges using simulations separately with initial impact and full inundation. Another effective approach to evaluate design equations for hydrodynamic loading conditions is quantifying the failure analysis of several buildings. Chock et al. (2012) adopted this approach in his Tohoku Tsunami-induced building damage analysis. Tsunami-induced hydrodynamic forces on infrastructure located in the vicinity of the shoreline were carried out by Nistor et al. (2009) for different inundation depths. In yet another experimental investigation Nouri et al. (2010) estimated the tsunami impact on free-standing structures of different shapes. The bores similar to the ones generated in the recent observed in the recent tsunami were generated by Palermo et al. (2012) using the dam-break process to generate turbulent hydraulic bores and studied the tsunami-induced forces and changes in bore depth and bore velocity by experimenting with different structures.
The calculation of tsunami loads is usually not done to small-scale structures. Also, the damage to the land, due to water salinity is pretty significant, hence the need for a reduction in inundation. Researchers are working to reduce the inundation through the study of the impact of hydrodynamic forces on clas-sical coastal protection works (breakwaters, seawalls, reefs, etc.). An experimental study of tsunami waves acting on prevention structures along the coast such as seawalls and breakwa-ters is carried out by Mizutani and Imamura, (2001). Kunkel et al., (2006) research on redu-ced tsunami impact due to coral reefs explains how a small change along the coast can reduce the drastic damage to the coast.
Study AreaThe study area, Pondicherry, is situated on the east coast of India, between 79.87°E and 79.79°E longitudes and 12.05°N and 11.75°N latitudes. Figure 1 shows the location of the study area. Pondicherry’s average elevation is close to the sea-level, and several sea inlets, referred to as “backwaters” are present. This coastal zone is largely low-lying with a gentle slope, thus making it highly vulnerable to inundation. Narayanan et al. (2015) using the depth profiles along the shore iden-tified the Pondicherry Canyon and the bathymetry at Pondicherry is having a gentle slope of 0 to 25m (at 12 km from the shoreline). A maximum water depth of 300m is observed at 21km from the shore near the Pondicherry Canyon. The vulnerability assessment of the Pondicherry coast is carried out by Murali et al. (2013) and as it is a coastal city, a lot of studies on the Pondicherry coast from a tsunami point of view are carried out, Murthy (2016) and Anandabhaskaran et a/.(2017).
Materials and MethodsIn this paper, a study is done at three regions of Pondicherry Coast - Auroville Beach, Beach Road, and Paradise Beach. Due to va-riation in topography, the difference in run-up height and inundation extent are studied. Another study has been done on a certain region that experienced very little or no inundation during the 2004 Indian Ocean Tsunami. This región called the Beach Road shows accumulated rock boulders along its coast. During this tsunami, the boulders stopped the run-up waves from further going inland. So, it is assumed that the boulders act as a sea-wall to reduce the impact of tsunami waves. A sea-wall with a similar height as rock boulders is considered along the Beach Road and simulated for the 2004 Indian Ocean Tsunami scenario. Also, the forces of the tsunami waves are calculated on the sea wall. Thereby claiming that the boulders act as an excellent sea wall. The methodology flowchart is given in the figure 2.

Figure 1: Location of the study area - Pondicherry / Figura 1. Ubicación del área de estudio - Pondicherry.
Topographic and Bathymetric DataThe three study regions of the Pondicherry coast are (I) Beach Road, (II) Auroville Beach and (III) Paradise Beach. CMAP data for the Pondicherry coast is digitized (3 arc-seconds or 90 meters resolution) and field data of the height of boulders on the Beach Road is incor-porated in it to get the bathymetric data. This is merged with the SRTM data (for the topography of study area, 90m DEM) and GEBCO data (450 m DEM) and is used to form the nested grids for the TUNAMI N2 code. Beach roads 1, 2 and 3 are the three locations considered to calculate the forces at those locations. Auroville Beach is located in the northern region; Beach road is in the central part while Paradise beach is situated in the southern part of the Pondicherry coast.
Figure 3 shows the bathymetry and topography of the study region and the locates all the three beaches. It is observed that Paradise Beach (Figure 6) has a relatively flat coast compared to the steep slope of Auroville Beach (Figure 4). This causes the run-up wave to go higher in the Paradise beach as compared to Auroville beach. The rock boulders along the Beach Road are shown in figure 5. For all three different beaches, the tsunami wave heights and the extent of inundation are computed.

Figure 2: Methodology flowchart adopted for this study. / Figura 2. Diagrama de flujo de la metodología adoptada para este estudio.
Earthquake Source Parameters
The Andaman-Sumatra is currently one of the most seismically active regions in the world. The 26th December 2004 Sumatra ear-thquake of Mw 9.1 along the subduction zone between the Indian plate and Burmese plate triggered a tsunami causing large-scale devastation in the coastal cities across the Indian Ocean. In our study, we divided the entire Andaman-Sumatra subduction zone into five seg-ments and computed the seafloor upliftment at t=0 seconds separately by considering a different set of fault parameters for all the segments and the fault parameters used in this study are given in table.1. Figure 7 shows the initial waves in the five segments.
TUNAMI N2The objective of tsunami modeling research is to develop analytical and numerical models for faster and more reliable forecasts of tsunami source generation propagation and run-up/inundation through the ocean and striking coastal communities. Several codes to compute the tsunami propagation and inundation have been developed by various tsunami groups - MOST (Method of Splitting Tsunami), ANUGA (ANU- Australian National University, GA- Geoscience Australia), FUNWA-VE (Fully Non-linear Wave Equations), etc. Several researchers discussed the theory of tsunami waves in the literature (Imamura, 1996; Imamura et al., 2006; Yalciner et al., 2005).
In this paper, TUNAMI-N2 (Tohoku University’s Numerical Analysis Model for Investigation of Near-field tsunamis, No.2) code is used to simulate the past tsunamis and possible scenarios of tsunami genic earthquakes in the Indian Ocean to assess the hazard and impact on the coastal cities along the east and west coast of India. This code was developed by Fumihiko Imamura (1996) and further modified by Yalciner et al. (2005) and uses a finite difference technique based on Stag-gered Leap-Frog scheme. This program is used to model tsunamis which are generated by the move-ment of the sea bottom due to earthquakes.
Table 2: Source parameters of 2004 Sumatra earthquakes (after Ioualalen et d, 2007). / Tabla 2. Parámetros de fuente de los terremotos de Sumatra de 2004 (según loudakn et al., 2007).
Initial condition:
The initial sea bottom deformation is necessary to obtain the initial surface wave. A complete set of closed-form analytical expressions to obtain the internal as well as surface deformation is given by Mansinha and Smylie method (Mansinha and Smylie, 1971). The information about the earth-quake source parameters such as fault length, the width of the fault, focal depth, the angle between N & fault axis, dip angle, slip angle, and displace-ment is needed to compute the deformation at the source. Once the initial wave is generated one of the wavefronts would start moving toward the deep ocean and one moving toward the local shoreline. Wave Propagation and Simulation:
Tsunamis waves are usually resolved using 2D hydrostatic models (Imamura et al, 2006) and mathematically it is expressed as
∂η/∂t+∂M/∂x+∂N/∂y=0
∂M/∂t+∂/∂x (M^2/D)+∂/∂y (MN/D)+gD ∂η/∂x+(gn^2)/D^(7⁄3) M√(M^2+N^2 )=0
∂N/∂t+∂/∂x (MN/D)+∂/∂y (N^2/D)+gD ∂η/∂x+(gn^2)/D^(7⁄3) N√(M^2+N^2 )=0
In the above equation, M and N are ex-pressed as
M=u(h+η)=uD and N=ν(h+η)=νD
where D is the total water depth given by h+n, t is time, h (x, y) is unperturbed depth, g is the gravitational acceleration, u and v are compo-nents of the horizontal velocities, M and N are the discharge fluxes in the x- and y- directions.
A finite-difference technique based on the Leap-Frog scheme is used to solve the tsuna-mi wave propagation and a code is developed TUNAMI-N2 by Imamura et al. (2006). The formulation uses the central difference method with a second-order truncation error.
Boundary conditions:
The boundary conditions are free trans-mission (open boundary conditions) in the open sea and the perfect reflector on land are the two associated boundary conditions.
Results and Discussions
In the present study, the Sumatra tsunami is simulated to assess the inundation along the Pondicherry coast. The TUNAMI N2 code is used in quantifying the tsunami propagation, arrival times, run-up, and inundation extents. Tsunami wave propagation at different time intervals is shown in figure 8. Tsunami directivity is computed and is shown in figure 9. Directivity map for the tsunami is computed by several researchers and run up and inundation extents along different coastal areas are computed (Swaroopa et al, 2011).

Figure 3: Topography and Bathymetry map of the study area showing the locations of the three beaches which are considered for the study / Figura 3. Mapa topográfico y batimétrico del área de estudio que muestra la ubicación de las tresplayas consideradaspara el estudio.
The run-up above mean sea-level along the entire Pondicherry coast is shown in figure 10. The maximum runup and inundation extent at different locations is given in table 2. An increase in wave-heights is observed towards the southern region of the coast. Inundation is the highest around Paradise beach and very low or no inundation is observed along the Beach road.
The wave heights along the Auroville Beach (2.5m approx.) are smaller than the Paradise Beach (3.5m approx.). The Auroville beach which is along the northern part of the coast has a very steep slope towards the sea (Figure 4). This clearly explains the decrease in wave heights and inundation near the beaches compared to the Paradise beach (Figure 6).
Another study is made for understanding the effectiveness of having rock boulders along the coast for reducing the tsunami impact on the coast. The Beach road (Figure 5) is the most populated region along the entire Pondicherry coast. It consists of various buildings and structures and they are located very close to the coastal line, making them the most vulnerable region in case of a tsunami. The rock boulders lined along with the coast act as a sea wall. As explained earlier, we calculate forces assuming a sea wall instead of the boulders along the Beach road. Tsunami waves running up the shoreline exert surge force on a structure in its path and the surge force per unit width is given by Dames & Moore (1980) as
F/w=4.5ggh^2
where p is the density of water, g is the accele-ration due to gravity, and h is the wave height.
Force per unit width is plotted with respect to time (Figure 11). It is observed that the force per unit width of the order 105N/m. The maximum impact is observed around four hours after the earthquake. Construction of a seawall is an involved and expensive affair. Thus an array of rock boulders as shown infigure 5 can be used instead of a seawall. Also, boulders allow slight movement within the structure even though they are complexly pac-ked and change their arrangement when expe-riencing marginally higher force. Whereas, a seawall might get destroyed and would require refurbishment.
Table 3: Water depths at different locations with máximum tsunami wave heights and inundation. / Tabla 3. Profundidades del agua en diferentes lugares con alturas máximas de olas de tsunami en estos lugares a lo largo de la costa de Pondicherry.
Conclusions
The assessment of tsunami hazard along the coast of Pondicherry is the focus of this study. In the event of a tsunami, the difference in topography and bathymetry of the two bea-ches (Auroville and Paradise) results in different wave heights and inundation. The steep slope along a beach causes the wave to lose its height and energy, resulting in lesser wave-heights and inundation extent. This is observed at Auroville Beach which has a steeper slope as compared to Paradise beach and has lesser wave-height and inundation.

Figure 4: Auroville Beach showing a steep slope. / Figura 4. Aumille Beach mostrando una pendientepronunciada.

Figure 5: Beach Road showing rock boulders all along the coast which acted as a sea wall. / Figura 5. Beach Roadmostrando cantos rodados a lo largo de la costa que actuaba como un malecón.

Figure 6: Paradise Beach showing a flat coast. / Figura 6. Paradise Beach mostrando una costa plana.

Figure 7: Wave-heights (Initial upliftment) at t-0 after the earth-quake. / Figura 7. Alturas de las olas (levantamiento inicial) en t = 0 después del terremoto.
The computed forces per unit width for the sea-wall are of the order 105N/m. The-se forces can be valuable input in designing a sea-wall. A similar study can be done for other populated locations to build sea-walls. Also, it can be concluded that these forces did not do any damage to the rock boulders.

Figure 8: Tsunami wave propagation along the Indian Ocean. / Figura 8. Propagación de ondas de tsunami a lo largo del Océano Indico.

Figure 9: Tsunami directivity map for the 2004 Sumatra tsunami showing the máximum wave heights. / Figura 9. Mapa de direcúvidad del tsunami para el tsunami de Sumatra de 2004 que muestra las alturas máximas de las olas.
The rock boulders present along the Beach Road act as a sea wall and protect this region from inundation by dissipating the incoming energy of the wave. In the case of an actual sea wall, it can be easily destroyed by tsunami waves when compared to the rock boulders as the total impact energy is directly taken by the wall. Whereas, the irregular shapes of the boulders play a significant role in dissipating the flow energy of the wave gradually over a very short distance. The surface of the boulders de-flects the wave locally in various directions and nullify the net force applied by the tsunami wave. Eventually, the surge wave breaks and loses its velocity. Hence, no inundation or a slight overflow is observed.
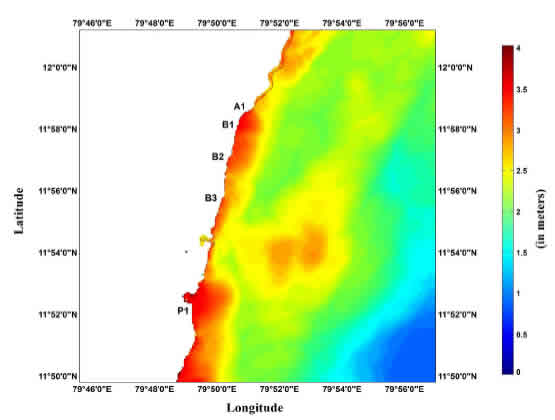
Figure 10: Run-ups along the coast of Pondicherry with the maximum run-up of about 4m near Paradise Beach. / Figura 10.

Figure 11: Tsunami Force per unit width with respect to time computed at three different locations along the beach road where the boulders acted as a sea wall. / Figura 11. Fuerza del tsunamipor unidad de ancho con respecto al tiempo calculado en tres lugares diferentes a lo largo del camino de aplaya donde los cantos rodados actuaban como un malecón.

