


 Inglês (pdf)
 Artigo em XML
 Referências do artigo
 Enviar este artigo por email
 Citado por SciELO
  Similares em
SciELO
Similares em
SciELO 
 Permalink
INTRODUCTION
Heart failure (HF) affects 1-2% of the adult popula tion. It has been typically divided into two phenotypes based on the left ventricular ejection fraction (LVEF): HF with slightly reduced or preserved LVEF, and HF with reduced LVEF (HFREF). Cardiac resynchronization therapy (CRT) is mostly indicated for patients with HFREF and major cardiac remodeling, dilated chambers, and impaired ventricular conduction, both closely related to poor prognosis. 1-5
CRT intends to correct cardiac dyssynchrony by stimulating both ventricles and achieve a more physiological activation and contraction. 6,7 From 25% to 50% individuals with a >120-msec QRS complex have HFREF, and 15-27% experience complete left bundle-branch block (LBBB). 8-10 Maximum benefit has been observed in addition to medical treatment in symptomatic patients with New York Heart Association (NYHA) functional class (FC) II-III, with sinus rhythm and LVEF ≤35%, a QRS longer than 150 msec, and LBBB morphology. 1,2
This technique has shown the ability to optimize cardiac function and reduce chamber dimensions (reverse remodeling), improve symptoms, anticipate a better condition, and reduce HF hospitalizations and deaths when the patient has been properly screened. 11-15 The degree of reverse remodeling has been directly associated with reduced mortality and hospitalizations. 16-18 To evaluate response (even with heterogeneous definitions), different clinical parameters are used, such as an improved NYHA FC, HF hospitalization rate, and deaths. The most common technique to measure the structural and functional impact is the echocardiography, which is used to estimate the presence and extent of reverse modeling in LV dimensions, generally through end-systolic volume and LVEF improvement. A 15% or higher reduction in ventricular volumes or diameters and at least a 10% increase in LVEF is considered a “positive” response (despite variable cutoff values, according to the regis try). The term “hyper-responders” refers to patients with a ≥30% reduction in ventricular volume, or a bet ter systolic function with LVEF >50%. These patients are less likely to be hospitalized because of HF and have a longer survival. 19
Despite these considerations and multiple technical improvements relative to imaging tests, implantation technique, and availability of more modern and reliable devices, 20% to 40% of patients do not show a favorable response to CRT (non-responders).
This leads to a concern for new and more accurate markers of response, which are easy to access and read. 16,20 The so-called reverse electrical remodeling has been described as another potential tool to measure response to CRT; it leads to reduced QRS, and decreased native (intrinsic) ventricular activation time. 21-23 However, very few reports evaluate its practicality, and there are controversial data on their association with clinical and structural response, though it has been mostly associated with structural remodeling and has even been suggested as a rapid, easy, and low-cost parameter to predict a positive response to CRT. 24-27 Our experience intends to evaluate electrical remodeling as a potential parameter of response in patients under CRT.
OBJECTIVE
To analyze intraventricular reverse electrical remod eling as a parameter of response to CRT in individuals implanted at least 6 months ago.
METHODS
Population
The study enrolled living patients with chronic HF treated at the Centro Cardiovascular Universitario del Hospital de Clínicas de Montevideo from 2015 to 2021 by implanting a cardiac resynchronizer, with or without an associated defibrillator (CRT-D and CRT-P respectively), within at least 6 months. All patients had permanent complete LBBB at the time of CRT. Complete LBBB was defined according to AHA/ACCF/HRS recommendations. 28 All patients were in NYHA FC II or III at the time of implantation, and a CRT indication based on the guidelines of the European Society of Cardiology. 1,2
Patients with a pacemaker or with no sinus rhythm at the time of implantation or follow-up, or patients with a resynchronizer implanted as an upgrade to a pacemaker with previous right ventricular stimulation were excluded. Patients with a non-complete LBBB QRS morphology, such as complete right bundle-branch block (RBBB), were also excluded. 1,2 After meeting inclusion and no exclusion criteria, 23 patients were enrolled. Figure 1 shows the study design.
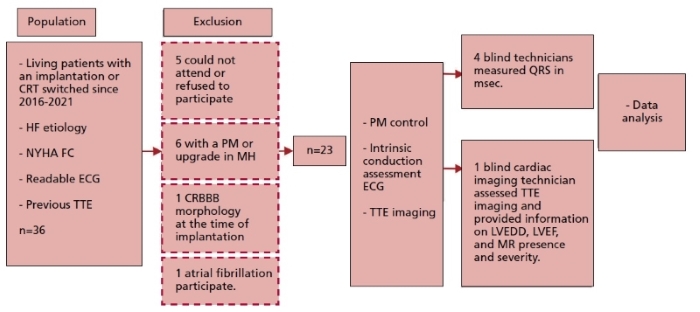
Fig. 1 Study design. CRBB: complete right bundle block. CRT: cardiac resynchronization therapy. ECG: electrocardiogram HF: heart failure. LVEDD: left ventricular end-diastolic diameter. LVEF: left ventricular ejection fraction. MH: medical history. MR: mitral regurgitation. NYHA: New York Heart Association. PM: pacemaker. TTE: transthoracic echocardiography
Clinical variables
Clinical data, structural and functional ECGs were collected at the time of implantation based on each patient’s medical history and procedure report. In addition, data from outpatient follow-up (Figure 1) were collected, including a brief case history on subjective clinical improvement after CRT, current NYHA FC, and details on the pharmacological treatment.
Device control, records, and surface ECG measures
Based on each patient’s medical history, the most recent ECG before the date of CRT implantation was obtained (“pre-CRT” QRS complex, Figure 1). The day when the patient returned for follow-up, the device was followed with programmers. The biventricular stimulation percentage (%BiV) was obtained at the time. There were two new standard 12-lead ECGs per patient, using a FUKUDA DEN SHI CARDIMAX FX-2111 electrocardiograph gauged at a 25 mm/s paper speed and with a 0.1 mV/mm voltage. The first ECG was performed with the CRT device stimulated according to usual patient programming (stimulated QRS). To assess intrinsic ventricular activation (“post-CRT” iQRS), a second ECG was performed 5 minutes after temporary implantation discontinuation, programming the device as an off (ODO) or on-demand (VVI) CRT with a HR of 40 bpm.
After recording, the device was reprogrammed with the patient’s previous setup.
These ECG showed presence or absence of sinus rhythm. Three electrophysiologists and one electrophysiology-trained cardiologist were asked to measure the duration of QRS complexes (msec) with the most representative leads, concealing any data that might identify the patients and ensuring that those measuring QRS complexes ignored CRT response.
Structural variables (TTE)
The transthoracic echocardiography (TTE) report closest to, and before the date of CRT implantation was obtained from the patient’s previous medical history. These reports showed pre-CRT LVEF data, the left ventricular end-diastolic diameter (pre-CRT LVEDD), and the presence and extent of mitral valve regurgitation (pre-CRT MR).
On the day of the new ECG, and after checking the device, each patient had a new TTE performed using ultrasound General Electric Vivid iQ equipment with a 3.5 Mhz transducer, as recommended by the American Society of Echocardiography. Images of two and four chambers apical and left parasternal areas were captured using color Doppler. An echocardiography technician, also blind to clinical data, read the images, estimated the LVEF using the biplane Simpson method (post-CRT LVEF), measured the LVEDD, and defined the presence and severity of mitral regurgitation (post-CRT MR).
CRT response definition
The patient was categorized as a “clinical responder” and/or “structural responder” based on the most common criteria to evaluate response to CRT 13,16,29-31:
• A “clinical responder” is someone with subjective improvement and at least one level improvement (reduction) in the NYHA functional class as compared to the value before the implantation.
• A “structural responder” is someone with reduced LV diameters by at least 15% and/or increased LVEF by at least 10%.
• A “hyper-responder” is someone with reduced LV diam eters by 30% and/or normal LVEF.
Statistical analysis
Normal data distribution was checked using the Ander son-Darling normality test. Continuous variables are presented as mean ± standard deviation (SD), or median and interquartile range (IQR) of 25-75%, as appropriate. Categorical variables are presented with absolute and relative frequencies. To evaluate changes in the continuous variable of interest, iQRS, in response to CRT (pre/post CRT analysis), the t test or Wilcoxon test for paired data was used, as appropriate. Also, behavior of ΔiQRS as a continu ous variable (post-CRT QRS - pre-CRT QRS in msec) was compared in responders vs. non-responders (paired t test or Mann-Whitney test, as appropriate). These analyses were performed for the clinical-structural (CS) response and hyper-response across the sample and certain subgroups of patients (female vs. male, baseline QRS >150 msec vs. <150 msec, females with a baseline QRS >150 msec vs QRS <150 msec, patients with vs without improved MR). A p-value <0.05 was considered statistically significant. All graphical analyses used software Graph Pad Prism, version 9.0.
Ethical considerations
The ethical principles set forth in the Declaration of Hel sinki and latest amendments for research in humans were followed. All patients were called to be informed about the study prior to enrollment. At the time of evaluation in the clinic, each patient gave their written informed consent. The study and informed consent provided to the patients had been previously approved by the Hospital de Clínicas Ethics Committee.
RESULTS
Study population characteristics
A total number of 23 patients were enrolled. Clinical, echocardiographic, implant-related, and electrocardiographic variables are displayed in Table 1.
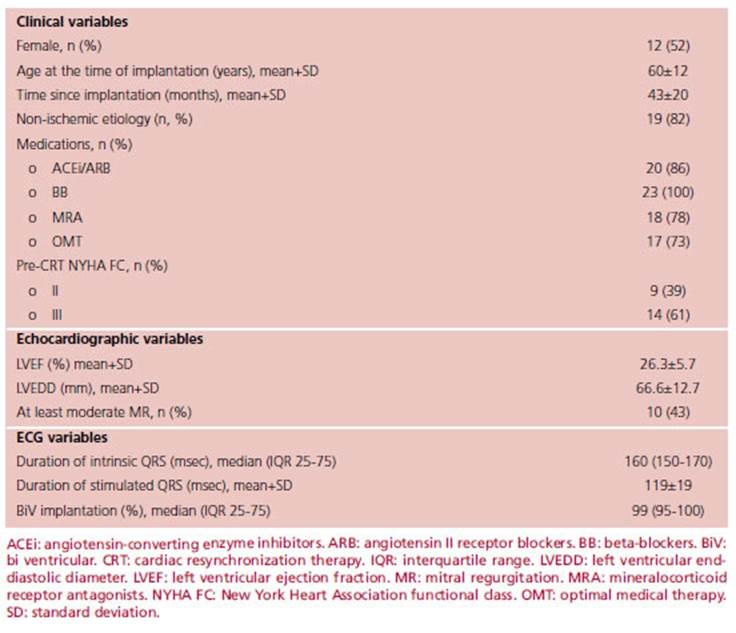
The patients across the sample showed a similar per-sex distribution; 12 were female (52%). Four (18%) patients had ischemic heart disease, and 19 (82%) patients had non-ischemic heart disease. The average age at the time of implantation was 60±12 years, while the age at the time of follow-up was 64±12 years. The mean follow-up from implantation to control was 43±20 months, ranging from 7 to 96 months.
A high rate of treatment adherence was observed among patients; 73% were under simultaneous therapy with beta-blocker (BB), angiotensin converting enzyme inhibitors (ACEi)/angiotensin II receptor blockers (ARB)/sacubitril-valsartan, and mineralocorticoid receptor antagonists (MRA). All patients were receiving BB at the time of follow-up.
The duration of the intrinsic QRS complex prior to CRT was 160 (150-170) msec, and after the CRT, it was 160 (140-160) msec. Nine (39%) patients showed at least a 10 msec reduction in the iQRS duration. Maximum reduction was 40 msec and occurred in three patients. The iQRS increased in eight patients and remained stable in six.
Analysis of response to CRT
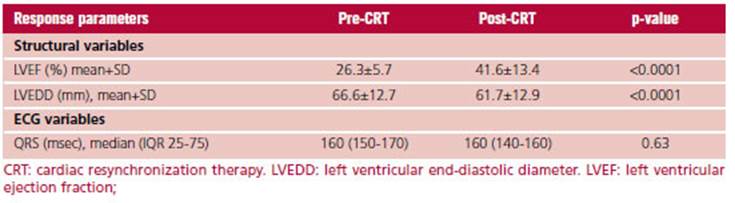
Table 2 shows the characteristics of CRT responders. Twenty-one (91%) patients in our study were “clinical responders”. The ΔiQRS in this group was -4.7±20.4 msec. Structurally and functionally, both LVEDD and increased LVEF showed enhanced response to CRT during follow-up. LVEDD decreased from 66.6±12.7 mm pre-CRT to 61.7±12.9 mm post-CRT, with a higher than 15% reduction in 7 patients (30.4%). LVEF increased from 26.3±5.7% to 41.6±13.4%, with a higher than 10% increase in 16 patients (70%).
Fifteen (65%) patients were considered “responders” based on both structural and clinical criteria. The LVEDD was significantly reduced from 64.6±8.7 mm to 59.8±7.5 mm, and the LVEF increased from a baseline value of 25.5±6.8% to 40.6±9.5% (Table 2). Nine (39%) patients were “hyper-responders”. All of them had clinical response.
As shown in Table 2, the pre- and post-CRT analysis of the total number of patients found that the duration of QRS did not vary significantly following the CRT.
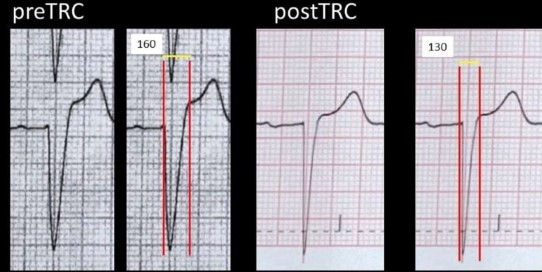
Figure 2 shows a sample case, with iQRS measurements before and after the CRT in a “responder”.
Subgroup analysis
There was a trend in iQRS duration variation after the CRT in the female subgroup, though it lacked statistical significance (p=0.056, Figure 3B). Changes in the duration of iQRS were not higher in those with a baseline QRS of ≥150 msec (p=0.65, Figure 3C). Upon analysis of the subgroup of women with an initial QRS ≥150 msec prior to CRT, significant reduction of the iQRS was observed (p=0.0195, Figure 3D).
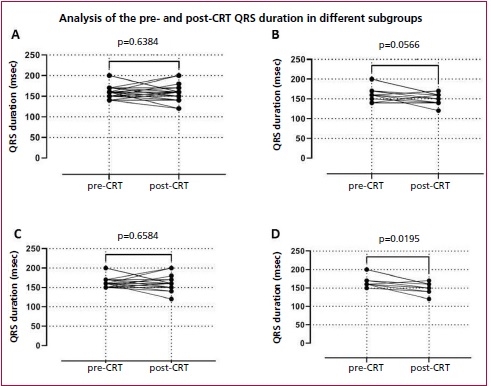
Fig 3. Differences in iQRS before and after the CRT in the entire population (A), the female subgroup (B), individuals with an initial QRS ≥150 msec (C), and women with an initial QRS ≥150 msec (D).
The change in pre- and post-CRT iQRS duration was unrelated to the non-ischemic etiology (p=0.72) or to age (p=0.78).
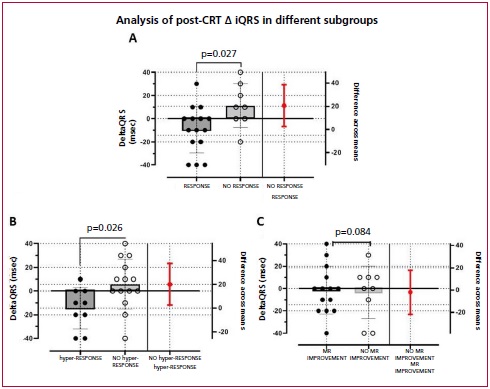
The ΔiQRS was -9.3±20.7 msec among clinical-structural “responders,” and 11.25±18.9 msec among non-responders (p=0.027). This difference was slightly larger among “hyper-responders,” with a ΔiQRS of -14.44±17.40 msec (p=0.026). There was no significant association of ΔiQRS with MR improvement (p=0.84). (Figure 4)
DISCUSSION
To the best of our knowledge, this is the first study to describe reverse electrical remodeling in patients under local and regional CRT.
After CRT, the duration of iQRS was reduced at least 10 msec in nine of the patients, though this lacked statistical significance. In observational studies like ours, QRS reduction was significant and generally associated with increased LVEF. 21 Subgroup analysis shows that ΔiQRS is related to clinical-structural response, more markedly in patients having a “hyper-response” to CRT. Despite sample size limitations, our findings contribute to the hypothesis that a shorter QRS leads to an improved intraventricular conduction system, and therefore, reverse LV remodeling. Further investigation is required to assess this hypothesis.
We showed a tendency towards stronger electrical remodeling in women with a wider baseline QRS. This is consistent with traditional response definitions. 1,31-33
Mechanisms resulting in reverse electrical remodeling are not fully known. It might be said that improvements in the size of chambers favor faster conduction upon myocardium contraction. It has also been suggested that this may happen as a result of full or partial recovery of the specialized conduction system itself. 22,33,34 Another possible CRT-related effect is reduced cardiac fibrosis. 35 The underlying question also involves pathophysiological complete LBBB mechanisms and their multiple physiological and anatomical variants, an electrocardiographic pattern that may lead to completely interrupted or delayed conduction across the left bundle branch, which might result in right bundle branch overexpression. 36)
The cutoff point used to define electrical remodeling is even less consistent. Sebag et al. prospectively enrolled 85 patients with CRT indication, and evaluated clinical, echocardiographic, and electrocardiographic variables before and 12 months after the CRT. They found 19 and 18 msec cutoff points, with a sensitivity and specificity of 86/60% and 84/60%, respectively, to associate ΔiQRS with the clinical and echocardiographic response, respectively. Following a multivariate analysis, ΔiQRS ≥20 msec was an independent predictor of the echocardiographic response. 26
We showed a tendency towards a reduced native QRS relative to improved MR, reaching no significance. The study by Karaca et al. found that reverse electrical remodeling is associated with improved MR and geometry of the mitral valve anatomy. 34 According to them, in addition to secondary improvement thanks to the cited ventricular remodeling, reversed papillary muscles dyssynchrony may lead to a major CRT-related benefit, and both clinical and functional enhancement.
Future prospective investigations are required to as sess the clinical, structural and electrical response in seve ral specific subpopulations of patients undergoing CRT, in an attempt to better understand the pathophysiology of its effects. We consider this becomes more relevant and that it will merit new studies to know if the reverse electric remodeling is similar or more accentuated in the era of stimula tionof the specific conduction system. 37,38

