


 Inglês (pdf)
 Artigo em XML
 Referências do artigo
 Enviar este artigo por email
 Citado por SciELO
  Similares em
SciELO
Similares em
SciELO 
 Permalink
Echocardiography, as well as the different cardiac im aging techniques, has significantly evolved in the last decades.
Ultrasound machines and software continue to amaze us both in the medical setting as in biomedical engineering.
For a long time we dedicated our attention to the study of the cardiac structure and its impact on velocities, pressures and gradients. We were able to assess myocardial deformation and early predict the involvement of the left ventricular pump function, and numerous scientific studies were published correlating anatomo-functional disorders with clinical scenarios.
At present, we have the immense possibility of evaluating the inverse relationship. That is, what happens to our heart when fluid dynamics are altered and the energy this generates. Although this type of evaluations can be performed with 3D resonance imaging, this is not always available for routine practice. On the other hand, there are similar methods of intracardiac fluid analysis, but they require the use of contrast material, are dependent on the angle or can only be used with transesophageal echocardiography. 1
Until recently, the evaluation of fluid dynamics with conventional ultrasound machines was done with spectral and color Doppler tools. However, these methods present the limitation of velocity analysis only parallel to the direction of the ultrasound beam, and the rest of the components of the complex intracavitary flow analysis could not be evaluated through this modality. 1
In order to understand this technology, it is useful to perform a review of some concepts related to fluid dynamics, and vector and scalar fields.
Upon making a closer evaluation of intracardiac flows by echocardiographic assessment with transthoracic transducer, we can incorporate a blood flow vec tor map and observe that within the cardiac chamber it runs in more than one direction.
As can be seen in Figure 1, the blood that passes through the mitral valve to enter the left ventricle generates a ring of vortices which, if selected and analyzed in the bidimensional plane, show that some rotate in a clockwise and others in a counterclockwise direction. 1
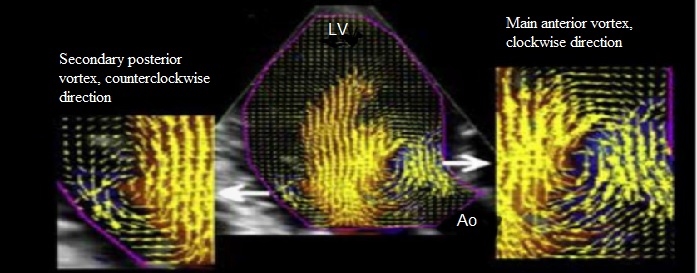
Fig. 1 Vector mapping illus trating the different rotational behavior of anterior and posterior vortices.
In the case described, vortices rotate in a counter clockwise direction in the space between the posterior leaflet of the mitral valve and the left ventricular pos terior wall. On the other hand, at the left ventricular outflow tract higher magnitude vortices rotate in a clockwise direction.
To understand this phenomenon, we believe it is adequate to define some central concepts
Vortices: physical magnitude used in fluid mechanics to quantify rotation, given by a rotational vector. 2
Direction of rotation and angular velocity: If an object is rotating in two dimensions, it is possible to completely describe the rotation with angular velocity. A positive angular velocity indicates that the rotation is counterclockwise, whereas a negative value indicates that the rotation is clockwise. 2
However, the situation is somewhat more complex for intracardiac flow. It is necessary to represent both the angular velocity as the three-dimensional space direction in which the cardiac flow is rotating. To achieve this, the rotation in three dimensions is nor mally described using a rotational vector where both the vortex magnitude and direction are represented. To evaluate the vortex direction in a simple way, the “right-hand rule” is used. What does it consist of? The right-hand fingers are curled in the direction of the rotation and the thumb is extended. The vector that represents this rotation in three dimensions is, by definition, oriented in the direction of this finger. 2
Another important point to consider is how a velocity vector map is generated. This technique is derived from the use of two modes, which have been very useful in echocardiographic assessment in the last years: color Doppler and left ventricular deformation assessment by speckle tracking. As previously mentioned, color Doppler only provides the velocity parallel to the ultrasound axes and, on the other hand, it is possible to obtain the transverse velocities of the left ventricular myocardium by speckle tracking. 3
This means that blood velocity and trajectory within the left ventricle can be represented by means of myocardial transverse velocity vectors as blood flow longitudinal velocity through the color mode.
As seen in Figure 2, another point to emphasize is that having the information of the flow velocity vectors, it is also possible to represent through a parametrization map, the magnitude and direction of vortices generated in a cardiac cycle by means of a color map. 4 By convention, in this map, the vortices that rotate in a clockwise direction are represented in blue, and those that rotate in the opposite direction, in red
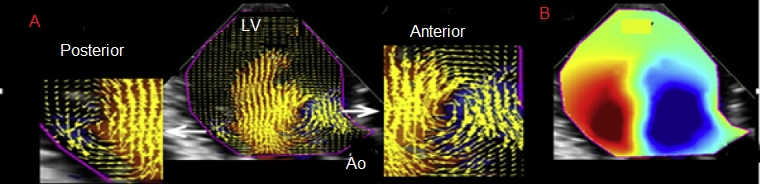
Fig. 2 To the left (A), vortices’ vectorial field map generated in the left ventricle. To the right (B), vortices’ magnitude and direction parametrization map
In addition, thanks to fluid velocity vectors and blood density and viscosity values, it is possible to represent a third map of kinetic energy to study the higher levels of energy generated in the left ventricle denoted in red. In a healthy patient, the highest levels of energy directly proportional to velocity variations are in the left ventricular outflow tract. In dilated cardiomyopathy, the kinetic energy analysis shows that the highest levels of energy are far from the left ventricular outflow tract, at the ventricular apical level. Then, by knowing the kinetic energy, it is possible to assess energy dissipation. This variable has been very useful to monitor healthy and ill persons, and it has been shown that patients with dilated cardiomyopathy present lower values of energy loss compared with healthy individuals (Figure 3). 4
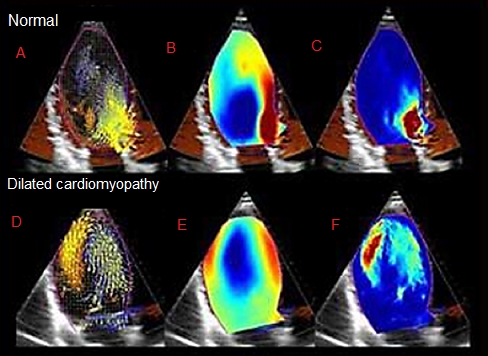
Fig. 3 Panels A and D exemplify the representation of the flow velocity vector data map, in which a 2D velocity vector field is represented as overlaid vectors in the traditional CFM (Color Flow Mode). Panels B and E show a circulation parametric map, in which vortices are represented as compact regions colored in blue (clockwise vortex rotation) or red (counterclockwise vortex rotation): Panels C and F provide representations of kinetic energy maps
Possibly, the greatest clinical experience with this technique is in left ventricular systolic function impairment.
An interesting work presented by the group of the University of Padua led by Dr. Donato Mele could show the differences present in the dynamics of intracavitary flow among healthy individuals and patients with heart failure. 5 It was seen that the study was feasible and the differences present in the different evaluation parameters of intracavitary flow dynamics were reproducible, therefore providing relevant scien tific support to consider it as a highly useful tool.
The diverse clinical scenarios in which the anatom ical geometry can be affected probably impact on fluid dynamics. An example is supplied by coronary heart disease and transmural acute myocardial infarction: here the extent of infarction and left ventricular systolic function can be considered. Consequently, with this variable, it has been possible to demonstrate the relationship between the extent of the ischemic event, regional dysfunction and left ventricular systolic function with intraventricular turbulence and the fluctuation and dissipation of kinetic energy, a phenomenon that makes a significant difference in the analysis and interpretation of the consequences and implications of these events. 6
Heart valve disease as well as valve replacement have also been evaluated with this technology, and changes have been shown in the sense of vortex ro tation in dual-leaflet mechanical valves. The kinetic energy dissipation parameters are greater in patients with valve replacement compared with healthy ones. 7
Cardiac resynchronization therapy 8 hypertrophic cardiomyopathy, 9-11 atrial fibrillation 12 and the detection of apical thrombi 6 have also been analyzed with this technology, which offers a novel as pect in the anatomo-physiological explanation of cardiovascular disease.
Once again, the association of technological and cardiology progress demonstrates that joint work defines a course where the goal is the optimization of patient diagnosis.

