


Serviços Personalizados
Journal

Artigo
 Inglês (pdf)
 Artigo em XML
 Referências do artigo
 Enviar este artigo por email
Indicadores
-
 Citado por SciELO
Links relacionados
-
 Similares em
SciELO
Similares em
SciELO
Compartilhar

 Permalink
Papers in physics
versão On-line ISSN 1852-4249
Pap. Phys. vol.3 no.1 La Plata jun. 2011
Plasmon-enhanced second harmonio generation in semiconductor quantum dots cióse to metal nanoparticles
Pablo M. Jais,1,2* Catalina von Bilderling,1,3* Andrea V. Bragas1,2*
*E-mail: jaisp@df.uba.ar
.E-mail: catalina@df.uba.ar
^E-mail: bragas@df.uba.ar
Instituto de Física de Buenos Aires, CONICET, Argentina.
Laboratorio de Electrónica Cuántica, Departamento de Física, Facultad de Ciencias Exactas y Naturales, Universidad de Buenos Aires, Intendente Güiraldes 2160, Pabellón I - Ciudad Universitaria, Buenos Aires, C1428EHA, Argentina.
Centro de Microscopías Avanzadas, Facultad de Ciencias Exactas y Naturales, Universidad de Buenos Aires, Argentina.
We report the enhancement of the optical second harmonio signal in non-centrosymmetric semiconductor CdS quantum dots, when they are placed in cióse contact with isolated silver nanoparticles. The intensity enhancement is about 1000. We also show that the enhancement increases when the incoming láser frequency u is tuned toward the spectral position of the silver plasmon at 2cj, proving that the silver nanoparticle modifies the nonlinear emission.
I. Introduction
Second Harmonic Generation (SHG) is the second order nonlinear process for which two photons with the same frequency ω interact simultaneously with matter to generate a photon of frequency 2ω. The nonlinear response of a material to an applied field becomes evident in the presence of intense fields, as the one given by a focused pulsed laser.
Due to symmetry requirements for second order nonlinear processes, the leading dipolar term of the SHG is forbidden for centrosymmetric materials. However, this condition is relaxed at surfaces, where the symmetry is broken. On the other hand, for a small and perfectly spherical particle of any type of material under homogeneous illumination, the SHG from the surface is also zero since the geometrical shape recovers the symmetry [1].
The presence of inhomogeneities in the electro-magnetic field recovers the SHG even for symmetric materials, both from bulk and surface, as pointed out by Brudny et al. [1]. Those inhomogeneities may be, for instance, the consequence of a strong focusing of the field, the proximity of a surface or the presence of another particle. Besides, electronic resonances and enhancement of the field around the particle will increase the SHG and, in many cases, would make it detectable.
It is very well-known, as one of the main re-sults of nano-optics, that the field around a metal nanoparticle is confined and enhanced when the incoming wavelength is resonant with the surface plasmons sustained by the nanoparticle. This ef-fect is exploited in many different applications of metal nanoparticles: volume reducers for diffusion measurements [2], optical probes for high resolution imaging [3-5], biosensors [6], nanoheaters [7] and surface enhanced Raman scattering (SERS) [8, 9], among others.
In the present paper, we show the enhancementoí the SHG when non-centrosymmetric CdS quantum dots are placed in cióse contact with silver nanoparticles. The plasmon oí the nanoparticles is resonant at the second harmonio (SH) frequency and enhances the emission. As lar as we know, there are lew works on the enhancement oí SHG (either in semiconductor QDs or in molecules) pro-duced by the resonant excitation oí metal nanoparticles [10-13].

Figure 1: Experimental setup. PMT: photomulti-plier tube; mi to m3: mirrors, 11 to 13: lenses.
II. Materials and methods
The experiment was performed in transmission, by performing spectrally-resolved photon counting (Fig. 1). The láser was a KMLabs tunable mode-locked Ti:Sapphire with 50 ís pulse width, 400 mW average power, 80 MHz repetition rate and tunable in the range 770-805 nm. The resolution oí the monochromator was 2nm in all experiments. Sil-ver nanoparticles (NPs), oí average diameter 20 nm, were synthesized as in Marchi et al. [14], while the CdS quantum dots (QDs), 3nm in diameter, as in Frattini et al. [15].
The absorption spectra for both NPs and QDs in solution are shown in Fig. 2. The arrows mark the first and second excitonic transitions in the QDs, at (362 ± 4) nm and (425 ±15) nm, obtained by the second derivative method [16]. Figure 2 also shows the two-photon photoluminescence (TPPL) spec-trum oí the QDs in solution, excited at A = 780 nm and measured with the setup shown in Fig. 1. A Stokes shift was observed in the TPPL, in accordance with the same effect reported for the (one photon) photoluminescence oí CdS QDs [17].

Figure 2: Absorption (red line) and two-photon photoluminescence, TPPL (red squares), oí the CdS QDs in ethanol solution. The dotted blue line is the extinction oí the Ag NP in aqueous solution.
NP samples were prepared by placing a drop oí the NP solution on a glass substrate until the sol-vent evaporated. The average NP concentration was « 10 partióles per |j.m2. However, optical and SEM images revealed that the metal NPs are inho-mogeneously distributed on the substrate, with a high concentration oí partióles in the fringe (drop boundary).
A CdS QD sample was prepared according to the same protocol. However, the QD solution has a very high concentration oí aminosilanes. They form a thick layer when dried, so the QDs are im-mersed in an aminosilane matrix. The estimated height oí this layer was « 5 |j.m, and the average QD concentration was « 105 partióles per |j.m2 (in-ferred from AFM images taken at a 1:1000 diluted concentration).
For the mixed NP-QD sample, we first dried a drop oí the metal NP solution, and then we de-posited a drop oí CdS QD solution on top oí it. The resulting structure is schematically shown in Fig. 3.

Figure 3: Diagram of trie NP-QD sample.
III. Results and discussion
For the silver NP samples we did not detect SH signal above the noise level of the experiment (of about 200 counts per second). This result agrees with the fact that silver is a centrosymmetric material and the NPs are almost spherical, even con-sidering that their interaction should produce a weak SH signal. On the other hand, Fig. 4a shows that the CdS QD sample presents a small SH peak (as expected for a non-centrosymmetric material) and a strong TPPL signal. The central wavelength of the excitation láser for this measurement was 784 nm, and its FWHM was 26 nm.
However, a strong SH signal was measured in the mixed NP-QD sample, as shown in Fig. 4b. The SHG was 20 times larger in this sample, and the SH/TPPL ratio increased significantly. In addi-tion, in the mixed sample, the TPPL decayed after a few seconds of láser irradiation while the SHG remained stable over time. In this case, the central wavelength was 799 nm, and the FWHM was also 26 nm.
The observations can be attributed to the en-hancement of the nonlinear field around the QDs due to silver NP plasmon resonance at 2w.The in-coming light at u> is not enhanced by the silver NP, but creates a weak nonlinear signal at 2ui in the QDs. This outgoing signal is enhanced by the field enhancement factor (rj), so that the SHG intensity is enhanced by 'if. Note that in the analogous case of SERS, the incoming and outgoing signáis are enhanced giving an intensity enhancement of r4 [18].
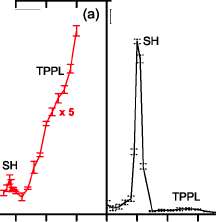
Figure 4: SH and TPPL spectra for (a) the CdS QD sample (multiplied by 5) and (b) the mixed Ag NP-CdS QD sample. Note that the SH peak was 20 times higher in the mixed sample, and the ratio between the SH and the TPPL changes drastically.
The magnitude of this enhancement is not easy to calcúlate since the mixed NP-QD sample con-tains several hot-spots (usually in the concentrated NP fringe), and their intensities were wildly differ-ent. Nevertheless, the highest intensities recorded for the NP-QD sample were « 104 cts/s, while the highest ones for the QD sample were « 1700 cts/s. To estimate the enhancement, we used the analyt-ical enhancement factor (AEF), defined as [19]

where / and p are the SHG intensity and the surface concentration of QDs in the corresponding samples. We must take into consideration that there is a thick layer of QDs that are not in the enhancement región of the NPs, Le., the measured signal in the NP-QD sample is the sum of the intensity coming from QDs cióse to the NPs that are enhanced, and the intensity from QDs far from the NPs that are not enhanced. If we keep only the enhanced frac-tion,
where /5NP_QD is the concentration of QDs near the NPs. Since the NP enhancement decays one order of magnitude in 5nm [20], we can take /5NP_QD « pQDf^. This gives AEF « 5103. This is just an estimation of the order of magnitude of the enhancement, since the uncertainties in the thick-nesses and máximum intensities are very high, but this estimation is consistent with the enhancements usually found in SERS experiments [18].
To study the spectral dependence of the enhancement, and gain a deeper insight into the behavior of the system, the incoming láser light was tuned while keeping the láser always on the same spot. This measurement is shown in Fig. 5, where the intensity is the photon flux at half the láser wave-length, normalized to the signal provided by a 40 fs pulse with 275 mW average power, according to the following formula:
The signal at the SH wavelength was, for each point of Fig. 5, a local máximum in the spectrum.
Figure 5 shows that the SH from the QD sample increases toward the excitonic resonance in about a factor of 2 for the whole tuning range, a valué similar to the one reported by Baranov et al. [21]. It is worth noting that the contribution of the TPPL to this increase is much smaller than the SH signal throughout the measured range (see Fig. 4). Showing a very different spectral response, the SH for the mixed NP-QD system sharply increases in more than a factor of 7 cióse to the resonance of the silver plasmon.
This measurement reinforces the hypothesis that the silver NP is modifying the nonlinear response of the QDs thanks to the resonant excitation of the silver NP plasmons. However, it must be noted that the enhancement does not exactly follow the plasmon resonance spectrum shown in Fig. 2. The reason for this is still unknown, but it is possible that the plasmon resonance was shifted due to the interaction among NPs. Unfortunately, the tuning range of the láser was much smaller than the spectral width of the plasmon resonance.
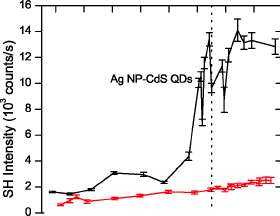
Figure 5: SHG clS el function of the láser excitation wavelength. The horizontal scale is the second harmonio of the incident photon. Red symbols show the SHG for the QD sample, while the black symbols show the SHG for the mixed NP-QD sample. The dotted line marks the spectral position of the máximum of the plasmon resonance.
IV. Conclusions
We have observed a strong enhancement (« 103) of the SHG when CdS QDs are mixed with silver NPs, compared with a CdS QD sample. The spectral dependence of the enhancement shows that the NP plasmons are resonantly excited by the SH emis-sion of the QDs. These measurements are evidence that the SH enhancement is mediated by nanoparticle plasmons. This effect can be applied to significantly improve traditional applications of SH measurements such as the study of surface deposition and orientation of molecules, among others.
Acknowledgements - We thank Claudia Marchi for her help with the NP synthesis and Nora Pelle-gri for providing the QDs. We also thank Alejandro Fainstein for the insightful discussions. This work was supported by the University of Buenos Aires under Grant X010 and by ANPCYT under Grant PICT 14209.
[1] V L Brudny, B S Mendoza, W L Mochan, Second-harmonic generation from spherical particles, Phys. Rev. B 62, 11152 (2000).
[2] L C Estrada, P F Aramendía, O E Martínez, 10000 times volume reduction for fluorescence correlation spectroscopy using nano-antennas, Opt. Express 16, 20597 (2008).
[3] A F Scarpettini, N Pellegri, A V Bragas, Optical imaging with subnanometric vertical resolution using nanoparticle-based plasmonic probes, Opt. Commun. 282, 1032 (2009).
[4] T Kalkbrenner, M Ramstein, J Mlynek, V Sandoghdar, A single gold particle as a probe for apertureless scanning near-field optical microscopy, J. Microsc. 202, 72 (2001).
[5] P Anger, P Bharadwaj, L Novotny, Enhance-ment and quenching of single-molecule fluorescence, Phys. Rev. Lett. 96, 113002 (2006).
[6] A J Haes, R P Van Duyne, A nanoscale opti-cal biosensor: Sensitivity and selectivity of an approach based on the localized surface plas-mon resonance spectroscopy of triangular sil-ver nanoparticles, J. Am. Chem. Soc. 124, 10596 (2002).
[7] A G Skirtach, et al., Laser-induced release of encapsulated materials inside living cells, Angew. Chem. Int. Ed. 45, 4612 (2006).
[8] P Etchegoin, et al., New limits in ultrasensi-tive trace detection by surface enhanced Ra-man scattering (SERS), Chem. Phys. Lett. 375, 84 (2003).
[9] P G Etchegoin, P D Lacharmoise, E C Le Ru, Influence of photostability on single-molecule surface enhanced Raman scattering enhance-ment factors, Anal. Chem. 81, 682 (2009).
[10] M Ishifuji, M Mitsuishi, T Miyashita, En-hanced optical second harmonic generation in hybrid polymer nanoassemblies based on coupled surface plasmon resonance of a gold nanoparticle array, Appl. Phys. Lett. 89, 011903 (2006).
[11] H A Clark, et al., Second harmonic generation properties of fluorescent polymer-encapsulated gold nanoparticles, J. Am. Chem. Soc. 122, 10234 (2000).
[12] S Baldelli, et al., Surface enhanced sum frequency generation of carbon monoxide adsorbed on platinum nanoparticle arrays, J. Chem. Phys 113, 5432 (2000).
[13] I Barsegova, et al., Controlled fabrication of silver or gold nanoparticle near-field optical atomic force probes: Enhancement of second-harmonic generation, Appl. Phys. Lett. 81, 3461 (2002).
[14] M C Marchi, S A Bilmes, G M Bilmes, Photo-physics of Rhodamine B interacting with silver spheroids, J. Colloid Interface Sci. 218, 112 (1999).
[15] A Frattini, N Pellegri, D Nicastro, O de Sanc-tis, Effect of amine groups in the synthesis of Ag nanoparticles using aminosilanes, Mater. Chem. Phys. 94, 148 (2005).
[16] A I Ekimov, et al., Absorption and intensity-dependent photoluminescence measurements on CdSe quantum dots: Assignment of the first electronic transitions, J. Opt. Soc. Am. B 10, 100 (1993).
[17] Z Yu, et al., Large resonant Stokes shift in CdS nanocrystals, J. Phys. Chem. B 107, 5670 (2003).
[18] E C Le Ru, P G Etchegoin, Principles of Surface-Enhanced Raman Spectroscopy, Elsevier Science Ltd, Amsterdam (2008).
[19] E C Le Ru, E Blackie, M Meyer, P G Etchegoin, Surface enhanced raman scattering enhancement factors: A comprehensive study, J. Phys. Chem. C 111, 13794 (2007).
[20] S A Maier, Plasmonics: Fundamentals and Applications, Chap. 5.1, Springer Science, New York (2007).
[21] A V Baranov, et al., Resonant hyper-Raman and second-harmonic scattering in a CdS quantumdot system, Phys. Rev. B 53, R1721 (1996).

