


 Inglês (pdf)
 Artigo em XML
 Referências do artigo
 Enviar este artigo por email
 Citado por SciELO
  Similares em
SciELO
Similares em
SciELO 
 Permalink
I Introduction
Cancer Stem Cells (CSCs) are responsible for driving tumor growth due to their ability to make copies of themselves (self-renewal) and dierentiate into cells with more specic functions [1]. Diferentiated Cancer Cells (DCCs) maintain a limited ability to proliferate, but can only generate cells of their specic lineage [2].
Like the tissues from which they arise, solid tumors are composed of a heterogeneous population of cells; many properties of normal stem cells are shared by at least a subset of cancer cells [3, 4]. In many tissues, normal stem cells must be able to migrate to diferent regions of an organ, where they give rise to the specifically diferentiated cells required by the organism. These features are reminiscent of invasion and immortality, two hallmark properties of cancer cells [5, 6]. Resistance to chemo/radio therapies gives the CSCs a high chance of survival and of forming new tumors, even after treatment [7]. Hence, based on the concept that destroying or incapacitating CSCs would be an eficient method of cancer containment and control, new therapeutic paradigms are the focus of current research.
A tumorsphere assay is an experimental biological model used for the study of CSC features. A tumorsphere is a clonal aggregate of cancer cells grown in vitro from a single cell. It has been shown experimentally that DCCs can not generate a tumorsphere because they are unable to form compact long-term aggregates. As a consequence, the current experimental convention for the definition of CSCs, from a functional point of view, is based on the capacity of a single cell, the seed, to grow a more or less spherical aggregate in a gel suspension. This is why CSCs are said to \drive" tumor progression.
In an experimental assay, where the time evolution of the number of cells in a tumorsphere is measured, it is possible to determine a proliferation rate r consistent with the Population Doubling Time (PDT) of the total population. Unfortunately, this quantity cannot discriminate between the growth rates of CSCs and their diferentiated counterparts. Furthermore, measuring the PDT of the CSCs is experimentally very complex [8]. Understanding r is crucial for mathematical modeling in a system where the ospring might belong to a diferent population than their parents. Indeed, CSC duplication could have three possible outcomes: stem cell replication (self-renewal), asymmetric diferentiation and symmetric diferentiation. To model such a feature mathematically, we can assume that the three outcomes will occur with probabilities ps, pa and pd, respectively. From the point of view of the populations, the last two possibilities corre- spond to the birth of a new DCC, the parent cell either keeping (in the asymmetric duplication) or losing (in the symmetric case) its stemness. For example, writing the corresponding population dynamics diferential equations, Bentez et al. showed that a CSC will give birth to another CSC at a rate rps which is estimated by tting their mathematical model to the experimental data [9,10]. Since the probability of self-replication ps seems to be small in homeostasis and in most common culture media, then rps will also be small, leading to quiescence, a main feature of CSCs. Nevertheless, CSCs can be experimentally forced to abandon their quiescent state by using specic growth factors that inhibit diferentiation [11,12] or by restricting oxygen concentration, as discussed below. In these situations, ps is close to one and tumorspheres will contain a high fraction of CSCs. Also, pa is usually small, although its value can increase under abnormal situations such as injury or disease. Metastasis, the invasion process by which cancer cells leave a tumor to form a new colony at another location, is an intriguing feature of cancer disease. Because CSCs are the seeds of tumors, it is accepted that metastatic tumors must come from a pre-existent primary tumor and might be located near its surface in order to detach, migrate and - nally invade another site in the organism. The distribution of CSCs in a primary tumor is key to the understanding of metastasis, cell proliferation and drug resistance. Curiously, according to the three-concentric-layer model proposed by Persano et al., CSCs seem to be located in the inner core of glioblastomas. On the other hand, cells on the periphery of the tumor show a more dierentiated phenotype that is highly sensitive to Temozolomide, a drug for cancer treatment [13]. Interestingly, these authors demonstrate that CSCs are more proliferative under hypoxic conditions. Furthermore, Li et al. report that hypoxia plays an important role in the de-dierentiation of cells [14]. These results indicate that a hypoxic environment will increase the numbers of CSCs.
The aim of this work is to simulate colony growth by means of an Agent-Based Model (ABM) that mimics basic features of CSC proliferation, with emphasis on its geometrical properties. Multi- ple realizations allow us to estimate the fraction of CSCs situated on the periphery of the colony, showing that it is quite small for large, long-lived colonies. We also use some elements of percolation theory to help interpret and quantify the simulation results. We then report a transition to percolation which depends on the self-renewal probability, ps, of the CSC population. Finally, we conclude that that our results lead to a simple explanation for CSC niche size, and support the hypothesis that the metastatic process must start at the very beginning of tumor development.
II Simulation of two-dimensional colonies
Experimental monoclonal colonies start with a CSC in a suitable culture medium. This cell and its daughters duplicate at a more or less constant rate, forming a colony with an approximately circular shape. The reader interested in examples may refer to [15-17] for further information. In this work we use the same principle, describing the cells using circle-shaped mathematical objects and rening rules for their duplication and movement. In later studies we will requirecells not to be rigid spheres. Each cell in the current simulations has a central circular impenetrable region, the core, and around the core there is an area, the corona, where overlapping is allowed. In this way, cells are able to overlap as far as the border of their coronas and reach the border of the core of other, neighboring cells. The gures presented in this work has a 95 % overlap on the cell radius. However, we will show that the results presented here do not depend on this parameter. Also, each cell belongs to a class that defines its behavior: active CSCs, active DCCs, quiescent CSCs and quiescent DCCs. As a simplication of the model, we assume that the probability of asymmetric duplication of CSCs is zero, pa = 0. In this way ps is the only control parameter that allows direct capture of the model's main features. We start the simulation by seeding an active CSC and asking it to duplicate. Furthermore, at each time step we ask all active cells to attempt to duplicate, according to the following rules. First a new cell is created in a random position at the side of an active cell. If there are no other cells in this location it remains there, otherwise a new location beside the active cell is randomly determined. After 500 attempts, if the new cell has still not found an empty spot to occupy, it is destroyed and the active cell changes to its respective quiescent class. Conversely, after successful duplication, if the active cell is a CSC it self-renews with a probability ps, which means that the new cell becomes an active CSC, otherwise it changes to the active DCC class. If the new, active cells belong to diferent classes, there is a probability of 1=2 that the active CSC will exchange positions with the new DCC. Naturally, an active DCC can only create another active DCC.
Once all the active cells have been asked to duplicate, independently of the success of the attempt we say that a one-day-long time step has been performed. This implies, without loss of generality, that r ' 1 day a reasonable growth rate that will aid our intuition. Further details on the structure of the simulation process are provided in the Appendix, including a ow chart in Fig. 7. We have also provided videos in the Supplementary Information. In each video a representative value of ps was set and ten realizations were recorded, illustrating how they were carried out.
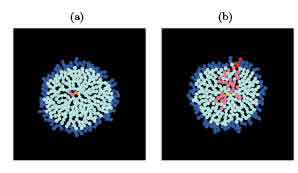
Figure 1: Two realizations of the simulation for ps = 0:5 after 15 days. (a) There are no CSCs at the periphery; all of them, colored in pink, became quiescent. (b) The active CSCs at the border are colored in red. Note that some branches failed to percolate. DCCs are depicted in cyan (quiescent) and blue (active). The seed is represented in yellow.
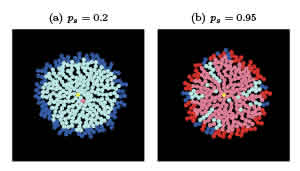
Figure 2: Two realizations of the simulation at low (a) and high (b) self-replication rates after 15 days. In (a) the CSCs are quickly surrounded by DCCs, becoming quiescent (pink). In (b) the high number of CSCs allows percolation to most of the colony perimeter. The seed is colored in yellow.
Typical outcomes of the described process are shown in Fig. 1 and video v1. In these examples we set ps = 0:5 and started with a CSC seed depicted in yellow. After running the simulation for a period equivalent to two weeks (15 time steps), a relatively long period for a biological experiment, we obtained two possible outcomes: (a) a few quiescent CSCs were trapped in the center of the colony or (b) there were active CSCs at the border of the colony. Indeed, we defined the border of the colony as the rim formed by the set of active cells. To better track the subpopulations present in the colony, the active cells are colored in red for CSC and in blue for DCC. Also, the quiescent cells are colored in pink for CSC and cyan for DCC. Remember that the yellow dot is not always at the center of the colony because the seed may exchange its pposition with a new DCC. In panel (b) we recognize a path, paved by CSCs, that joins the center of the colony with its border. Also, some frustrated branches appear in this path of CSCs, which die in the quiescent core, indicating great variability. This path resembles cluster percolation in porous media, lattices or networks, which led to us to attempt to describe the probability of nding a CSC at the border of the colony by means of percolation theory.
To sharpen our intuition as to what percolation means in this system, in Fig. 2 and videos v2 and v3 we present two more examples with dierent self-replication probabilities, ps. In panel (a) and video v2, ps = 0:2 is so small that the CSCs are quickly surrounded by DCCs, and become quiescent. This is the most common situation in a regular culture medium where the CSC count is low and constant |over time. On the other hand, in panel (b) and video v3, ps = 0:95 leads to a large CSC population that invades almost the entire system. The addition of stem cell maintenance factors such as EGF or bFGF to the culture medium is an example of this case. These limiting situations were previously studied both experimentally [11,18] and mathematically [9,10], focusing in the rst case on technical aspects of the assay, and in the second case on recovery of the CSC fraction.
Curiously, in the examples shown in Figs. 1 and 2, the rim formed by active cells is similar to the one reported in the classical multicelular spheroid work of Freyer and Shuterland [19]. In Freyer's work, the inner portion of the spheroids was formed by dead cells, attributed to a low concentration of oxygen/nutrients supplied by means of discusion. This rim was also formed by active cells and was studied mathematically by several authors using difusion equations [20-22]. It is interesting that in the present monoclonal case the geometry seems to be sufgicient to develop a rim, just two cells thick, independently of any diusion process.
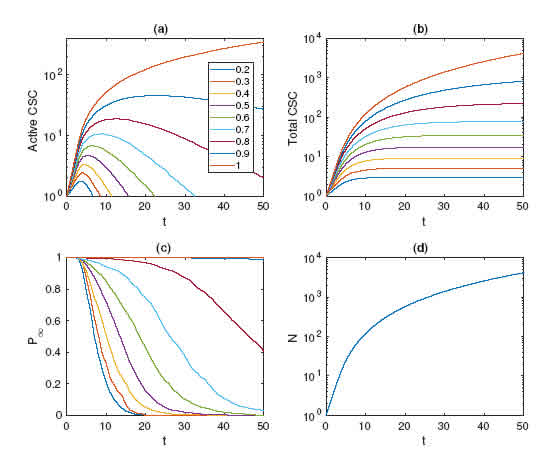
Figure 3: Time evolutions of quantities averaged over a thousand realizations for values of ps 2 [0:2::1:0]. (a) Number of CSCs at the border. (b) The total number of CSCs reaches a constant value that defines the niche. (c) The probability of a CSC being at the border. (d) System size as a function of time.
To study the percolation properties of the system statistically, we carried out extensive simulations of colony growth. Each data point reported is the result of averaging over 1000 runs. The time evolution of colony growth was performed for 37 values of ps 2 [0:2; 1:0]. The results of these measurements are summarized in Fig. 3. Panel (a) shows the number of CSCs at the border, which increases to a maximum given by the time when they are overwhelmed by the DCC population. Beyond this point, more and more CSCs become quiescent until no more active CSCs remain. This phenomenon disappears for ps barely lower than 1, when almost all cells on the border are CSCs. In panel (b) the time evolution of the total CSC population is depicted, showing that after a transient the CSC population stops growing and remains constant. This xed number of CSCs is usually called the CSC niche and was mathematically studied in [9]. As expected, the probability of a CSC being at the border rises as ps is increased, as shown in panel (c). The relationship between simulation time and system size is shown in panel (d); due to its geometrical nature it is independent of ps, the self-renewal probability.
III Percolation theory
Percolation theory was used to estimate the probability of nding a CSC at the border of the colony, looking for a purely geometrical feature of its growth. In particular, we assumed that the cells in the colony could be mapped onto the nodes of a triangular network with the seed at its center. Each cell is then connected with its nearest neigh- bors, whose number, in two dimensions, is known not to exceed six. As shown in Fig. 1(b), the CSCs (quiescent and active) form paths that expand radially from the center to the edge of the colony. By inspection, we note that these paths are formed by the connected nodes that have had a CSC at any moment during the culture. The path could have some \holes" that arise because of the possibility of exchanging a parent CSC with its daughter DCC. The probability ps thus regulates the number of CSCs that occupy the nodes of the network. Hence, there must be a threshold value pc of ps, below which it is impossible to follow a path of nodes starting at the seed and ending in a CSC at the border of the tumor. This value, pc, is called the critical value or percolation threshold and defines a percolation phase transition[23]. Thus, when the border is reached by CSCs, we say that such a path percolates.
Formally, a percolating path is mathematically dened as a set of connected nodes that expands innitely over an infinite network for a large enough value of ps [24]. In our model, each new node of the percolation path is added either by the selfrenewal of a CSC, with probability ps, or by an exchange between a CSC and a DCC, with probability 1 21
which depends on the available neighbor number. 1 It is noteworthy that in Eq. (1), for z = 1 we obtain pc = 1, the 1D critical occupation for a chain of nodes. For 1 < z < 2 the critical occupation quickly falls to zero. This means that for z 2 the system will always percolate. On the other hand, if the CSC never exchanges its position with a DCC, we get pc = 1 z , which is again the 1D critical occupation and will asymptotically fall to zero as z increases. Otherwise, if the CSC always moves, ps diverges as expected for a cell that always remains on the outer rim of the growing colony. There is no evidence that a CSC will stay either in the core or on the border of the colony. Simulations carried out on both limits of the exchange probability agree with these theoretical limits, but do not provide further information. For this reason, we implemented the one-half exchange probability in our 1Remember it is not universal because it depends on the details of the network.

Figure 4: (a) Cell overlapping does not change the maximum neighbor number of six; thus, the underlying lattice is topologically triangular (yellow lines). (b) The average neighbor number versus layer number quickly drops to one. At t = 50 days, n ' 50, N ' 4000 and z = 1:02, which means ps = 0:92.
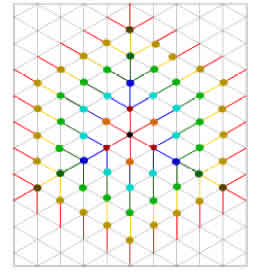
Figure 5: Growth of the colony on a triangular lattice, starting from the center (black dot). Each layer is depicted in a diferent color and contains three nodes with z = 3 and the remainder with z = 1.
By construction, there are no closed loops in the network, thus deduction of the critical probability was similar to that for a Bethe lattice or a tree graph. However, unlike regular lattices/graphs, in our model the neighbor number of a node is not the same for all nodes due the randomness introduced by space searching and the probability of exchange. For this reason, we defined an average neighbor number. In Fig. 4(a) each cell is depicted by two concentric circles; the dark one represents the rigid core and the lighter represents the corona where overlapping is allowed. Note that the maxi- mum neighbor number is six, regardless of the ex- tent of the corona. In simulations a new cell must be in contact with other cells, and overlapping will modify the density of the colony. As mentioned, this parameter will be useful for further study of difusion efects that are irrelevant to the present work. Also, the random process of searching space for proliferation will slightly modify the geometry of the underlying network, but not its topology, which will be the same as that of the triangular lattice except for a few defects caused by a neighbor number lower than six. Thus density, which is relevant when studying the difusion of nutrients, oxygen or proteins for signaling, does not play any role in the current percolation problem.
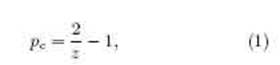
To roughly estimate z we built up a tree graph over a triangular lattice substrate. A possible connection pattern of nodes in such a network is depicted in Fig. 5, which was built layer by layer with each layer represented in a diferent color. Layer n = 0 is the central black dot that represents the seed. In this particular example, in each layer we depict three nodes with z = 3 (darker dots), leaving the remaining nodes with z = 1 (lighter dots). It is clear that for any layer there are 6 n nodes for n > 0; then to connect two layers without loops we need on average Thus, as the colony increases in size, the percolation threshold shifts towards 1. The main consequence is that there is no chance to perform nite size scaling to detect the critical transition point through simulations, as in the case of 1D chains. As mentioned before, in Figs. 1 and 2, the proliferative cells are distributed in the two outermost layers. This feature of the colony occurs because the cells in the simulation are requested to proliferate in random order. This is also the cause of the observed circular shape of the colony. Because the vertices of the hexagonal array shown in Fig. 5 have a lower probability of being chosen for prolifer- ation, as system size increase s cells on their edges will proliferate rst, as at the beginning of each time step they have more room to do so. Thus, the estimated number of cells in each layer is underestimated, as is their neighbor number. As a consequence, we expect that the actual value of pc as a function of size or time will be much lower than that predicted by Eq. (1) and our estimation of z. A precise estimation of z will require statistical treatment that is beyond the scope of this article. The result implies that proper (mathematical) percolation transition will occur at ps = 1, as in 1D percolation. This also implies that the only way for a CSC to be at the border, for an arbitrarily large colony, is when it is forced not to diferentiate. Nevertheless, monoclonal colonies cannot be maintained and grown forever. A 50-day experiment is very long, and very uncommon in the literature. We thus focus on the probability of a CSC being at the border, P1, whose behavior, as a function of ps, is depicted in Fig. 6 for several times/sizes. The relationship between time and size is bijective, thus we report both values in the legend. In this graph the dots are the result of the simulations presented in the previous section, for which the frequency of CSCs at the border of the colony was averaged over a thousand runs. To obtain suitable tting of these data as continuous functions of ps, we used erf functions following Yonezawa's classical work [23]. The in ection point of the erf curves coincides with the percolation threshold, giving a good estimate of pc. In addition, the theoreti- cal result for the percolation parameter in a Bethe lattice of order 3 is depicted in gray for comparative purposes. Note that P1 does not jump as in Bethe percolation; the transition is continuous, as known for several regular lattices, including the triangular one. Gonzalez et al. [25] studied the transitions of several forms of percolation in triangular lattices, reporting their critical probabilities using nite size scaling analysis. They found universal features with values between 0.5 and 0.8 for the percolation threshold, depending on the problem. In contrast, but as expected, as our system size increases the tted curves become steeper and steeper, and their in ection points predict a shift of ps towards 1, as depicted by the blue dots in the inset of Fig. 6. Comparison with our theoret- ical result gives an expected overestimation of the percolation threshold { the red line, as explained before. We therefore hope to nd that a CSC will be at the border of the colony in half the runs when we simulate a three-week experiment.
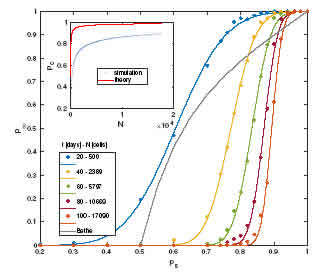
Figure 6: Probability of percolation as a function of ps for diferent colony sizes. Dots correspond to simulations and lines are theoretical ttings to estimate the percolation threshold (see text). The gray line is the theoretical Bethe result. Inset: Percolation threshold pc at diferent sizes measured by simulations (blue). Our simple theoretical approach overestimates this threshold (red).
IV Conclusions
Metastasis is an intriguing feature of cancer invasion. Most research in this eld is guided by the biological point of view, even though there are many mathematical models that attempt to describe it [26-29].
In the examples of growth given in Fig. 1(a) and Fig. 2(a), it becomes clear that under normal culture conditions CSCs remain in the inner core of spheroids. This is also deduced from the low P1 probability of nding a CSC at the border of the colony, as shown in Fig. 6. If this could be observed in the laboratory, the experiments that reveal a CSC preference for hypoxic environments could be easily explained by this fact. It has been shown experimentally that hypoxia maintains the undifferentiated state of primary glioma cells, slowing down the growth of glioma cells which are in a relatively quiescent stage, increasing colony-forming eficiency and the migration of glioma cells, and elevating the expression of of stem cell markers. However, the expression of markers for stem cell differentiation was reduced after hypoxia treatment [13, 14]. It is also known that the inner core of spheroids and tumors have a lack of oxygen and nutrients, which are rst consumed by the outer layers of the tumor [30{33]. In this context, CSCs constitute a phenotype that has evolved to survive under hypoxic conditions in order to drive tumor growth.
On the other hand, metastasis requires CSCs to overcome three major barriers: the probability of an active CSC being present at the border of the colony, the probability of it detaching from the tumor and the probability of it nding a suitable place to proliferate. The results of the present work establish that the rst of these probabilities is very small, even for relatively small tumors, supporting the rare occurrence of metastasis.
For large self-replication rates, possibly generated by environmental conditions, many active CSCs would become candidates for detachment. At present, we do not know of any report of a high number of CSCs in tumors in vivo or in transplanted xenographs under normal physiological conditions that experimentally support a large6 self-replication rate as part of the metastasis mechanism. An intriguing possibility is that metastasis begins in the early stages of tumor progression [34-36]. This is deduced from Fig. 3(a) where the number of active CSCs shows a peak for low ps and short times. If this is the actual situation, a CSC must detach from the primary tumor in its rst week of life, when the probability of being at the border is close to 1, even for low values of self-replication. Note that at this time the tumor consists of no more than a dozen cells. This fact leads us to hypothezise that a primary tumor is indeed the metastasis of some small young tumors. According to this hypothesis the primary tumor is in fact the rst colony able to x and grow, while metastatic tumors come from later CSCs that take more time to attach successfully to a new location. The detached cells must survive while competing for nutrients and space with the primary spheroids, which at this stage are ruthless adversaries [37].
Our two-dimensional model could be extended to three dimensions; this would be more realistic but also computationally more expensive. Preliminary results are qualitatively similar to those reported here, butso far we lack the statistics to perform a quantitative comparison. Another feature, obtained by changing geometrical constraints in our code, are simulations of non-solid tumors such as haematologic neoplasm; preliminary results show that active CSCs are present in a larger proportion there than in solid tumor spheroids. As a consequence, there is a higher probability of CSCs detaching and developing metastasis in neoplasms. In summary, percolation provides a way of developing a geometrical theory to support or complement signaling pathways, quorum sensing and other tools frequently used to study metastasis. Further experimental research will elucidate whether CSCs are the survivors with greatest t- ness, as suggested by our present results.

Figure 7: Left: Flow chart for the proliferation process of each cell. Right: Illustration of the stages and outcomes of the duplication process.
Appendix: Simulation algorithm. The simulations were carried out in an objectoriented paradigm. Each cell belongs to one of the following classes: Active CSC, active DCC, quiescent CSC or quiescent CSC. First we created an active CSC object at the center of a square space large enough to contain the nal colony. Then for each time step we requested, in random order, that all objects belonging to an active class perform the duplication procedure. In the left-hand column of Fig. 7 we depict the ow chart of the duplication procedure, whose steps are illustrated in the right- hand column.
The duplication process starts when an active cell, the parent, creates a copy of itself, the new cell, in the same position. Then a random angle 0 r< 2 is drawn from a uniform distribution and the new cell will advance a certain distance in the direction defined by this angle, such that its border does not overlap with its parent's core. This distance was determined as 95% of the cell diameter. If in its new position the border of the new cell overlaps with the core of another cell, it moves back to its initial position. Another random direction is then defined, repeating the movement sequence. The new cell will move forward and back, randomly changing its direction until there is no overlapping; thus we say that an empty spot is found. After 500 failed attempts to nd an empty spot, the new cell is destroyed and the parent cell changes to its respective quiescent class. Conversely, if the new cell nds an empty spot, and if its parent is a DCC, it sets its own class as an active DCC. On the other hand, if the parent is a CSC, a new random number 0 rd < 1 is drawn to be compared with ps. If rd < ps the new cell will set its class to active CSC, otherwise the new cell class will be set to active DCC. In the latter case a new random number 1 rm < 1 is drawn, and if the comparison rm < 1=2 becomes true, the cells will exchange their positions, leaving the CSC in the new spot and the DCC in the position of its parent.
Note that quiescent cells will never be requested to do anything; they do not move or duplicate in these simulations. Their only role is to restrict the movement of active cells. As a consequence, the code runs very rapidly, even for large colonies.

