


Serviços Personalizados
Journal

Artigo
 Inglês (pdf)
 Artigo em XML
 Referências do artigo
 Enviar este artigo por email
Indicadores
-
 Citado por SciELO
Links relacionados
-
 Similares em
SciELO
Similares em
SciELO
Compartilhar

 Permalink
Cuadernos del Centro de Estudios en Diseño y Comunicación. Ensayos
versão On-line ISSN 1853-3523
Cuad. Cent. Estud. Diseñ. Comun., Ensayos no.53 Ciudad Autónoma de Buenos Aires jul. 2015
INTERPRETANDO EL PENSAMIENTO DE DISEÑO DEL SIGLO XXI
Post-Recession consumerism in the U.S.: the influence of cheap and chic consumer products on perceptions of income inequality
Aaron Fry * and Steven Faerm **
(*) Associate Professor, School of Design Strategies. Parsons The New Shool of Design.
(**) Associate Professor, The School of Fashion, Parsons The New School for Design.
Fecha de recepción: julio 2014
Fecha de aceptación: marzo 2015
Versión final: julio 2015
Summary
Disparities in both income and net wealth have been on the increase in the U.S. since the 1970s. Over this period, the wages of lower and middle income Americans have grown at a slower rate than the GDP growth of the country as a whole, and at a much slower rate than incomes of the top 1% of earners; the latter disparity having widened dramatically in years following the recession of 2008. In this paper we discuss the subjective and relative factors that determine perceptions of financial well-being. Despite a widening income inequality, American consumers, in all income groups, own larger, newer, better and more possessions than ever before. In an environment in which income concentration is likely to continue to favor those at the top for the foreseeable future, we discuss the psychological effect of consumer access to well designed, affordable mass-market and luxury mass-market products. We examine four dimensions of luxury perception and discuss these in the context of two different luxury brands. We propose that the increased purchasing power that the American consumer currently enjoys is a factor that may offset or cushion adverse social and political effects of income stagnation and economic stress.
Keywords: Income inequality; Design and business; Mass market luxury; Fashion business strategy; Design business strategy.
Resumen
La disparidad tanto en los ingresos como en la ganancia neta en los EE.UU., ha ido en aumento desde la década de 1970. Durante este período, el nivel de los salarios bajos y medios de los estadounidenses han crecido a un ritmo más lento que el crecimiento del PBI del país en su conjunto, y a un ritmo mucho más lento que los ingresos del 1% de los asalariados; habiéndose profundizado esta brecha dramáticamente en los años posteriores a la recesión del 2008. En este trabajo se discuten los factores subjetivos y relativos que determinan la percepción de bienestar financiero . A pesar de la creciente desigualdad en los ingresos, los consumidores estadounidenses, en todos los segmentos de ingresos, incrementan sus posesiones, mucho más que en épocas anteriores. En un entorno en el que la concentración del ingreso parecería seguir favoreciendo en el futuro al segmento de ingresos más altos, se discute el efecto psicológico del acceso al consumo de objetos de diseño y al mercado masivo de bienes de lujo. Examinamos cuatro dimensiones de la percepción de lujo y discutimos esto en el contexto de dos marcas de lujo diferentes. Proponemos que el aumento del poder de compra que el consumidor estadounidense posee en la actualidad es un factor que puede compensar o amortiguar los efectos sociales y políticos adversos del estancamiento de ingresos y el estrés económico.
Palabras clave: Desigualdad de ingresos; Diseño y negocios; Mercado masivo del lujo; Estrategia de negocios de la moda; Estrategia de negocios de diseño.
Resumo
A disparidade tanto nos ingressos como na ganância neta nos Estados Unidos foi aumentando desde a década de 1970. Durante este período, o nível dos salários baixos e médios dos estadunidenses cresceram a um ritmo mais lento que o crescimento do PBI do pais, e a um ritmo muito mais lento do que os ingressos de 1% dos assalariados; tendo aprofundado o fosso dramaticamente nos anos após da recessão do ano 2008. Neste trabalho se discutem os fatores subjetivos e relativos que determinam a percepção de bemestar financeiro. Apesar da crescente desigualdade nos ingressos, os consumidores estadunidenses, em todos os segmentos de ingressos, incrementam suas possessões, muito mais que em épocas anteriores. Num ambiente em que a concentração do ingresso parecesse seguir favorecendo no futuro ao segmento de ingressos mais altos, se discute o efeito psicológico do aceso ao consumo de objetos de design e ao mercado massivo de bens de luxo. Examinamos quatro dimensões da percepção de luxo e o discutimos no contexto de duas marcas de luxo diferentes. Propomos que o aumento do poder de compra que o consumidor estadunidense tem hoje é um fator que pode compensar ou amortecer os efeitos sociais e políticos adversos do estancamento de ingressos e o stress econômico.
Palavras chave: Desigualdade de ingressos; Design e negócios; Mercado massivo de luxo; Estratégia de negócios de moda; Estratégia de negócios de design.
Introduction
In late 2012 The Economist published an article about widening income inequality amongst the rich (primarily OECD) countries. It compared today’s inequality with that of America’s “gilded age” when the Vanderbilts, Carnegies, and others amassed astonishing fortunes at a time when few American homes had indoor plumbing. The article acknowledges that the nature of today’s inequality is different from that of the 1800s, stating that “Disparities in wealth are less visible in Americans’ everyday lives today than they were a century [or more] ago. Even poor people have televisions, air conditioners and cars” (Beddoes, 2012). This absolute definition of wealth differs from how wealth is perceived and defined, “People evaluate their economic well-being relative to others, not in absolute terms” (Saez, 2013) and, as these perceptions are dependent on relationships within our immediate context, it is difficult for individuals to gauge their own situation relative to other individuals and communities that they may have little or no personal contact with.
The subject of this paper is the extent to which perceived financial well-being may increase tolerance of income inequality. It is paradoxical that one of the factors that contribute to income inequality; globalization (specifically its supply-chain enabled mass production) contributes toward dampening inequality’s effects. We focus on the contextual and behavioral factors influencing American consumer’s perceptions of financial well-being. The development of a global mass market fashion system together with competition between large globalized fashion companies have led to a “race to the bottom” in terms of cost and price at the same time that value is being enhanced through design and production quality. Quick response strategies are focusing on creating up-to-theminute trends without sacrificing fast production lead times (Cachon & Swinney, 2011), while sophisticated supply management and production systems and technologies have conspired to create a sweet spot between quality and price. Meanwhile innovative business design strategies deliver value in less materially tangible ways. Because Americans can buy more (and better) for less money than at any other time in their history, low- and middleincome consumers in the mass market now feel as prosperous as they ever have. The other beneficiaries have been those at the top of the income pyramid. While middle and lower class consumer’s incomes have grown slowly, stagnated or declined in real terms, those of America’s top earners have been on an ever-steeper upward trajectory. This paper argues that the availability of affordable value-added consumer goods may help income distribution to widen in the U.S. without the attendant social and political consequences typical of the countries in Africa and South America that have very high levels of income inequality.
U.S. income inequality: trends and trajectories
Economic data clearly show that U.S. income inequality has widened over the past four decades, accelerating in the period of recovery following the financial crisis of 2008. Income derived from salaries is viewed as significant by economists; “the single most important driver [of income inequality] has been greater inequality in wages and salaries. This is not surprising: earnings account for about three-quarters of total household incomes among the working-age population in most OECD countries”. (OECD, 2011a, p. 2) The Gini coefficient is a statistical measure of income dispersion; a score of 0 is completely equal and 100 is completely unequal. The 2012 OECD estimate for the United States is 0.38 (after taxes and transfers) (OECD, 2013), although this is different from the U.S. census bureau’s estimates, it compares with an OECD average of 0.31. Of the thirty-four OECD countries, only Chile, Mexico and Turkey are more unequal than the U.S. by this measure. Additionally, the Gini gap has widened over time; in 1985, the OECD data showed that the Gini coefficient in the U.S. was 0.34. (OECD, 2011c).
Two notable trends in income inequality are:
1. The trend toward wider income dispersion across the income spectrum with slow wage growth among the middle-class. According to the U.S. Congressional Budget Office, between 1979 and 2007, income grew by 278% for the top 1% of households while all others grew by a median of 35% (65% for the next 19%, just under 40% for the next 60% and 18% for the bottom 20%.) (CBO, 2011). In the OECD as a whole, “earners in the top 10% have been leaving the middle earners behind more rapidly than the lowest earners have been drifting away from the middle” (OECD, 2011b, p. 22). The story within these numbers is that, in the United States, income growth has stalled for the middle class and income of those at the top has continued to rise dramatically while the lower class have drifted downward from the middle (Boushey, H. & Hersh, A. S., 2012).
and:
2. The trend toward an increasing separation between the top and the middle quintiles of the income spectrum with a high proportion of total income going to the rich (the top 1%) and a still higher proportion to the very rich; the top 0.01%.
An analysis of income distribution does not provide the full picture of the widening gap between a small group of wealthy Americans, a tiny group of even wealthier Americans, and the rest; those in (considerably) lower income tiers. The Gini figures do not account for increases in capital gains and asset values. Market income, or income before taxes and transfers, includes labor income, business income, capital income, capital gains, and income from other sources such as pensions. The CBO report found that each source of market income was less evenly distributed in 2007 than in 1979, and that more concentrated sources of income (such as business income and capital gains) grew faster than less concentrated sources (such as labor income). The disproportionate growth in capital (investment-derived) income relative to labor-derived income favors those who are wealthy enough to have surplus capital to invest (CBO, 2011). Concentrated sources of income, along with other global economic dynamics, as discussed in our next section, have created a situation in which:
...the share of national income going to the richest 1% of Americans has doubled since 1980, from 10% to 20%, roughly where it was a century ago. Even more striking, the share going to the top 0.01% –some 16,000 families with an average income of $24m– has quadrupled, from just over 1% to almost 5%. That is a bigger slice of the national pie than the top 0.01% received 100 years ago. (Beddoes, 2012)
In another comparison of the proportion and total of GNP going to the top, Atkinson, Piketty and Saez compare U.S. with France between 1975 and 2005, concluding that the benefits of superior U.S. economic performance in that period, accrued to the top 1% of US earners. The authors state:
...average real incomes in the US grew by 29.8% from 1975 to 2005 while they grew only by 19.3% in France during the same period (Piketty 2001, and Landais 2007), showing that the macro-economic performance in the US was better than the French one during this period. Excluding the top percentile, average US real incomes grew only 16.5% during the period while average French real incomes still grew 19.7%. Therefore, to a first approximation, the better macro-economic performance of the US versus France was entirely absorbed by the top percentile with the remaining 99% US families doing no better than the French. (Atkinson, A., Piketty, T. & Saez, E., 2009, p. 6)
The trends described above affect the business strategies of companies who provide goods and services to consumers in the U.S., sometimes in unexpected ways. In the wake of 2008 many ultra-luxury producers were concerned about their survival. However, the period following the 2008 recession has seen robust growth and demand for ultra luxury products, initially in Asian countries and increasingly in the more affluent parts of the U.S. (Masidover & Passariello, 2013). This suggests that, as the ranks of the very rich have swollen, the consumer base for the ultra luxury producers has increased. What do these statistics mean for the middle –and lower– income quintiles? We argue, in the mass market, design and business have created an increasing capacity to deliver high value to consumers across an income spectrum that is dynamic and widening.
The influence of globalization on income inequality in the U.S.
Almost sixty years ago, Simon Kuznets (1955), observing falling inequality in many OECD countries in the mid twentieth century, theorized that, “in the long run, modern economic growth would generate an early industrialization phase of rising inequality followed by a mature industrialization phase of declining inequality”. This rise and subsequent fall of inequality is graphically represented by an inverted U shaped curve known as the “Kuznets’ curve”. (See Figure 1 at page 173) (Aghion P. & Williamson J., 1999). Recent trends have clearly challenged Kuznets’ theory by raising questions as to why recent widening income disparities have prevailed over the income equality of the post World War II years. In 1955, Kuznets was describing the transition of an economy from an agrarian to an industrial base; at the time he proposed his model, he could not have anticipated the development of the knowledge-based globalized economy of the late twentieth and early twenty first centuries. Many of the factors driving income inequality, in its most recent iteration, suggest that aspects of globalization are largely responsible.
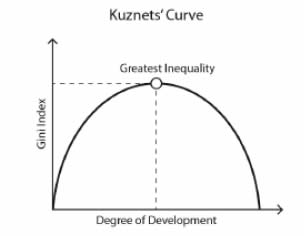
Figure 1. Kuznets’ Curve. (Aghion P. & Williamson J., 1999).
Supporters of the anti-globalization movement argue that “globalization has dramatically increased inequality between and within nations” (Mazur, 2000). This opinion is exemplified by the “Occupy Wall Street” movement; the eighth ‘fact’ of the movement’s “Declaration of the Occupation of New York City,” September 29, 2011, states that “They have consistently outsourced labor and used that outsourcing as leverage to cut workers’ healthcare and pay” (NYCGA, 2011). Reports on the subject of income inequality tend to highlight a range of contributing factors that operate concurrently, stating that, “Experts emphasize the roles of technological change, international trade, migration, deregulation, and the erosion of the minimum wage and union power” (Lerman, 1999; Council of Economic Advisors, 1997). A Council on Foreign Relations report reiterated some similar causes while adding others, stating that:
There are many, complex causes of income inequality. Certainly, globalization and technological change have led to greater competition for lower-skilled workers –many of whom have also lost union membership– while giving well-educated, higher-skilled workers increased leverage. Changes to tax rates, including favorable treatment for capital gains, may also play a role”. (Markovich, 2011)
Some of these concerns were echoed in the U.S. President’s most recent comments in his State of the Union speech entitled ‘Opportunity for All’ (January 28, 2014) in which he highlighted what is frequently referred to as America’s uneven recovery, in which corporate profits and healthy capital gains exist concurrently with high unemployment: Today, after four years of economic growth, corporate profits and stock prices have rarely been higher, and those at the top have never done better. But average wages have barely budged. Inequality has deepened. Upward mobility has stalled. The cold, hard fact is that even in the midst of recovery, too many Americans are working more than ever just to get by; let alone to get ahead. And too many still aren’t working at all. (Obama, 2014)OECD data accords with widely theorized probable causes of inequality, listing the primary drivers as, “skill-biased technological changes, changes in employment patterns and working conditions, weaker redistribution via the tax/benefit system” (Forster, 2013). A lesser culprit is changing household and family structures, such as single parent households and the phenomenon of “assortative mating” (individuals with similar educational and career profiles seeking each other out as life partners). Interestingly, OECD reports consistently claim that globalization has no effect on income inequality. It is possible that this claim is at least partly inspired by anxiety; it may provide support for a spate of anti-globalization (or protectionist) policy-making on the part of rich-world governments. A recent OECD report states, “…protectionist sentiments have been fuelled by the observation that the benefits of productivity gains in the past two decades accrued mainly –in some cases, exclusively– to highly skilled, highly educated workers in OECD countries, leaving people with lower skills struggling” (OECD, 2011b, p. 24). Hagopian and Ohanian at Stanford’s Hoover Center challenge the OECD perspective on the affects of globalization on inequality in developed countries, stating that:
Globalization, which effectively is a breaking down of trade barriers, has put upward pressure on income inequality in most of the industrialized nations as the production of goods and services has migrated to countries with lower labor costs. While this process has raised living standards in developing countries, it has reduced jobs or suppressed wages in many developed countries. As a result, many of these nations have experienced an increase in income inequality. (Hagopian & Ohanian, 2012)
Inequality and well-being; purchasing power and consumption
These same researchers from Stanford University’s Hoover Institution produce research that influences conservative (Republican) public policy. It is, therefore, unsurprising to learn that they oppose redistributive measures to redress salary inequality through increasing transfer payments and marginal tax rates, arguing that these policies discourage economic growth through hiring and investment. In asserting that income inequality is greatly exaggerated, they present evidence that, once non-cash transfer payments (e.g., food stamps, Medicare, Medicaid, and public housing), in addition to employer-provided fringe benefits (e.g., retirement and healthcare) are accounted for, the U.S. income gap narrows considerably. These forces have helped narrow the true Gini coefficient in developed countries with social services. But perhaps the greatest advantage the U.S. enjoys over any other country, rich or poor, in which wide income disparities exist, is its purchasing power and corresponding levels of consumption. Hagopian and Ohanian claim that “the best measure of living standards over the long term is not income, but consumption. Focusing on consumption rather than income provides a very different picture of inequality” (Hagopian & Ohanian, 2012). We agree that consumption is a more significant measure of living standard, and that this is determined by purchasing power. Non-cash assets and transfers, taxes paid, non-monetary income, etc. can be quantified by the ‘Disposable Household Income’ (DHI) metric developed by The Luxembourg Income Study (LIS). This metric is quite different from nominal Gross Domestic Product (GDP) per capita. In nominal terms, the per capita GDP of the United States ranks between 10th and 15th worldwide. Average per capita income is between USD $49,000 and $53,000; the amount differs based on the data source (e.g. World Bank, IMF, CIA, United Nations). These data, however, are nominal because they do not account for unequal alignment of currency values and for other factors that influence cost of living. When accounting for purchasing power and the ability to buy essential and discretionary products and services, the United States rises from 6th to 8th place in these rankings; purchasing power trumps nominal per capita GDP as a measure of material well-being. To help a broad readership understand the way in which cost of living mutually impacts income in this way, The Economist developed a metric they called The Big Mac index; this tool uses the price of a McDonald’s Big Mac to index price fluctuations for this consumer item from country-to-country. Using the United States as a baseline (Big Mac price $ 4.62). Norway sits at the top of the scale with the world’s most expensive Big Mac, price: $ 7.80. The cheapest Big Mac is available in India, price: $ 1.54.
The Stanford/Hoover study draws a similar conclusion in stating that, “in addition to food, clothing, and shelter, some of the most meaningful indicators of well-being are the properties and amenities that make life more comfortable or enjoyable”. By this measure, poverty, in the sense of absolute material deprivation, may not be an acute problem in the U.S. The Heritage Foundation (another conservative think-tank) issued a 2011 study about patterns of consumption amongst those in the bottom income quintile in the U.S. at that time some 46.2 million individuals. Using information from the U.S. Census Bureau’s 2010 poverty report, the study states that:
80 percent of poor households have air conditioning. In 1970, only 36 percent of the entire U.S. population enjoyed air conditioning. 92 percent of poor households have a microwave. Nearly three-fourths have a car or truck, and 31 percent have two or more cars or trucks… (Rector & Sheffield, 2011, p. 1)
This report concludes that “if poverty is defined as lacking adequate nutritious food for one’s family, a reasonably warm and dry apartment, or a car to go to work when one is needed, then the United States has relatively few poor persons. Real material hardship does occur, but it is limited in scope and severity” (Rector and Sheffield, 2011). Clearly, the report is created with policy objectives in mind. However, the broader question of how poverty (or lack of material well-being) is defined is an important one since it helps in understanding how well-being is understood by individuals in relative (rather than absolute) terms, and how people’s feelings of well-being are perhaps the most significant metric of all. The nature of what Americans spend money on, and the proportion of people’s income spent on certain items, has changed significantly over time. A 2006 report from the US Bureau of Labor Statistics compares the proportion of household income spent on two essential items (food and clothing) over a 103 year timespan. In 1900, 43% of household income was spent on food and 14% on clothing. By 1950 these percentages were 30% and 12% and by 2003 they stood at 13% and 4% respectively. During this period, in absolute terms, household income (unadjusted for inflation) had increased by 68 times (United States Bureau of Labor Statistics, 2006). These data show that today, food and clothing occupy a proportionally smaller slice of the income pie and are cheaper to buy than ever before. They highlight a significant increase in U.S. housing costs but they also reveal that what consumers once deemed essential (food, clothing, and shelter) has been joined by car ownership as a quasi-essential expense category. The evolution of what was once a discretionary/luxury expense category reveals how demographic patterns and lifestyles have changed over time. For example, Americans of all income levels are more mobile and more dependent on transportation for work and leisure. It also may reveal how American’s perceptions of financial well-being have shifted, relative to a general rise in incomes and standards of living. (Thompson, 2012)
Relativity and comparison in perceptions of financial well-being
In determining why people’s feelings of financial well-being frequently deviate from what statistical facts might suggest, researchers have found that, “satisfaction judgments tend to correlate higher with subjective well-being than do objective measures” (Diener, 1984, p. 552). In the hierarchy of domains that determine satisfaction with life, standard of living (or financial well-being) is ranked highly. According to Angus Campbell (1981), in comparing overall life satisfaction with various domains, the highest correlation with satisfaction of life is self- satisfaction followed by standard of living and family life; then, to a lesser degree, work, health and community (as cited in Diener, 1984, p. 552). Although wealthier people are happier on the average than poorer people, researchers noted a downward drift in happiness from 1957 to 1978 in all but the lowest income quintile. As this occurred during a period of tremendous economic growth in the U.S. “the data suggest the possibility that the influence of income is largely relative; it is not the absolute level of goods and services that a person can afford as the overall level of income rises, happiness does not necessarily rise with it”. (Diener, 1984, p. 553) The question of how well-off people are is very much determined by how well-off they feel, and people gauge this through comparison with their peers; “poverty in a society is almost always thought of in a relative way. When kids go to school and see how well other students are living, when they see the kinds of cars the well-to-do kids are driving and the kinds of clothes they are wearing, the difference in being a have-not among those who have becomes more striking” (Milloy, 2011). Status/power and social comparison are two of more convincing explanations for why people with high incomes are happier than those with lower incomes; “people only know how satisfied they should be by comparing their situation with that of others”. (Diener, 1984, p. 553)
Consumer’s tendency to make assessments of well-being based on heuristics arrived at comparatively can be understood through Discrepancy Theory, an umbrella term for individuals’ reference standards for making evaluations about value, quality-of-life and well-being. These concepts are referred to as what one has (in life) versus what one wants, deserves or expects now and in the future. For example, “in self-concept literature the discrepancy investigated is between one’s self-image and one’s ideal self. Income satisfaction has been found to be based on comparisons of to that of others, known and unknown to the respondent” (Oliver, 2010, p. 97), again illustrating that reference standard is relative, comparative and subjective. Accepting that wealth perception is relative (not absolute), and is context dependent and comparative, what influence does expectation have in determining satisfaction? Expectation of quality, price, style (or any other determinant of value) is similarly constructed contextually and comparatively. For example, a Norwegian McDonalds customer would be gratified to learn that her Big Mac costs $ 3.18 less in New York than in Norway, and she may now feel some hesitation about purchasing Big Macs back in Oslo. Her expectations have been altered. Expectancy disconfirmation is a model of satisfaction that accounts for positive, neutral or negative feelings (exceeds, meets, or does not meet expectations). The exhortation of promised utility against expected utility is used frequently in promotional media (e.g., the tag-line “Expect More. Pay Less” used by the mass retailer Target). It is sometimes contained in promises not to deliver a greater level of negative performance than might usually be anticipated, as in promises of no hidden fees, no surprises etc. (Oliver, 2010). Focusing on negative disconfirmation (experiences that are worse than expected), the degree of an individual’s perception of negative value originates in prior experience and external validation. An example of this would be a boring movie from an Oscar winning director (Oliver, 2010). When a consumer assigns a positive, neutral, or negative rating to a product or service, it raises the question “Compared to what?”
A strong expectancy disconfirmation (e.g., “I wasn’t expecting my New York Big Mac to be so cheap!” positive rating) operates upon discrepancy (e.g., “I’d rather not pay $ 7.80 for my Oslo Big Mac, but, unfortunately, that is the way things are here” neutral rating) to create new reference standards (e.g., “Oslo Big Macs are overpriced!” negative rating). The ability of expectancy disconfirmation to alter people’s reference standard for making evaluations about value, quality-of-life, and well-being has significant implications for the design and production of consumer goods and services.
Evolving reference standards for value: dimensions and perceptions of luxury
Businesses that cater to consumers understand that value is subjective, context-dependent and prone to psychological bias. Businesses create brands to enable the consumer to focus the multiple subjectivities through which she understands value. We find it useful to examine value through the lens of consumer’s perceptions of luxury; a truly subjective and multidimensional concept. Wiedmann, Hennigs, and Siebels (2007) created a model that is helpful in understanding the dimensions of luxury, it uses four dimensions of value perception:
1. Financial; price, resale price, discount, investment.
2. Functional; core benefits/basic utilities such as uniqueness, quality/reliability, design.
3. Individual; personal definition of luxury such as materialism, hedonic and self-identity attributes.
4. Social; conspicuousness and social status or prestige.
In contrast to utilitarian items that relieve discomfort or are essential to human survival, luxury can be broadly defined as objects [or services] of desire that provide pleasure, an indulgence, or convenience beyond the indispensable minimum (Wiedmann, Hennigs and Siebels, 2007 on Berry, 1994). Luxury perceptions are important to our argument because: 1. they are dependent on people’s shifting definitions of what essential (baseline) necessities are; 2. luxury is defined in relation to necessity, and 3. its definitions shift according to intrasubjective factors (the relative importance of one aspect of Wiedman, Hennings and Siebels’ dimensions over another). For example, in recent months the market for ultra-luxury items appears to be undergoing something of a shift in its reference standards. Certain high-income consumers have re-referenced the (value-money) utility of many high-end luxury items, moving toward “entry level” luxury brands such as Tory Burch and Michael Kors. Ultra-luxury brands have responded to the increased popularity of entry-level or mass-market luxury by creating what is known as the ‘Giffen good’ by raising the prices of their goods higher to reinforce their exclusivity (Kapner and Passariello, 2014). The Giffen good strategy uses pricing to strengthen a specific attribute (exclusivity) in order to enhance value perception and re-orient reference standards across the four dimensions. In a rational world, where the value of things would be solely tied to their functional utility, there is no room for luxury. But this world would also be a-social. Luxury is intimately tied to the dynamics of living together (Kapferer, 2010). The non-rational aspect of luxury consumption is evidenced by how reference standards affect perceptions of well-being and shift depending on social context. As what one wants (e.g. “I wish I had that Prada handbag that my friend has”) becomes what one has (e.g. “I bought that same Prada handbag on sale”), what a consumer deserves or expects now and in the future [consequently] adjusts upward. Definitions of necessity and luxury, being relative and socially determined, are dynamic. Above all, psychological benefits can be regarded as the main factor distinguishing luxury from non-luxury products. (Wiedmann, Hennigs, & Siebels, 2007 on Arghavan & Zaichkowsky, 2000)
Mass market and mass-market luxury brands enhance the well-being of consumers in the middle-low and middle income quintiles who have, on the average, experienced modest growth in their incomes and possible declines in their overall spending power. In 1983 designer Halston launched the first low cost/lower end ‘designer collaboration’ with mass retailer JC Penney to mixed reviews. The designer collaboration combines high fashion design aesthetics and branding with the high-volume, low-cost production capacity of mass-market fashion companies (Fry, Faerm, & Arakji, 2013). Consumers on a broad income spectrum suddenly had access to previously exclusive brands at mass-market prices. The lesson learned by subsequent very successful designer collaborations such as those launched by H&M and Target was not lost on the companies and, in particular, their ability to deliver value to consumers through innovative business strategy and design strategy. The first company we discuss –Everlane– is a mass-market brand that produces and sells apparel basics supported through innovative design and business strategy. Everlane founder Michael Preysman contrasts his strategy to that of designer collaborations by stating:
I think those things are a great way for Rodarte, Jason Wu, Margiela or Missoni to get to a different customer base while still not diluting the brand in a way, we’re not anti-fast fashion –but we kind of are. We’re building things that we want to last a long time. (Preysman, 2014)
In asserting that “..it’s hard to tell quality anymore. People are so good at making that product look amazing, but you never know how it’s going to wear”, Preysman is positioning Everlane as distinct from the fast-fashion designer collaborations; Everlane is focused on a different perception of luxury (Symonds, 2012) that includes high quality garment fit, finish, and materials at affordable prices. The second company –Michael Kors– is a mass-market luxury brand that produces (relatively) high quality fashion design based on classic American sportswear silhouettes. The brand’s Kors’ MICHAEL Michael Kors collection, introduced in 2004, capitalized on consumer demand in mass-market fashion that the designer collaborations helped to create. Both companies use economies of scale, and focus on three key attributes; price, quality and design to deliver value, in very different ways, across the four dimensions of the financial, functional, individual and social.
Everlane: the strategic design advantage
Based in San Francisco, Everlane is an online clothing company selling apparel basics, including T-shirts, shirts, sweaters, sweatshirts. It launched in November 2011 and has grown at an exponential rate from an early base of 25,000 customers to 500,000 or more. Some of Everlane’s competitors are companies such as Gap, Uniqlo, and American Apparel, all of whom deliver similar apparel basics at low prices, yet in very different ways.
Financial value
Everlane is able to deliver financial value through a price point that is somewhat higher (but comparable) to that of its competitors, and by using a global supply chain and outsourced labor. Everlane works with factories in China, Italy, Scotland, Spain, and the U.S. It keeps its costs lower for the consumer by not investing in “bricks and mortar” store locations which, according to it’s website (www.everlane.com/about), allows the company to mark-up it’s products two to three times in contrast to traditional retail which is typically marked up eight times before reaching the consumer (Soller, 2013). In summer 2012 the company debuted an infographic analysis of how a T-shirt is marked up that circulated on Tumblr (http://tumblr.everlane.com/post/16793958362/oh-my-itlooks- like-weve-stirred-some). This approach appeals to the consumer who believes she is motivated to buy through rational choice and persuaded through numbers and hard data. In terms of pricing, Everlane does not seem to discount it’s products or stage sales. The consumer is given to believe that Everlane is a price-sensitive company that will give careful consideration to it’s operation before raising it’s prices, and, when it does so, it will explain the decision to it’s consumers.
Functional value
Everlane makes apparel basics or “wardrobe classics,” items that are not seasonal or cyclical. Physical prototyping (or sampling) and complex detail are minimized. Risk is lowered through not investing in experimental, potentially unpopular innovative designs, and consumers’ feedback is sought to improve garment design and fit (Howorth, 2013). The slim fit T-shirts, sweaters, and other ‘minimal basics’ that Everlane makes have been available for years to a primarily younger, urban consumer at premium prices (Davila, 2012). Uniqueness is emphasized through investment in fit and finish and material; for example, T-shirts have [higher priced] screen-printed –rather than sewn– labels, the cotton used in their production is of a high quality, and color palettes are given careful consideration. Finally, Everlane frequently uses the same factories and manufacturing processes usually reserved for high-priced luxury brands (Davila, 2012).
Individual value
There is something of a sense of discovery and trend leadership associated with this brand, although the value accruing to the early adopter may not last. Crucially, and absolutely integral to Everlane’s business plan, is a focus on what it describes as “radical transparency” which is based around three principles: know your factories; know your costs; and always ask why. The radical transparency that Everlane provides has its limitations, but it provides a narrative and some qualitative and quantitative information about working conditions, and quality control in its factories. These attributes support consumer identification with the brand, which become especially strong if the consumer’s ideological values align with those of the company (Ellis, 2013). The brand takes advantage of having an exclusively online presence to do the things that websites do well: convey information about the brand to the consumer.
Social value
Everlane’s radical transparency attributes are also important in giving the brand social currency. The [individual] consumer simultaneously gains social status and becomes a “brand ambassador” when she discusses Everlane’s positive attributes with her friends. The business strategy of radical [operational] transparency somewhat aligns with the values of a Triple Bottom Line (TBL) business philosophy (Elkington, 1997), particularly in the areas of social and financial sustainability. Everlane is a design-oriented innovator in the areas of operational strategy, material sourcing/manufacturing technology, and communication. Its current focus is on innovation in these domains rather than the aesthetic or conceptual design of the apparel itself. Clearly all four dimensions of value are mutually informative; the distinctions between individual and social value blur for example, as does the attribute of offering previously expensive styles at lower prices which influences all four dimensions to varying degrees. Although we found similar cross-dimensional attributes in the following example, we found the dimensions to be a useful tool for the analysis and comparison of business and design strategies.
Michael Kors, selling to the luxury aspirant
Michael Kors is a New York-based fashion designer and brand that was established as an American luxury sportswear house and offers two primary apparel collections. The Michael Kors collection, introduced in 1981 which “reflects the pinnacle of luxury. “This collection establishes the aesthetic authority of our entire brand and serves as the cornerstone of Michael Kors’ semi-annual runway shows” (Michael Kors Ltd., 2014); The MICHAEL Michael Kors collection was introduced in 2004 when the house “identified the opportunity to capitalize on the brand strength of the Michael Kors collection to meet the significant demand for accessible luxury goods. The MICHAEL Michael Kors collection has a strong focus on accessories, in addition to offering footwear and apparel, and is positioned to appeal to a younger demographic”. (Michael Kors Ltd., 2014) As of December 2013, the company operated 395 retail stores, net retail sales were $503.4 million, total revenue was $1.0 billion, and the company expects total revenue to be in the range of $3.18 billion to $3.19 billion for 2014 (The New York Times, 2014b). Kors’ key competitors in the accessories market include Coach and Tory Burch (Timberlake, 2012; Paton, 2013). However, while Kors is focusing on offering a more accessible product (derived from it’s exclusive collection) to a larger range of consumers, Coach is attempting the more difficult task of scaling up to an exclusive product which is derived from the basis of it’s accessible product line. (Timberlake, 2012).
Financial value
The price-points of Kors’ accessories are broad and can range from $2,000 handbags to $200 purses, most of which are made in China. Idol described this “high/low” branding strategy while addressing an audience of college students at the University of Pennsylvania by stating: “You guys will go into H&M or Zara and buy a top and buy a jean, but you’re also going to call your mom or dig deep into your savings and try to get a Gucci bag. You’re going to mix high and low, and you don’t feel embarrassed that you bought a Forever 21 top” (Knowledge@Wharton, 2012). The wide range of price points within the brand allows the consumer to dig deep; but for a low income consumer, the $200 purse is still within reach. The brand’s breadth is very wide and it caters to price-value reference points across a wide range of consumers.
Functional value
Kors’ apparel lines focuses on classic American sportswear basics that appeal to a broad age demographic. The collection line is made from the highest quality cashmeres, wools, leathers, and other luxurious fabrics made in high quality production facilities. Rather than producing very “trend-specific” or highly thematic collections each season, which can become outdated shortly thereafter, Kors prefers classic elements that remain timeless; often citing actress Katherine Hepburn and singer/songwriter Carly Simon as his style muses. The brand’s approach to classic and timeless fashion design enables the house to maintain a consistent identity and customer loyalty from season-to-season. To attract a broader audience, Kors has built a significant accessories profile. Accessories such as watches and handbags have an advantage over apparel items in several functional respects. First, consumers can wear their accessories every day –unlike apparel– allowing consumers to feel they get a lot of “bang for their buck”. Second, accessories appeal to consumers due to the lack of sizing and fit; while apparel may no longer fit the customer in future months or years, owing to weight loss/gain, accessories will always perform. Third, accessories are less subject to rapid fashion cycles and trends; because they maintain longer appeal, consumers are more likely to “invest” in a (costly) high quality handbag for use over several seasons. For many consumers, accessories are also used as a means to “dress up” apparel basics (or classics) that are offered at a lower cost.
Individual value
The Kors brand is considered aspirational because it provides a luxury image and “world” that many women wish to belong to. Idol states that the company bills itself as “a purveyor of jet-set luxury” (Knowledge@Wharton, 2012); advertisements frequently display wellattended women emerging/entering private planes at exotic locations. When describing the target customer, Idol states: “Michael has a simple saying. When I say, ‘Michael, who is our target customer?’ he says, ‘She’s 35 years old.’ I ask him, ‘How do you know?’ and he says, ‘Any woman who is 50 wants to be 35 and any woman who is 25 wants the wardrobe of a 35-year-old’” (Knowledge@Wharton, 2012). The brand targets a less conservative and “classically dressed” woman as the Ralph Lauren customer, and a less “preppy” customer than the Tory Burch customer who favors bright, bold colors and graphic prints.
Social value
Kors succeeds because he was the first retailer to attract the key demographic of consumers who have money to spend, but aren’t rich (Lutz, 2012). According to luxury marketing expert Pam Danziger, this growing demographic is referred to as “High Earners Not Rich Yet,” or “HENRYs” and earn between $100,000 and $250,000. Unlike those whose households earn more than $250,00 per year and cut their spending by nearly 30% in 2010, HENRYS increased their spending by 11% from 2009 levels (Lutz, 2012); this demographic totals 21.3 million households and is therefore a critically important part of the consumer market (Lutz, 2012). Companies, such as Kors’, appeal to this audience due to their broad range of price-points that allow access to the socially prestigious brand. For example, with such offerings as $450 handbags and $250 dollar watches, “HENRYs can show off their success without feeling like they’re going overboard” (Lutz, 2012). Wearing Kors, with its multiple points of entry, can communicate an aspirational taste for luxury that allows a moderately high earner to grow into the brand as she becomes more affluent (Fry, Faerm, & Arakji, 2013) or for a judicious, taste-based, choice on the part of a very high earner in wearing luxury without regard to price; high or low. Two of today’s successful mass-market brands have developed or adapted their business models to maximize consumer value and corporate profitability in the context of the emerging demographic of income polarization. Everlane’s radical transparency has demonstrated that an important dimension of luxury; fit, finish and material quality, can be delivered at mass-market prices. Designer collaborations have demonstrated that designer concepts can be delivered at mass-market prices. Michael Kors has demonstrated that the same brand can deliver both a Ferrari and a Mini Cooper line without compromising the quality of either line, or the exclusivity of it’s “high end” offerings. What role do these innovative design-business strategies play in the social and political landscape of America’s widening income distribution?
Inequality amidst plentitude, societal implications
Why does income inequality matter? Some economists have argued that inequality is not the right social ill to focus on. “What matters is how the poor and middle class are doing and how much opportunity they have,” said Scott Winship, an economist at the Brookings Institution. “Until there is stronger evidence that inequality has a negative effect on the life of the average person, I’m inclined to accept it” (Porter, 2012). Even free market advocates who accept income inequality as a natural consequence of growth tend to become alarmed when inequality is accompanied by lack of opportunity and social mobility; the perception that the U.S. is the land of opportunity has probably helped Americans to accept the inevitability of inequality so long as they have the opportunity to get rich too. Bedoes states:
Europeans tend to be more egalitarian, believing that in a fair society there should be no big income gaps. Americans and Chinese put more emphasis on equality of opportunity. Provided people can move up the social ladder, they believe a society with wide income gaps can still be fair. (Bedoes, 2012)
As we have argued, Americans tend to see their own well-being in contextual and relative terms. When asked to make estimates of income inequality in the U.S. “almost all respondents underestimate the true extent of income inequality in the United States”. (Trump, 2012) Humans find it very difficult to process and comprehend large numbers (Paulos, 1988), such as the U.S. national debt. The manner in which humans tend to understand their own material well-being is focused on metrics that are contextual (local), relative, comparative and subjective. These assessments are often arrived at intuitively and heuristically through such questions as “can I still afford to buy myself a new coat this season?” Perception is not reality, especially when the macroeconomic effects of inequality are analyzed. Data indicate that the share of families that manage to rise out of the bottom fifth of earnings has fallen since the early 1980s, as has the share of people that fall from the top. The profile of inequality in the U.S. is complicated and influenced profoundly by racial and geographical factors. Notable, however, given the downward pressures of globalization and technology on the unskilled or low skilled worker, is the sharp rise in the cost of college, making it harder for lower-income and middle-class families to acquire the twenty-first century skills needed to compete in a globalized economy. The correlation between level of education and political participation has been pointed to as an area that leaves the U.S. vulnerable to an educated elite, using the political system to its advantage; “economic resources determine the ability to influence political outcomes” (Glaeser, 2005). This would be a similar scenario to that of large countries with both high Gini scores and historical underinvestment in public K-12 education, such as Brazil and Mexico.
We propose that a discussion of the effects of income inequality should include an assessment of the influence of accessible, well-designed, and inexpensive consumer products in influencing perceived wealth, and masking the perceived affects of restricted access to the real assets that support social mobility (such as appropriate and rigorous secondary and tertiary education). Being relative, comparative and subjective it is difficult to quantitatively prove that accessibility to consumer products influences wealth perception on a mass scale, and, like the probable causes of income inequality itself, their affects cannot easily be measured. Historically however Western governments have witnessed the political consequences of the scarcity of consumer goods that preceded the collapse of the Soviet Union (Lauritzen, 2011). In contrast, the current U.S. consumer landscape offers plentitude, variety, and value along multiple dimensions, perhaps leading to excessive social stability in the face of inequality. As we have attempted to demonstrate, tolerance of income inequality is a deeply behavioral phenomenon, based on subjectively relevant standards of well-being, which, as we have argued, fluctuate according to how people feel about important life domains, which include wealth and financial comfort.
References
1. Aghion P. & Williamson J. (1999). Inequality, growth, and globalization: Theory, history and policy. Raffaele Mattioli Lectures. Cambridge: Cambridge University Press. Retrieved from http://www.fordham.edu/economics/mcleod/AghionWilliamson.pdf#page=1&zoom=auto,0,142 [ Links ]
2. Arghavan, N. & Zaichkowsky, J. (2000). Do counterfeits devalue the ownership of luxury brands? Journal of Product and Brand Management, 9 (7), 485-497. [ Links ]
3. Atkinson, A., Piketty,T. & Saez, E. (2009). Top incomes in the long run of history. National Bureau of Economic Research Working Paper, (15408). Retrieved from http://elsa.berkeley.edu/~saez/atkinson-piketty-saezJEL10.pdf [ Links ]
4. Beddoes, Z. M. (2012, October 13). For richer, for poorer. The Economist. Retrieved from http://www.economist.com/node/21564414 [ Links ]
5. Berry, C. (1994). The idea of luxury. A conceptual and historical investigation. Cambridge: Cambridge University Press. [ Links ]
6. Boushey, H. & Hersh, A. S. (2012). The American middle class, income inequality, and the strength of our economy: New evidence in economics. Center for American Progress. Retrieved from http://www.americanprogress.org/wp-content/uploads/issues/2012/05/pdf/middleclass_growth.pdf [ Links ]
7. Cachon, G. & Swinney, R. (2011l). The value of fast fashion: Quick response, enhanced design and strategic consumer behavior. Management Science, (57) 4, 778-795. [ Links ]
8. Campbell, A. (1981). The sense of well-being in America: Recent patterns and trends. New York: McGraw-Hill. [ Links ]
9. Council of Economic Advisers. (1997). Economic report of the president. Washington, D.C.: U.S. Government Printing Office. [ Links ]
10. Davila, S. (2012, November 30). The internet’s first (real) fashion label. New York Magazine. Retrieved from http://nymag.com/thecut/2012/11/internets-first-real-fashion-label.html
11. Diener, E. (1984). Subjective well-being. Psychological Bulletin, 95. Retrieved from http://internal.psychology.illinois.edu/~ediener/Documents/Diener_1984.pdf [ Links ]
12. Elkington J. (1997). Cannibals with forks: The triple bottom line of 21st century business. Oxford: Capstone Publishing Limited. [ Links ]
13. Ellis, B. (2013, August 7). Find out if a company shares your values. CNN Money. Retrieved from http://money.cnn.com/2013/08/06/pf/company-values/ [ Links ]
14. Forster, M. (2013). Increasing income inequity in OECD countries: Trends, drivers and lessons for policy. AIAS Annual Conference. Retrieved from http://www.uva-aias.net/uploaded_files/regular/ForsterAIAS26Sep2013-1.pdf [ Links ]
15. Fry, A., Faerm, S., & Arakji, R. (2013). Achieving the new graduate dream: Building sustainable business success at a small scale. Cuaderno, 48, 153-175. [ Links ]
16. Glaeser, E. (2005). Inequality. Harvard University Kennedy School of Government, Faculty Research Working Paper Series. Retrieved from http://papers.ssrn.com/sol3/papers.cfm?abstract_id=832653 [ Links ]
17. Hagopian, K. & Ohanian, L. (2012, August 1). The mismeasure of inequality. Hoover Institution Policy Review, (174). Retrieved from http://www.hoover.org/publications/ policy-review/article/123566 [ Links ]
18. Howorth, C. (2013, December 3). Getting the goods: Online shop details where stuff ’s made. New York Post. Retrieved from http://nypost.com/2013/12/03/getting-the-goodonline-shop-details-where-stuffs-made/
19. Kapferer, J.N. (2010, September 15). Luxury after the crisis: Pro logo or no logo? The European Business Review. Retrieved from http://www.europeanbusinessreview.com/?p=2408 [ Links ]
20. Kapner, S. & Passariello, C. (2014, March 3). High prices test wealthy’s will to pay. The Wall Street Journal. Retrieved from http://online.wsj.com/news/articles/SB40001424052702304585004579415110604829016?mg=reno64-wsj&url=http%3A%2F%2Fonline.wsj.com%2Farticle%2FSB40001424052702304585004579415110604829016.html
21. Kuznets, S. (1955). Economic growth and income inequality. The American Economic Review, (65)1. Retrieved from http://www.aeaweb.org/aer/top20/45.1.1-28.pdf [ Links ]
22. Lauritzen, E. (2011). Causes and origins of the collapse of the former Soviet Union (Unpublished thesis). Ohio State University: Ohio. [ Links ]
23. Lerman, R. (1999, May). U.S. Wage-inequity trends and recent immigration. AEA Papers and Proceedings (89)2. Retrieved from http://pubs.aeaweb.org/doi/pdfplus/10.1257/aer.89.2.23 [ Links ]
24. Markovich, S. (2014, February 3). The income inequality debate. Council on Foreign Relations. Retrieved from http://www.cfr.org/united-states/income-inequality-debate/p29052 [ Links ]
25. Masidlover, N. & Passariello, C. (2013, February 13). What is recession?: Americans regain a craving for luxury. The Wall Street Journal. Retrieved from http://online.wsj.com/news/articles/SB10001424127887324880504578300291357105904 [ Links ]
26. Mazur, J. (2000). Labor’s new internationalism. Foreign Affairs, 79(1), 79–93.
27. Milloy, C. (2011, September 13). Study dismisses poverty, but try telling that to the poor. The Washington Post. Retrieved from http://www.washingtonpost.com/local/study-dismissespoverty-but-try-telling-that-to-the-poor/2011/09/13/gIQANZSbQK_story.html [ Links ]
28. New York City General Assembly (NYCGA). (2011). Declaration of the occupation of New York City. #Occupy Wall Street. Retrieved from http://www.nycga.net/resources/documents/declaration/ [ Links ]
29. Obama, President Barrack. (2013, January 28). Opportunity for all: State of the union address. The Washington Post. Retrieved from http://www.cnn.com/interactive/2014/01/ politics/sotu-speech-transcript/ [ Links ]
30. Oliver, R. L. (2010). Satisfaction: A behavioral perspective on the consumer. New York: M.E. Sharpe [ Links ]
31. Organisation for Economic Co-operation and Development (OECD). (2011a). Divided we stand: Why inequality keeps rising. Retrieved from http://www.oecd.org/els/soc/49170768.pdf [ Links ]
32. OECD. (2011b). An overview of growing income inequalities in OECD countries: Main findings. Retrieved from http://www.oecd.org/els/soc/49499779.pdf [ Links ]
33. OECD. (2011c). Gini Scores. [Data File]. Retrieved from http://www.theguardian.com/news/datablog/2011/dec/05/oecd-ineqaulity-report-uk-us [ Links ]
34. OECD (2011d, December 5). OECD inequality report: How do different countries compare? The Guardian. Retrieved from http://www.theguardian.com/news/datablog/2011/dec/05/ oecd-ineqaulity-report-uk-us [ Links ]
35. OECD. (2013). OECD factbook 2013: Economic, environmental and social statistics. OECD iLibary. Retrieved from http://www.oecd-ilibrary.org/sites/factbook-2013-en/03/02/01/index.html?itemId=/content/chapter/factbook-2013-25-en [ Links ]
36. Paton, E. (2013, November 5). Michael Kors beats rivals in luxury retail. Financial Times. Retrieved from http://www.ft.com/cms/s/0/9e781e00-462c-11e3-b495-00144feabdc0.html#axzz2vPC41x7P [ Links ]
37. Porter, E. (2012, March 20). Inequality undermines democracy. The New York Times. Retrieved from http://www.nytimes.com/2012/03/21/business/economy/tolerance-forincome-gap-may-be-ebbing-economic-scene.html?_r=0 [ Links ]
38. Paulos, J. A. (1988) Innumeracy. New York: Hill and Wang. [ Links ]
39. Rector, R. & Sheffield, R. (2011) Understanding poverty in the United States: Surprising facts about America’s poor. The Heritage Foundation. Retrieved from http://www.heritage.org/research/reports/2011/09/understanding-poverty-in-the-united-states-surprisingfacts-about-americas-poor
40. Saez, E. (2013, February 1). Income inequality: Evidence and policy implications. [Youtube video] Retrieved from http://www.youtube.com/watch?v=t_FbB8Romhk [ Links ]
41. Soller, K. (2013, September 29). Everlane: Breaking down the markup. New York Magazine. Retrieved from http://nymag.com/news/business/boom-brands/everlane-2013-10/ [ Links ]
42. Symonds, A. (2012, November). Everlane wants you to buy less. Interview. Retrieved from http://www.interviewmagazine.com/fashion/michael-preysman-everlane/ [ Links ]
43. Thompson, D. (2012, April 5). How America spends money: 100 years in the life of the family budget. The Atlantic. Retrieved from http://www.theatlantic.com/business/archive/2012/04/how-america-spends-money-100-years-in-the-life-of-the-familybudget/255475/ [ Links ]
44. Timberlake, C. (2012, March 16. Michael Kors brand takes on Coach in U.S. luxury market. Bloomberg News. Retrieved from http://www.bloomberg.com/news/2012-03-16/michaelkors-brand-takes-on-coach-in-u-s-luxury-market.html [ Links ]
45. Trump, K.-S. (2012). Perceptions of Income Inequality and Preferences for Income Distributions: Do People Who Perceive Higher Inequality Reject or Accept It? Midwest Political Science Convention, Chicago.United States Bureau of Labor Statistics. [ Links ]
46. Trump, K.-S. (2006) 100 Years of U.S. Consumer Spending: Data for the nation, New York City, and Boston, (991), [Data file]. Retrieved from http://www.bls.gov/opub/uscs/report991.pdf [ Links ]
47. United States Congressional Budget Office. (2011, October). Trends in the distribution of household income from 1979-2007 [Data file]. Retrieved from http://www.cbo.gov/sites/default/files/cbofiles/attachments/10-25-HouseholdIncome.pdf [ Links ] Helvetica, sans-serif">48. Wiedmann, K.P., Hennigs, N., & Siebels, A. (2007). Measuring consumer’s luxury value perception: A cross-cultural framework. Academy of Marketing Science Review, 2007. Retrieved from http://www.amsreview.org/articles/wiedmann07-2007.pdf

