


Serviços Personalizados
Journal

Artigo
 texto em
  Espanhol (pdf)
 Artigo em XML
 Referências do artigo
 Enviar este artigo por email
Indicadores
-
 Citado por SciELO
Links relacionados
-
 Similares em
SciELO
Similares em
SciELO
Compartilhar

 Permalink
Revista argentina de cirugía
versão impressa ISSN 2250-639Xversão On-line ISSN 2250-639X
Rev. argent. cir. vol.115 no.4 Cap. Fed. dez. 2023 Epub 29-Nov-2023
http://dx.doi.org/10.25132/raac.v115.n4.cymmli
Articles
Relative risk and odds ratio: basic concepts
Relative risk (RR) and odds ratio (OR) are wellknown concepts, but often not well understood. The aim of this article is to introduce the basic concepts in a didactic fashion, and to provide clarity on those contents that I consider fundamental for their better understanding.
The RR and OR are used to compare how often a specific event happens in two different groups - one exposed to a risk factor and one not - as defined by the investigator. The risk factor can be a treatment, an intervention or any other condition also defined by the investigator. The term “risk”, used as probability, does not always imply a negative result. Risk factors are also called predictor variables; the consequence or result obtained is whether the event happens or not.
Relative risk (RR) and odds ratio (OR) are measures of effect size and are used for categorical variables1,2 and continuous variables3. Logistic regression (or logit model) is an example of the latter. Because of its complexity, this topic requires a dedicated article.
Hypothesis tests can show us that there is a difference between the groups at a certain p-value, but they do not indicate the strength of difference. The strength or magnitude of the difference is the effect size4.
These effect size measures are widely used in epidemiology, clinical research, and meta-analyses. Estimating their mean values is simple, but calculating confidence intervals requires more effort. However, statistical software packages make it easier to estimate these measures. I recommend the use of R; with the graphic user interface (GUI), Rstudio. It is a free software. (GNU Public License)5,6.
As a practical example, let us consider 2 groups: treatments or exposures, and presence or absence of the event (Table 1*).
Table 1. Example of 2 × 2 table. Instead of treatments we may use exposed yes, exposed no, intervention 1, intervention 2, etc.
| Event yes | Event no | |
|---|---|---|
| Treatment | a | b |
| Placebo | c | d |
* For online calculators, the rows and columns may be arranged differently.
Before proceeding, I will describe some conceptual definitions in order to introduce a common language that will allow us to better understand the contents.
Risk is the likelihood of an event occurring within a population or sample when exposed to such risk, treatment, or any other factor designated as a risk. If I may reiterate, the event can have either positive or negative effects on the individual.
Absolute risk: the proportion of persons presenting an event divided by the total number of persons. The probability value ranges from 0 to 1. In Table 1, they are separated in groups with and without risk. Both are absolute risks: a/ (a + b) and c / (c + d)
The RR is estimated as one absolute risk divided by another absolute risk4; for example, absolute risk of exposed subjects/absolute risk of unexposed subjects, or in treatment A and in treatment B: (a / (a + b)) / (c / (c + d)).
Odds: ratio between those who presented the event and those who did not. In treatment A, a / b, and in treatment B, c / d. The concept of odds is widely used in betting and gambling; it is less intuitive than the concept of risk.
Odds ratio is a ratio of two sets of odds: (a / b) / (c / d)
The value of both measures (RR and OR) may range anywhere between zero and infinity.
A value of 1 indicates that there is no difference in risk (or odds) between the treated or exposed groups.
A value less than 1 indicates a protective effect when the event is harmful. A value greater than 1 indicates greater risk. If the event is positive, the interpretation is reversed; as can be seen, it depends on the context of the research: we look for a result greater than 1 if the event is a response to treatment.
The value is incomplete without estimating confidence intervals (CI); the 95% CI (probability of error alpha = 0.05 or 5%) is the most used. If the confidence interval includes the value 1, the risk is not significant. The concept of confidence interval deserves a separate article.
The formulas for calculating CIs are:
RR 1 ± z / square root of chi and OR 1 ± z / square root of chi
The explanation of the exponent for the CI: “z” is the z value, that for a 95% confidence interval is 1.96, and “chi” is the chi value of the chi-square test.
The closest chi value for this sample is the mean chi2 between the values without and with the Yates correction5. In the case of Table 2, the value is 3.43. It is a simpler estimator than the more precise calculations that are performed with the natural logarithms and their anti-logarithms.
Table 2 shows the z-values for the CIs most used.
Table 2. Critical z values for confidence interval calculation; alpha is the probability of error.
| alpha | CI | z value |
|---|---|---|
| 0.05 | 95% | 1.96 |
| 0.01 | 99% | 2.58 |
When the incidence of an event is low (< 10%), the RR and OR are nearly identical. The more frequent the event becomes, the more the OR will overestimate the RR when it is greater than 1 or underestimate the RR when it is less than 1.
Here is an example with imaginary data:
If “Event yes” is a favorable response to the patient when compared to placebo, then the RR represents a positive response of the treatment. Otherwise, if it is an undesirable effect, it the RR represents a negative response.
The calculation can be done manually. The numbers inside the parentheses should be calculated first.
RR = (a / (a + b)) / (c / (c + d))
2.57 # relative risk
OR = (a/b) / (c/d)
2,87 # odds ratio, which is slightly overestimated.
95% confidence intervals, calculated with R, library epiR7
Relative risk 2.57 (0.96 - 6.87)
Odds ratio 2.87 (0.97 - 8.46)
The confidence interval includes the value 1 in the relative risk and odds ratio Fig. 1).
Chi-square (chi2) = 3.89 and p = 0.049.
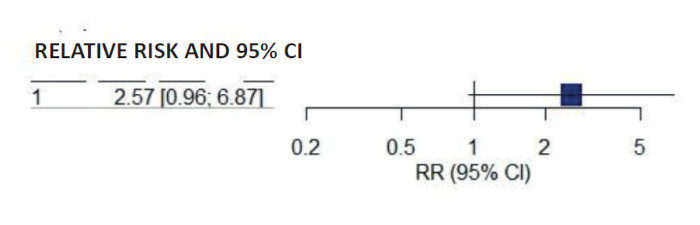
FIGURA 1 Forest plot reduced to its minimum expression due to being a single study with only one variable (proportions). RR with its corresponding 95% CI. “JAMA” format.
This is a borderline statistical significance (p-value just below 0.05) which was thoroughly debated in 2001 in a letter to the editor between Raúl Borracci and Carlos Tajer8, which I recommend reading for those interested in further understanding the subject. The lower limits of the confidence intervals are also borderline (just below 1) and the confidence intervals are non-significant.
The total number of patients exposed to risk is not available in case-control studies. Case-control studies begin by looking at the endpoint (event yes/ event no). Researchers then examine the risk factors in retrospect; therefore, as it is impossible to calculate the relative risk (RR), the OR is used.
Both measures can be used in prospective studies, although RR is recommended because it is based on the random assignment of groups to one treatment or another. In epidemiology, a database is created with the individuals included and prospectively observing occurrence or non-occurrence of events.
Logistic regression models yield OR (log odds), that must be transformed. In prospective studies, it is convenient to adjust them to RR when the risk of the outcome of interest is greater than 0.1 (10%) due to the overestimation mentioned above9.
The interpretation of risk should not ignore the previous absolute risk in the population, and the prevalence of the event in the population is used for this purpose10.
For a rare event of 0.02%, an RR or OR of 2 would raise the risk from 0.02% to 0.04%. If the event is common (20%), a risk of 2 with treatment or exposure will double the risk to 40%. So, we should not limit ourselves to the analysis of our table because we would overlook the population perspective defined in the inclusion criteria.
RR reduction (RRR)
When the RR is greater than 1, the RRR is RR-1; when the RR is less than 1, the RRR is 1-RR4,10.
In this case: RRR = 2.57-1 = 1.57. Without a thorough analysis, this would mean a 1.57-fold increase in the positive effect of the treatment, which is not supported by its confidence interval.
From the RR to the number needed to treat (NNT)11
Although we are dealing with a borderline statistical situation, I will use the same results to add other concepts.
ARR: absolute risk reduction is the difference in risk between those who were exposed and those who were not, or those who received treatment and those who received a placebo. Referring to Table 3, the absolute risk difference between the treatment group and the placebo group is 0.16 - 0.06 = 0.10. Let’s assume the outcome is a favorable response to treatment.
Table 3 Example with totals by rows, columns, and grand total
| Event yes | Event no | Total | Absolute risk | |
|---|---|---|---|---|
| Treatment | 13 | 68 | 81 | 0.16 |
| Placebo | 5 | 75 | 80 | 0.06 |
| Total | 18 | 143 | 161 | 0.11 |
The NNT is defined as the inverse of the absolute risk reduction; 1 / RAR = 1/ 0.10 = 10. Ten is the number of patients who need to be treated in order to achieve one additional favorable outcome.
If the event is favorable to the patient, it is advisable to use the acronym NNTB (number needed to treat to benefit). For unfavorable events, NNTH (number needed to treat to harm) is recommended.
The method to calculate CIs for NNT is complex and is done using the CI for AAR12. The CIs for the NNT are not symmetrical because the distribution is non- normal. The values are shown in Table 4.
TABLE 4.
| Lower limit | Value | Upper limit | |
|---|---|---|---|
| ARR | 0.005 | 0.10 | 0.195 |
| NNT | 5 | 10 | 213 |
ARR: absolute risk reduction; NNT: number needed to treat. Expressed as values and 95% CI lower and upper limits. The NNT was rounded to whole numbers.
In this case, the treatment resulted in a favorable difference in the response outcome of the treated group. However, the width of the confidence interval for both measures does not permit a valid conclusion in this situation, despite the RR being 2.57 and the OR being 2.87.
The importance of time
I will end with a quote by Chittaranjan Andrade9 that I really liked: “ A treatment that doubles the “risk” of 2-year cancer survival could be more desirable that one that doubles the 2-month “risk of cancer survival”. We are referring to a RR = 2 in both cases. Risk in quotation marks because it is not a negative effect.
The results should be analyzed with critical and comprehensive clinical judgment, and the prevalence of risk in the population should not be omitted because our estimates are based on a sample.
The value of the measures described without knowing their confidence intervals is very limited and may lead to invalid or even incorrect conclusions.
Referencias bibliográficas /References
1. Mendivelso FO, Rodríguez IM. Riesgo relativo. Rev Médica Sanitas. 2019;22(2):72-5. https://revistas.unisanitas.edu.co/index.php/rms/article/view/446 [ Links ]
2. Dagnino J. Riesgo relativo y ODDS RATIO (razón DE VENTAJAS). Revistachilenadeanestesia.cl. 2014. https://revistachilenadeanestesia.cl/PII/revchilanestv43n04.10.pdf [ Links ]
3. Thierer J. Comunicaciones SAC. ¿Qué son y qué expresan el riesgo relativo y el odds ratio? Parte 2. SAC | Sociedad Argentina de Cardiología. Buenos Aires: Sociedad Argentina de Cardiología; 2016. https://www.sac.org.ar/cuestion-de-metodo/que-son-y-que-expresan-el-riesgo-relativo-y-el-odds-ratio-parte-2/ [ Links ]
4. Borracci R, Arribalzaga E. La medición de la magnitud del efecto al comparar tratamientos quirúrgicos. Rev Argent Cirug. 2004;87(3-4):123-9. https://revista.aac.org.ar/index.php/RevArgentCirug/2004 [ Links ]
5. R Core Team. _R: A Language and Environment for Statistical Computing_. R Foundation for Statistical Computing, Vienna, Austria; 2023. https://www.R-project.org/ [ Links ]
6. Proyecto GNU - Free Software Foundation. https://www.gnu.org/licenses/licenses.es.html [ Links ]
7. Stevenson M, Sergeant E (2023). _epiR: Tools for the Analysis of Epidemiological Data_. R package versión 2.0.62, https://CRAN.R-project.org/package=epiR [ Links ]
8. Borracci R, Tajer C, Doval H, Tessler J. Rev Argent Cardiol. 2001: 69:667-71. Carta de lectores y respuesta. Ic. /c] Para. El uso del riesgo relativo ( RR), el odds ratio ( OR) https://www.old2.sac.org.ar/wp-content/uploads/2014/04/1477.pdf [ Links ]
9. Zhang J, Yu KF. What's the relative risk? A method of correcting the odds ratio in cohort studies of common outcomes. JAMA. 1998;280(19):1690-1. http://dx.doi.org/10.1001/jama.280.19.1690 [ Links ]
10. Andrade C. Understanding relative risk, odds ratio, and related terms: as simple as it can get: (Clinical and practical psychopharmacology). J Clin Psychiatry. 2015;76(7):e8857-61. https://www.psychiatrist.com/jcp/assessment/research-methods-statistics/understanding-relative-risk-odds-ratio-related-terms/ [ Links ]
11. Molina Arias M. Cálculo de la reducción del riesgo y el número necesario de pacientes a tratar. Rev Pediatr Aten Primaria. 2012;14(56):369-72. https://scielo.isciii.es/scielo.php?script=sci_arttext&pid=S1139-76322012000500014 [ Links ]
12. Bender R. Calculating confidence intervals for the number needed to treat. Control Clin Trials. 2001;22(2):102-10. http://dx.doi.org/10.1016/s0197-2456(00)00134-3 [ Links ]
 Este es un artículo publicado en acceso abierto bajo una licencia Creative Commons
