Serviços Personalizados
Journal
Artigo
Indicadores
-
 Citado por SciELO
Links relacionados
-
 Similares em
SciELO
Compartilhar
Revista veterinaria
versão On-line ISSN 1669-6840
Rev. vet. vol.23 no.2 Corrientes dez. 2012
Biological evaluation of animal and vegetable protein test feeds in broilers and rats
Khalique, A.1; Marghazani, I.B.2
1 Department of Animal Nutrition, University of Veterinary and Animal Sciences (UVAS), Lahore, Punjab, Pakistan.
2 Faculty of Veterinary and Animal Sciences, University of Agriculture, Water and Marine Sciences (LUAWMS), Uthal, Balochistan, Pakistan. Cell#: +92 333 7896071. E-mail: marghazani76@yahoo.com.
Abstract
Study was conducted to know the biological value of fish meal, meat meal, blood meal, sesame oil meal, cottonseed meal, and guar meal (Cyamopsis tetragonoloba) in two different species (ten day old broiler chicks, n=96; and weaning albino rats, n=64). These protein sources were added into nitrogen free diet on protein equivalent basis to formulate eight different diets including six test diets, a basal and a standard diet. Results revealed that both chicks and rats showed significant differences (p< 0.05) in feed intake, weight gain and feed conversion ratio for animal and protein feeds. Fish meal in most of the measurements was similar (p>0.05) to casein in chicks. Weight gain ranked in declining order for diets containing fish meal, meat meal, sesame oil meal, cotton seed meal, blood meal and guar meal in both species. On standard stock diet ad libitum after drastic restriction period, both species showed a compensatory growth and nitrogen retention.
Key words: Broiler; Rat; Protein feeds; Growth performance; Biological evaluation.
Evaluación biológica de proteínas animales y vegetales utilizadas como alimento de pollos parrilleros y ratas.
Resumen
El estudio fue dirigido para conocer el valor biológico de las harinas de pescado, carne, sangre, aceite de sésamo, semilla de algodón y guar (Cyamopsis tetragonoloba) en dos diferentes especies animales (pollitos parrilleros de diez días de edad, n=96; ratas albinas destetadas, n=64). Estos recursos proteicos se agregaron a dietas libres de nitrógeno como base equivalente proteica, formulándose ocho dietas diferentes que incluyeron seis dietas de prueba, una dieta basal y otra estándar. Los resultados revelaron que los pollitos y las ratas mostraron diferencias significativas (p< 0,05) en el consumo de alimento, ganancia de peso y tasa de conversión alimentaria por animal y proteína ingeridas. En la mayoría de las mediciones la harina de pescado fue similar (p>0,05) a la caseína en los pollitos. La ganancia de peso se ordenó en orden decreciente en dietas que contenían harinas de pescado, de carne, de aceite de sésamo, de semilla de algodón, de sangre y de guar, en ambas especies. Sobre el stock estándar, la dieta ad libitum después de un período de restricción drástico, mostró crecimiento compensatorio y retención de nitrógeno en ambas especies.
Palabras clave: Pollito parrillero; Rata; Alimentos proteicos; Crecimiento; Evaluación biológica.
Recibido: 19 abril 2012
Aceptado: 24 septiembre 2012
INTRODUCTION
Pakistan's population is increasing at an alarming rate. The protein requirement of such a huge segment of population can be met by increasing the quality protein in terms of meat and eggs. Feed is major contributor in production cost of poultry farming. Of feed nutrients, protein is the most expensive nutrient in feed formulations. Nutritive value of feed resources varies with different countries due to difference in agronomic practices and industrial processing 7.
Further, feeds biological efficiency also varies in different species. In this respect, protein quality is perhaps the most important single factor which demands serious consideration while formulating poultry rations. It, therefore, becomes necessary to test the protein quality of important local protein source for poultry.
The criteria of such determinations either include chemical, biological and microbiological parameters or based simply on the general performance of the experimental animals. The biological techniques generally give more valid results and have mostly involved the rats with a few studies on chicks as experimental subjects. Studies on rats have revealed a close relationship between net protein utilization (NPU) from certain meals of animal and vegetable origin 8.
Comparable values of protein efficiency ratio (PER) and NPU from different sources of feed between rats and chicks are also reported in earlier studies 1.To assign the true values to protein sources used in poultry feed formulation, it seems more appropriate to use chicks instead of rats in biological evaluation of poultry feed ingredients. Hence, this study was conducted for biological evaluation of protein quality of six commonly used animal and vegetable poultry test feeds in chicks and rate assay. The specific objectives of the study were to determine the feed intake, weight gain, feed conversion ratio, protein intake, protein efficiency and standard protein efficiency ratio of test and standard diets in chicks and rats.
MATERIAL AND METHODS
Representative samples of six different protein source i.e., fish meal (FM), meat meal (MM), blood meal (BM), cottonseed meal (CM), sesame oil meal (SM) and guar meal (GM, Cyamopsis tetragonoloba ) were analyzed for proximate composition 2.
Nitrogen free basal diet was formulated 3 and the six test feeds were added into the basal diet on protein equivalent basis to prepare the test diets. Reference diet was formulated with casein. These diets were tested in two concurrent experiments on weanling albino rats and ten days old broiler chicks of mixed sexes for a period of 10 days.
In first trial, sixty four (64) weaning albino rats were equally divided into 16 replicates. These replicates (each replicate having 4 rats) were put on 8 diets including 6 test diets, a basal and a reference standard diet in such a way that there were two replicates for each diet. In second trial, ten day old ninety six (96) broiler chicks of 118±30 g body weight were equally divided into 24 replicates. These replicates (each replicate having 4 chicks) were fed on same diets in such a way that there were three replicates on each diet. Data on feed intake and weight gain was recorded daily and values for weight to gain ratio, protein efficiency ratio (PER) and standard PER were calculated as; PER= weight gain/ protein intake by test animals while, Standard PER = intake of protein on test diets/ intake of protein on casein diet.
After 10 days test period the rats and chicks were put on a routine diet containing 22 percent protein with 3000 Kcal ME for 10 days duration to observe the repletion status. Data thus collected on all these parameters were subjected to statistical analysis using analysis of variance technique under factorial design 11. Means were compared for significance using Duncan's multiple range test 4.
RESULTS AND DISCUSSION
Proximate composition of six different test diets showed that crude protein contents (%) were 48.54 in FM, 50.21 in MM, 63.78 in BM, 40.94 in CM and 44.27 in SM and 44.32 in GM. These ingredients were used to compose six different test diets (Table 1). Feed intake, weight gain and feed conversion ratio (FCR) in chicks and rats fed on various experimental rations are given in Table 2.
Table 1. Ingredients composition of different test feeds (%).
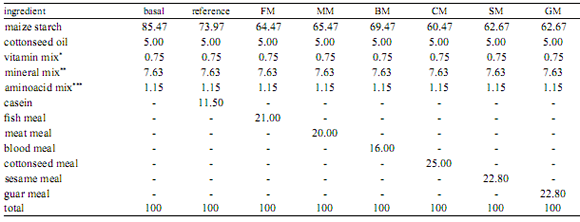
FM: fish meal, MM: meat meal, BM: blood meal, CM: cottonseed meal, SM: sesame oil meal, GM: guar meal (Cyamopsis tetragonoloba).
* Vitamin mixture, per 100 g basal diet contained: Vit. A 880 IU, Vit. D3 220 IU; Vit. E 5 mg; Vit. K 0.2 mg; biotin 22 mg; folic acid 100 µg; thiamine 300 mg; pyridoxine 1 mg; riboflavin 1 mg; niacin 5 mg; calcium pantothenate 3 mg; cyanocobalamine 2 µg; glucose 0.5 g; including choline chloride 0.15 g.
**
Mineral mixture, per 100 g basal diet contained: K2H2 PO4 1.61 g; MgSO4 .7H2 O 0.51 g; MnSO4 . 4H2O 0.25 g; NaCl 0.837 g; Fe-citrate-5H2O 0.137 g; KI 0.004 g; ZnCl2 1.5 mg; CuSO4.5H2O 1.5 mg; Ca (H2PO4)2 2.5 g and CaCO3 2.00 g.
*** Aminoacid mixture, per 100 g basal diet contained: glycine 0.20 g; L-lysine 0.20 g and DL-methionine 0.35g.
Table 2. Feed intake, weight gain and feed conversion ratio (FCR) of chicks and rats on test diets.
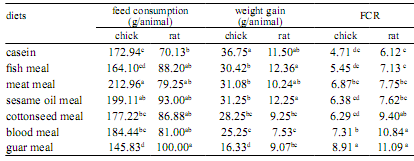
Means with different superscripts within column and row under same heading are significantly different.
Feed intake was highest (p< 0.05) in chicks on meat meal while rats showed maximum intake on guar meal diet, followed by reference diet (casein) in both species. Chicks showed minimum (p< 0.05) intake on guar meal while rats on blood meal diet. These results on feed intake suggest the innate preference differences of test diets in both species.
Chicks showed highest (p< 0.05) weight gain on casein despite of highest feed intake on meat meal. However, among test diets, it showed highest (p< 0.05) weight gain on meat meal and lowest (p< 0.05) on guar meal. On the other hand, weight gain in rats was highest (p< 0.05) on fsh meal and lowest (p< 0.05) on blood meal.
Feed conversion ratio i.e., feed consumed per unit gain was highest (p< 0.05) on guar meal and lowest (p< 0.05) on casein diet in chicks while, rats showed maximum FCR (p< 0.05) on guar meal and blood meal while minimum on casein and fsh meal. Comparatively, feed conversion efficiency was better in chicks than rates.
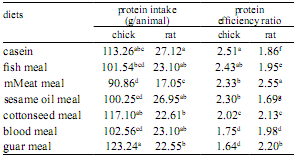
Protein intake, protein efficiency ratio (PER) and standard PER of chicks and rats on test diets are given in Table 3. Protein intake was highest (p< 0.05) on meat meal and lowest on guar meal in chicks. Rats showed highest (p< 0.05) protein intake on guar meal and lowest on casein. Protein efficiency ratio was highest (p< 0.05) on casein and lowest (p< 0.05) on guar meal in chicks. This trend of PER was similar in case of rats. However, the lowest PER was similar (p>0.05) on guar meal and blood meal. Standard PER was maximum (p< 0.05) on fish meal and minimum on guar meal in chicks. Rats showed similar (p>0.05) standard PER on all test diets.
Table 3. Protein intake, protein efficiency ratio and standard protein efficiency ratio of chicks and rats on test diets.
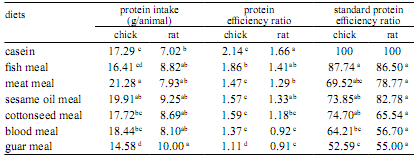
Means with different superscripts within column and row under same heading are significantly different.
In series of studies on chicks, it was concluded that the response to the test material expressed as PER gave no more precision than the weight gain alone 3. Those results coincide with present study where all the protein sources resulted in better feed efficiency ratio with higher weight gains indicating that the precision of the result are similar with the two parameters measured. These authors further observed that feed efficiency ratio as a protein quality indicator also contained in it a margin of error due to appetite of the animals.
The results of the rat assay in the present study appear to include such margin of error in some cases, i.e., weight gain on casein diet (11.50 g) gave feed: gain ratio (FGR) of 6.10 whereas, the rats fed fish meal as a protein source showed (12.36 g ) gain with FGR 7.13. Similarly the SM containing diet caused FGR of 7.62 with an average weight gain of 12.25 g. It explains that the rats ate some part of feed just to satisfy their appetite so more feed was required for unit increase in weight gain. PER recorded in present study also agree with those 6 who found, through bioassays in five different laboratories, significant variation in PER due to species of animals and protein sources along with interaction among the variables.
The biological parameters for protein quality obtained through 10 days bioassay time with rats were in line with earlier study 5.The results on PER depicted an exact picture of protein quality of poultry feed stuffs. Casein produced significantly (p< 0.01) better protein efficiency for body weight gain in rats but FM and SM was similar to it in case of chicks. With regard to PER, it was observed that the chicks had far greater ability of converting protein into growth. But, the rats detected the protein quality better from the three vegetable protein sources, i.e. 0.91 for GM, 1.18 for CM and 1.33 for SM. The standard PER was found similar in both types of animals.
During post test period the chicks and rats showed a compensatory growth by consuming more feed with much better utilization (Table 4). Feed intake in chicks was highest (p< 0.05) on reference diet (casein) and was lowest (p< 0.05) on test diets. However among test diets, it was maximum (p< 0.05) on fish meal and minimum on blood meal in chicks. Conversely, rats showed similar (p>0.05) feed intake on all test diets including reference diet. Weight gain was highest (p< 0.05) on guar meal and lowest on meat meal in chicks on all diets. Rats showed highest (p< 0.05) weight gain on casein and lowest (p< 0.05) on meat meal. Both species showed lowest biological efficiency for meat meal. FCR was maximum (p< 0.05) for guar meal and blood meal and minimum for casein, fish meal, meat meal and SM in chicks. Rats showed maximum FCR value on SM and minimum FCR value (p< 0.05) for guar meal.
Table 4. Feed intake, weight gain and feed conversion ratio of chicks and rats on standard diets.
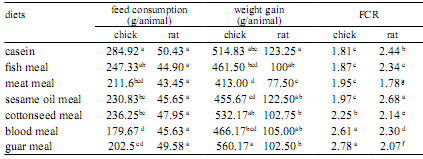
Means with different superscripts within column and row under same heading are significantly different.
These results on chicks and rats for weight gain, feed intake and feed : gain ratio, without taking into account the source of protein previously fed, agree with literature 10 where reported that chicks placed on restricted feeding for 6 to 12 days followed by ad libitum feeding recovered weight gain to an extent that they were heavier than the chicks at ad libitum feeding during the restricted period. There was no regular pattern of feed intake except that the animals of both the species fed stock diet had consumed much more feed during this phase of the experiment.
These findings are also in agreement to authors 9 who reported increased weight gain and better feed efficiency in chicks fed ad libitum following the restricted feeding period at an early age. It may be due to avidity for consuming as a compensation to make up the body weight gain equal to the age group of control group. In PER, there was an improvement in weight gain per gram of protein consumed by both species when fed ad libitum on a standard stock diet during post experimental period (Table 5). This was perhaps due to the fact that the protein consumption was also higher which resulted in more growth and improved PER values.
Table 5. Protein intake and protein efficiency ratio of chicks and rats on standard diets.
Means with different superscripts within column and row under same heading are significantly different.
This study concludes that both chicks and rats differ in biological performance of different animal and vegetable protein test feeds. It is more appropriate to use chicks for biological efficiencies of different test feeds rather than rats.
1. Arnould R, Fockedey J. 1979. Search for a measure of quality of protein independent of the composition of the ration. Publ Lab Biochim Nutrit Fac Sci Agron Louvain, 27 p. Nutr Abst Rev 50 (4): 1215. [ Links ]
2. Association of Official ad Analytical Chemists - AOAC. 2000. Official Methods of Analysis of the AOAC, 17th ed., Arlington (Virginia, USA), 186 p. [ Links ]
3. Carpenter K, McDonald JI, Miller WS. 1972. Protein quality of feed stuffs. Brit J Nutr 27: 7-17. [ Links ]
4. Duncan DB. 1955. Multiple range and multiple F tests. Biometrics 11: 1-42. [ Links ]
5. Eliott JG, McClure FD. 1983. Sources of variation in the bioassay of protein value. J Ass Off Analyt Chem 66: 46-47. [ Links ]
6. Hackler LR, Bodwell CE, Hapich MI, Philips JG, Derse PH, Eliott JG, Hartnagel RE, Kapiszka EL, Mitchell GV, Hopkins DT, Parsons GF, Prescher EE, Robaidek ES, Womack M. 1984. Protein efficiency ratio: AACC/ASTM collaborative study. J Ass Off Analyt Chem 67: 66-77. [ Links ]
7. Marghazani IB, Habib G, Siddiqui MM. 1999. Nitrogen retention and nutrients digestibility in sheep given a basal diet of Sorghum hay supplemented with protein of varying degradabilities. Sarhad J Agric 15: 381-386. [ Links ]
8. Mokady S, Viola S, Zimmermann G. 1969. A new biological method for estimating food protein nutritive value. Brit J Nutr 27: 491-495. [ Links ]
9. Narshari D, Reddy CV, Rao NV. 1976. Limiting the feed intake of growing egg-type pullets at different levels and duration. I. Effect on growth and sexual maturity. Indian J Anim Sci 46: 244-249. [ Links ]
10. Plavnik I, McMurtry JP, Rosebrough RW. 1986. Effect of early feed restriction in the broiler. I. Growth performance and carcass composition. Growth 50: 68-76. [ Links ]
11. Steel RG, Torrie JH, Dickey DA. 1997. Principles and procedures of statistics. A biochemical approach, 3rd ed., McGraw-Hill, New York, USA. [ Links ]


