


Serviços Personalizados
Journal

Artigo
 texto em
  Espanhol (pdf)
 Artigo em XML
 Referências do artigo
 Enviar este artigo por email
Indicadores
-
 Citado por SciELO
Links relacionados
-
 Similares em
SciELO
Similares em
SciELO - Veja o fascículo
Compartilhar

 Permalink
Revista argentina de cardiología
versão On-line ISSN 1850-3748
Rev. argent. cardiol. vol.92 no.1 Ciudad Autónoma de Buenos Aires mar. 2024 Epub 28-Fev-2024
http://dx.doi.org/10.7775/rac.es.v92.i1.20723
Relacionado com: 10.7775/rac.es.v92.i1.20740
ORIGINAL ARTICLE
Optimizing Echocardiograms Interpretation with the Application of Machine Learning in the WASE Study
1
 http://orcid.org/0000-0003-4317-8725
1
http://orcid.org/0000-0001-6424-7860
2
http://orcid.org/0000-0002-0597-1776
3
http://orcid.org/0000-0003-3698-549X
1University of Chicago Medical Center, Chicago, IL
2MedStar Health Research Institute, Washington, DC
3TOMTEC Imaging Systems, Unterschleissheim, Germany
4Centro Privado de Cardiología, Tucumán, Argentina
5Instituto Cardiovascular de Buenos Aires, CABA, Argentina
Background:
The growing number of echocardiographic tests and the need for strict adherence to international quantification guidelines have forced cardiologists to perform highly extended and repetitive tasks when interpreting and analyzing increasingly overwhelming amounts of data. Novel machine learning (ML) techniques, designed to identify images and perform measurements at relevant visits, are becoming more common to meet this obvious need for process automation.
Objectives:
Our objective was to evaluate an alternative model for the interpretation and analysis of echocardiographic tests mostly based on the use of ML software in order to identify and classify views and perform standardized measurements automatically.
Methods:
Images came from 2000 healthy subjects, 1800 of whom were used to develop ML algorithms and 200 for subsequent validation. First, a convolutional neural network was developed in order to identify 18 standard echocardiographic views and classify them based on 8 thematic groups (stacks). The results of automatic identification were compared to classification by experts. Later, ML algorithms were developed to automatically measure 16 Doppler scan parameters for regular clinical evaluation, which were compared to measurements by an expert reader. Finally, we compared the time required to complete the analysis of an echocardiographic test using conventional manual methods with the time needed when using the ML model to classify images and perform initial echocardiographic measurements. Inter- and intra-observer variability was also analyzed.
Results:
Automatic view classification was possible in less than 1 second per test, with a 90% accuracy for 2D images and a 94% accuracy for Doppler scan images. Stacking images had a 91% accuracy, and it was possible to complete the groups with any necessary images in 99% of cases. Expert agreement was outstanding, with discrepancies similar to those found between two human readers. Applying ML to echocardiographic imaging classification and measurement reduced time of analysis by 41% and showed lower variability than conventional reading methods.
Conclusion:
Application of ML techniques may significantly improve reproducibility and efficiency of echocardiographic interpretations and measurements. Using this type of technologies in clinical practice may lead to reduced costs and increased medical staff satisfaction.
Key words: Artificial intelligence; Machine learning; Echocardiography
INTRODUCTION
The usual interpretation of a complete echocardiographic test involves review of multiple groups and types of images, whatever their order of acquisition. The echo technician needs to classify and incorporate the information contained in all images and to interpret them in order to report any anatomical and/or cardiovascular function features. Therefore, it is not uncommon to perform several reviews of a large number of images, which might become a long and tiresome process for the professional. In addition, once any relevant images have been identified, a significant number of echocardiographic measurements need to be performed following the recommendations by major international associations guidelines. It is important to consider that measurements may vary significantly across readers. 1), (2), (3), (4), (5), (6), (7), (8 Even though it is difficult to determine the exact amount of time required by this selection, categorization, and quantification process during an echocardiographic test, the possibility of making these stages shorter is highly attractive to optimize the entire process and workflow involved.
Recent studies have shown that both imaging classification and echocardiographic measurements can be automated using machine learning (ML) techniques. 9), (10), (11 Our hypothesis is that these new tools might optimize the entire clinical interpretation process for echocardiographic tests and complete it in a faster and more reproducible manner than conventional manual techniques, eventually contributing to a more efficient and improved workflow for the staff involved. This new approach might include: (a) automated identification of the type and view of the echocardiographic image, (b) classifying and sorting images into categories or groups (stacks) defined by predetermined anatomical structures, (c) fully automated measurements with standard parameters for every structure, and (d) manual correction of these automated measurements (if necessary) in order to improve accuracy.
Our objective was to analyze the feasibility of this new work paradigm by evaluating its impact on the efficiency and reproducibility of human interpretation.
METHODS
Images and population
We have used several echocardiographic tests in an attempt to represent a wide range of zoom, depth, zone of interest width, focus, gain, and image quality. These tests were performed in 2000 healthy subjects, previously included in the WASE study (World Alliance Societies of Echocardiography normal values study). The objective of the study was to determine normal values for multiple quantifiable echocardiographic parameters. 12 Subjects came from 19 sites in 15 countries and included a large group of adults of both sexes, and various races, ethnic and age groups. These tests used different marketed echocardiographic systems available and followed the latest recommendations from the American Society of Echocardiography (ASE). 13 Images were rated by an expert according to the type of image (2D, pulsed wave Doppler, etc.) and echocardiographic view (4 chambers apical, long axis parasternal, etc.). Regular measurements were performed by a central echocardiography expert (core laboratory) with strict adherence to the latest recommendations. 14 For our study, we used images from 1800 subjects to develop and train ML algorithms (training group), while the remaining 200 were used to evaluate these algorithms (testing group).
Study design
The study was divided into 3 protocols. Protocol 1 was designed to develop ML algorithms and evaluate accuracy for automated identification of the type of image and echocardiographic view, similarly to the approach used in recent studies 9), (10), (11, as well as to classify these images in stacks according to certain anatomical structures or reference “physiological events” (for example, mitral valve, diastolic function), which would eventually guide image review and interpretation. Protocol 2 was designed to develop and evaluate ML accuracy for automatic measurement of conventional echocardiographic parameters, similar to those used by Zhang et al. 10 Finally, Protocol 3 was designed to determine the feasibility and effectiveness resulting from the combination and integration of these protocols into echo reading, assessing efficiency (time saving) and reproducibility (measurement variability) parameters, and comparing these results to current interpretation and measurement methods.
The evaluation of Protocol 1 included developing and training a convolutional neural network (CNN) using measurements provided by an independent reader (TM) unfamiliar with development of the ML algorithm. Protocol 2 was evaluated by comparing measurements provided by the ML algorithm to those supplied by a second reader (KA), coming from a site different from that of the first reader. Finally, Protocol 3 compared the performance of 2 readers (KA and KK) who did not take part in the ML algorithm development and training phase.
Development of ML software, as well as the study design, were the result of the collaboration between the investigators involved (MedStar and University of Chicago) and TOMTEC Imaging Systems (Unterschleissheim, Germany). Principal investigators (RML, FMA) had unrestricted data access and analyzed data independently from TOMTEC, assuming full responsibility for the findings presented here.
Convolutional Neural Network algorithm
Training to detect every parameter of interest was conducted through a cascade strategy including 3 subdetection stages. This initial setup was supplemented by an image pre-processing mechanism in order to standardize any resulting information. This included detection of the ultrasound bundle area, deletion of any additional information inserted in echocardiographic images, and intensity and color adjustment for DICOM files.
Initially, for an approximate estimation of the position, size, and orientation in space of the relevant structure, every CNN subdetector was regressively fed with a subsample of images having a fixed resolution of less than 20% the number of pixels in the original image. In a second stage, every detector received the area and structure of interest from each image in order to reduce any changes in terms of scale and position. Image resolution for this second stage was standardized to average resolution (mm/pixel) for all images to make up for any potential change in resolution of individual images. In this case, relevant structures were identified using regressive CNN, as in the first stage of the process. Finally, for the third stage, we used a more refined set of images with improved localization of relevant structures (as compared to the previous stage). As before, regressive CNN made this possible.
Training in every subdetection stage was performed using a subset of measurements such as the ground truth. During training, every detector could analyze information input based on these measurements assumed as the ground truth, together with 32 augmented versions of such input. The increase was possible thanks to mild rotations and scale variations in the area of interest, leading to effective identification of a large number of variants and structures.
Protocol 1: automated image identification and stacking
The CNN was trained to identify 18 standard echocardiographic views: 6 corresponding to two-dimensional echocardiography (2D), and 12 corresponding to tissue Doppler imaging (TDI), pulsed wave Doppler (PW), and continuous wave Doppler (CW). 2D images included apical views in 2, 3 and 4 chambers (A2C, A3C and A4C, respectively), as well as long and short axis parasternal views (PLAX and PSAX, respectively), and subcostal view (SC). TDI included septal and lateral sampling from the mitral annulus and lateral portion of the tricuspid annulus. PW images were collected across the left ventricular outflow tract (LVOT) on apical view, the mitral inflow tract on four-chamber view, and the right ventricular outflow tract (RVOT) on PSAX view. CW showed aortic flow evaluation on apical view, as well as mitral regurgitation flow on four-chamber apical view, tricuspid regurgitation flow on four-chamber apical view and PSAX, and pulmonary flow on PSAX view. All these images were used as CNN input to create our library with different types of images and echocardiographic views.
Then, the CNN was trained to identify views and types of images in an independent set of test images for subsequent allocation or classification of each of these images in 8 stacks based on the following parameters or structures: left ventricular (LV) systolic function and size, LV diastolic function, right ventricular (RV) and right atrial (RA) function and size, valves (mitral, aortic, tricuspid and pulmonary), and pericardium. Table 1 shows a list of the images required to complete each stack. Finally, the results of automatic image identification and classification were compared to the “ground truth” predetermined by the expert reader.
Protocol 2: automatic analysis accuracy and reproducibility
After every image was automatically classified according to type and view, and after selecting the cardiac cycle phase for measurements, a ML monitored algorithm was trained to measure 16 standard parameters regularly quantified in clinical practice. These parameters included interventricular septum diastolic thickness, diastolic and systolic LV internal diameter, LV posterior wall diastolic thickness, LVOT midsystolic diameter, LVOT velocity time integral (VTI), left atrial (LA) maximum volume on A2C and A4C, LV end-diastolic and end-systolic volumes , mitral valve inflow E wave and A wave , and mitral lateral and septal annulus tissue velocity. All chamber volumes were measured using the biplane Simpson method.
The accuracy of these automatic measurements was compared to that of manual measurements collected by an expert reader from the test group of 200 subjects. Also, in a subset of 30 randomly selected tests, differences between automatic ML measurements and those provided by a reference expert reader were compared to inter- and intraobserver human variability by repeated blinded measurements. To assess interobserver variability, measurements were independently performed by two echocardiography expert cardiologists using conventional interpretation and measurement methods. Finally, to determine intraobserver variability, one of these experts, again fully blinded to previous measurements, re-read the same echocardiographic tests at least two weeks after the first analysis.
Protocol 3: efficiency and reproducibility of the ML assisted approach
In this protocol, both experts independently repeated interpretation of the 30 tests at least 2 weeks later, this time, using ML assistance. In this case, experts could use any stacks and measurements that were automatically established by algorithms, making any necessary adjustments to improve accurate identification and measurement of relevant structures or events. For both sessions, the time required to complete analysis of the echocardiographic test depended on the workstation being used, and intra and interobserver variability was evaluated for all previously described parameters. Finally, times of analysis with and without ML assistance were compared.
Statistical analysis
The accuracy of the automated method for type of image identification and echocardiographic view, as well as comparison versus experts, was quantified as the percentage of correct classifications based on the total number of analyzed image sequences. For every parameter, consistency between ML measurements and reference values collected by experts was evaluated using linear regression methods, and bias and limits of agreement tests using the Bland-Altman method. In order to compare different parameters, biases were expressed as the percentage of the average value of each parameter (% bias). Intra and interobserver variability for every parameter was quantified using variation coefficients, defined as the absolute difference among repeated measurements expressed as mean percentages. The statistical significance of variations in the time of analysis with and without ML assistance was determined by the Student’s t test using two-tailed paired measurements. Pvalues < 0.05 were considered significant.
RESULTS
Protocol 1
The CNN performed automatic classification of echocardiographic views with an average of 0.87 seconds per test. The CNN was able to identify types of images and echocardiographic views with a 90% accuracy for 2D images and a 94% accuracy for Doppler images. Figure 1 shows data corresponding to agreement between ML and the expert’s reader “ground truth” classification for each echocardiographic view. While agreement was excellent in most cases, the largest number of errors occurred when classifying non-standard sub-optimal views, wrongly identified as A3C (and noted as “Other”). The CNN was able to separate and group images in stacks with a 91% accuracy. When counting the number of views required to complete every stack, ignoring those that were considered unnecessary, the final composition of each image stack showed a 99% agreement between ML and expert readers (Table 1).
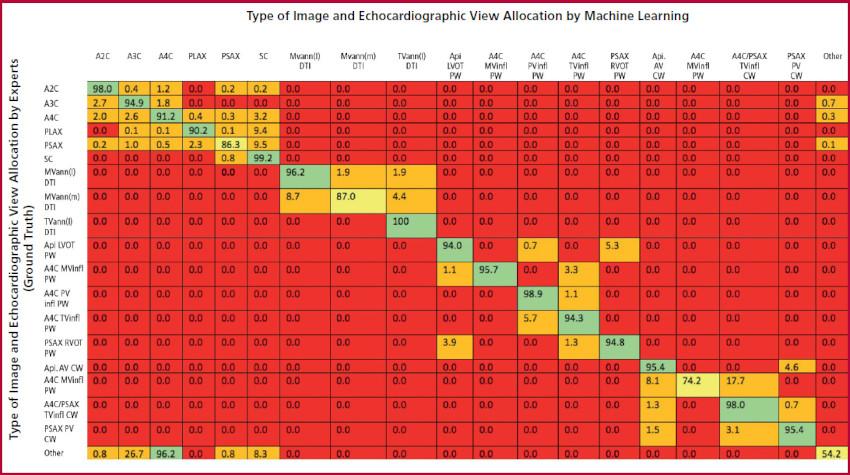
Fig 1. Identifying the type and view of echocardiographic images: agreement between automated ML measurements and manual expert measurements. Each cell represents the percentage of agreement for every type of image and view being evaluated. The cells have different colors depending on the percentage of agreement: red (0%), orange (0.1%-50%), yellow (50.1%-90%) and green (90.1%-100%). Abbreviations: A2C, A3C and A4C = 2, 3 and 4 chamber apical, respectively; PLAX, PSAX, SC = long axis parasternal, short axis parasternal, and subcostal, respectively; MVann (l), MVann (s), TVann (l) = lateral mitral annulus, septal mitral annulus, and lateral tricuspid annulus, respectively; Api LVOT = apical view of the left ventricular outflow tract; Api AV = apical view of the aortic valve; MVinfl, TV infl, PVinfl = mitral, tricuspid and pulmonary valves inflow tracts, respectively; CW = continuous wave Doppler; PW = pulsed wave Doppler
Table 1 Composition of echocardiographic imaging groups (stacks) according to the relevant topic or structure, and percentage of complete automatic machine learning classifications.
| Relevant Stack or Group | Echocardiographic Image Type and View | % Complete Stacks | ||
|---|---|---|---|---|
| 2D Views | Doppler | |||
| Left Ventricular Systolic Function and Dimensions |
|
99.5% | ||
| Left Ventricular Diastolic Function |
|
|
100% | |
| Right Ventricular and Atrial Function and Dimensions |
|
99% | ||
| Mitral Valve |
|
|
99.8% | |
| Aortic Valve | *Long axis parasternal *Short axis parasternal - aortic valve *Five chambers apical *Three chambers apical | *Five chambers apical aortic valve *Five chambers apical left ventricular outflow tract *Three chambers apical aortic valve *Three chambers apical left ventricular outflow tract | 96% | |
| Tricuspid Valve | *Right ventricular inflow tract *Short axis aortic valve *Four chambers apical *Four chambers apical - focus onright ventricle *Subcostal | *Right ventricular inflow tract tricuspid valve *Short axis parasternal tricuspid valve *Four chambers apical tricuspid valve | 99.4% | |
| Pulmonary Valve |
|
|
98.4% | |
| Pericardium |
|
100% | ||
Protocol 2
Automatic ML measurements showed excellent agreement versus reference values collected by experts, as shown by high correlation rates, small biases, and narrow limits of agreement for most parameters under analysis (Table 2). The largest relative biases occurred for left atrial volumes both in A4C and A2C (18% and 25% of reference values), followed by left ventricular volumes (6.5% and 7.8% of reference values). For the remaining parameters being assessed, relative biases were very small, with values lower than 3%. The analysis of the subset of 30 tests showed that differences between ML and expert measurements were similar to differences between manual measurements by two human technicians (Table 3).
Table 2 Evaluation of Machine Learning (ML) Algorithm
| Linear Regression | Bland Altman Test | ||||
|---|---|---|---|---|---|
| Pearson Coefficient r | Bias ± SD | % Bias | Lower Limit of Agreement | Upper Limit of Agreement | |
| IVSd Thickness (mm) | 0.65 | -0.11 ± 1.3 | -1.5 | -2.7 | 2.4 |
| PWd Thickness (mm) | 0.64 | -0.04 ± 1.1 | -0.5 | -2.2 | 2.1 |
| LVIDs (mm) | 0.78 | 0.85 ± 2.5 | 3 | -4.2 | 5.9 |
| LVIDd (mm) | 0.82 | 0.65 ± 3.1 | 1.5 | -5.6 | 6.9 |
| LVOT diam (mm) | 0.82 | 0.85 ± 1.5 | 4.1 | -2.1 | 3.8 |
| LVd Vol A2C) (ml) | 0.91 | 6.6 ± 12.5 | 6.5 | -18.4 | 31.6 |
| LVd Vol (A4C) (ml) | 0.94 | 7.4 ± 9.5 | 7.8 | -11.5 | 26.3 |
| LVs Vol (A2C) (ml) | 0.87 | -0.5 ± 6.2 | -1.3 | -12.9 | 11.9 |
| LVs Vol (A4C) (ml) | 0.89 | 0.6 ± 5.6 | 1.6 | -10.7 | 11.8 |
| LA Vol (A2C) (ml) | 0.87 | 11. 8 ± 10.3 | 25 | -8.9 | 32.5 |
| LA Vol (A4C) (ml) | 0.89 | 8.6 ± 8.5 | 18 | -8.4 | 25.6 |
| LVOT VTI (cm) | 0.91 | 0.46 ± 1.7 | 2.2 | -2.8 | 3.8 |
| E Vel (cm/s) | 0.96 | -0.01 ± 0.05 | -1.1 | -0.11 | 0.09 |
| A Vel (cm/s) | 0.95 | -0.01 ± 0.05 | -1.1 | -0.11 | 0.1 |
| E' vel (l) (cm/s) | 0.96 | -0.03 ± 1.3 | -0.2 | -2.62 | 2.56 |
| E' vel (s) (cm/s) | 0.96 | -0.03 ± 1.21 | -0.3 | -2.45 | 2.39 |
Agreement between measurements and reference values obtained automatically using ML and manually collected by experts in 200 tests. Pearson linear regression coefficient (r) and Bland-Altman bias and limits of agreement test have been included. Positive bias represents ML overestimation, while negative bias represents underestimation.
Abbreviations: SD = standard deviation; IVSd = interventricular septum diastolic; PWd = posterior wall diastolic; LVIDs = left ventricular internal diameter systolic; LVID = left ventricular internal diameter diastolic; LVOT diam = midsystolic left ventricular outflow tract diameter; LVd Vol A2C and A4C = left ventricular diastolic volumes on 2 and 4 chambers apical view, respectively; LVs Vol A2C and A4C = left ventricular systolic volumes on 2 and 4 chambers apical view, respectively; LA Vol A2C and A4C = left atrium maximum volume on 2 and 4 chambers apical view, respectively; LVOT VTI = left ventricular outflow tract velocity time integral; E Vel and A Vel = mitral inflow early (E) wave velocity and late (A )wave velocity; E’ vel (l) and E’ vel (s) = mitral lateral and septal annulus tissue velocity, respectively.
Table 3 Comparison between automatic ML reference values and measurements by an expert reader using conventional measurement methods, including intra and interobserver variability for each of these methods
| Conventional Manual Interpretation | Automatic MLOnly Interpretation Vs Manual Interpretation | ML Interpretation + Corrections Vs Manual Interpretation | ||
|---|---|---|---|---|
| Intraobserver Variability | Interobserver Variability | |||
| IVSd thickness (mm) | 7 ± 5 | 11 ± 8 | 14 ± 10 | 0 ± 1 * |
| PWd thickness (mm) | 8 ± 7 | 15 ± 13 | 17 ± 15 | 1 ± 3 * |
| LVIDs (mm) | 3 ± 2 | 8 ± 6 | 10 ± 10 | 3 ± 5 * |
| LVIDd (mm) | 2 ± 2 | 4 ± 4 | 6 ± 5 | 0 ± 1 * |
| LVOT diam (mm) | 2 ± 3 | 4 ± 3 | 5 ± 4 | 6 ±14 |
| LVd Vol (A2C) (ml) | 10 ± 9 | 20 ± 13 | 14 ± 10 | 6 ± 8 * |
| LVd Vol (A4C) (ml) | 7 ± 5 | 22 ± 7 | 16 ± 8 | 4 ± 5 * |
| LVs Vol (A2C) (ml) | 11 ± 9 | 23 ± 14 | 27 ±19 | 3 ± 4 * |
| LVs Vol (A4C) (ml) | 9 ± 7 | 32 ± 13 | 35 ± 16 | 4 ± 5 * |
| LA Vol (A2C) (ml) | 14 ± 9 | 17 ± 22 | 14 ± 10 | 9 ± 9 |
| LA Vol (A4C) (ml) | 13 ± 13 | 18 ± 13 | 16 ± 8 | 9 ± 8 * |
| LVOT VTI (cm) | 5 ± 4 | 7 ± 5 | 8 ± 7 | 1 ± 4 * |
| E Vel (cm/s) | 4 ± 4 | 8 ± 7 | 6 ± 5 | 3 ± 16 |
| A Vel (cm/s) | 3 ± 3 | 14 ± 11 | 14 ± 11 | 3 ± 16 * |
| E' vel (l) (cm/s) | 7 ± 9 | 10 ± 20 | 11 ± 17 | 2 ± 8 |
| E' vel (s) (cm/s) | 4 ± 4 | 6 ± 8 | 8 ± 7 | 0 ± 0 * |
Values represent variation coefficients (see text for more details). For abbreviations, see Table 2.
*p < 0.05 for automated ML interpretation.
Protocol 3
Conventional interpretation of a complete echocardiographic study required an average of 11 minutes and 33 seconds (9:29 for reader #1 and 13:36 for reader #2). On the other hand, when using ML assistance through stacking and automated measurements, the average time needed to complete evaluation of a test was 6 minutes and 48 seconds (4:50 for reader #1 and 8:45 for reader #2). This means that using ML may reduce an average 40% the time required to interpret an echocardiographic test using current conventional methods (49% for reader #1 and 36% for reader #2). Please note that, as compared to the manual method, ML reduced inter-observer variability in 15 of 16 measurements (Table 3), except for LVOT diameter, which had a highly reproducible measurement using both methods.
DISCUSSION
In the last decade, the use of artificial intelligence for medical imaging has increased remarkably thanks to the possibility of assistance throughout various stages of the interpretative and diagnostic process. 15), (16 While the purpose of artificial intelligence has been primarily evaluated using static radiology images, application of techniques such as ML to echocardiography has relatively fallen behind. This could be at least partly explained by the technical challenges posed by echocardiography, such as lower spatial resolution or quality of image versus other techniques like computed tomography or nuclear magnetic resonance, and also by the dynamic aspect of echocardiographic images (use of videos), which requires large amounts of data and information in an extremely short time. However, recent studies have overcome many of these obstacles using new ML techniques especially designed to identify echocardiographic types and views, 9), (10), (11 or for automated measurement of regular echocardiographic parameters in clinical practice. 10), (17), (18 For example, using artificial intelligence as a guide to collect echocardiographic images has allowed users with little ultrasound training to collect images of a quality similar to those obtained by an expert technician. 19 We believe that our study is the first to combine these new ML techniques for imaging identification and classification based on common predetermined features. It is also the first study to show the potential impact of this new tool in terms of reducing the time required to complete an echo analysis, with subsequent improved efficiency for the echo lab workflow.
It is true that cardiologists in general and echocardiography specialists in particular are used to identifying, classifying, and analyzing large numbers of images, with no need for a previous grouping or stacking process. Nevertheless, the growing number of tests and the need to strictly adhere to the recommendations in echocardiographic quantification guidelines have evidenced a new scenario, where inclusion of automated mechanisms for these repetitive tasks is becoming increasingly necessary. ML-based technology is especially suitable to solve this kind of problems thanks to its exclusive ability to identify and classify images, (9-11) and even to identify specific components or structures within these images requiring segmentation and/or measurement. 10 In this study, we proposed that combining all these ML capabilities may contribute to facilitate diagnostic interpretation throughout several stages of the process, ranging from classification to measurements.
The initial hypothesis behind this study was that applying a variety of ML techniques might involve a disruptive change in the way echocardiographic tests are currently read and interpreted. Ultimately, our purpose is to optimize the complex and extensive interpretation process of echocardiographic tests through the increased efficiency, accuracy, and reproducibility of readings that ML may provide.
As in previous publications, (9-11) using CNN in our study allowed a computer to identify rapidly and accurately most potential types and views of an echocardiographic image. According to this classification, images were sorted and presented to expert readers in thematic stacks, a useful and practical approach when answering a certain clinical question. Therefore, this tool practically removed the need to identify, classify, and visually group various anatomical structures, while (at least virtually) doing without human measurements of regular echocardiographic parameters. In fact, our results have shown that differences between measurements obtained automatically with no manual adjustments and those collected by an expert were no larger than differences observed between two readers with the same experience and training. Therefore, ML assistance to interpret echocardiographic images helped reduce to less than 10% the variability in measurements for most parameters being evaluated, which is ideal for a qualitative assessment of the cardiovascular function. In addition, ML algorithms combination of identification, stacking, and automatic measurement abilities (with manual correction if necessary) allowed readers, on the one hand, to significantly reduce their usual time of analysis, and on the other hand, to reduce interobserver variability when quantifying most evaluated parameters.
A major advantage of the software being developed and evaluated in this study is its theoretical independence from the manufacturer (vendor) of echocardiographic systems, as it was designed to interpret images in DICOM format coming from any of these systems, allowing them to be used by any laboratory or department, regardless of the echocardiographic method being used.
One limitation of our study is that it only included healthy subjects who were previously tested in the WASE study. However, other ML software has been validated by several authors and in patients with a wide range of cardiovascular conditions. 9), (10), (11), (20), (21 Thus, revalidating said software was not among the objectives of our study, which was exclusively focused on evaluating an alternative path for the interpretation of echocardiographic images. It is therefore unlikely that including patients with a condition might affect our findings.
To conclude, ML techniques may significantly improve the efficiency and reproducibility of echocardiographic imaging interpretation by using thematic stacks based on common structures and through automated measurements that can be corrected. Applying this type of technology will save time and money, mostly by improved process efficiency, higher medical staff satisfaction, and increased diagnostic performance.
Acknowledgments
This work was funded by the American Society of Echocardiography (ASE) Foundation, MedStar Health Research Institute, and University of Chicago, with the unconditional support of TOMTEC. We would like to thank Ms. Rhonda Price, an ASE member, for her logistic support throughout the study. Finally, we kindly thank all the investigators of the WASE study for allowing us to use the images from said study.
REFERENCES
1. Fast J, Jacobs S. Limits of reproducibility of cross-sectional echocardiographic measurements of left ventricular muscle mass. Int J Cardiol. 1991;31:213-6. https://doi.org/10.1016/0167-5273(91)90218-e [ Links ]
2. Otterstad JE, Froeland G, St John Sutton M, Holme I. Accuracy and reproducibility of biplane two-dimensional echocardiographic measurements of left ventricular dimensions and function. Eur Heart J. 1997;18:507-13. https://doi.org/10.1093/oxfordjournals.eurheartj.a015273 [ Links ]
3. Jhang JS, Diamond JA, Phillips RA. Interobserver Variability of Left Ventricular Measurements in a Population of Predominantly Obese Hypertensives Using Simultaneously Acquired and Displayed M-Mode and 2-D Cine Echocardiography. Echocardiography. 1997;14:9-14. https://doi.org/10.1111/j.1540-8175.1997.tb00684.x [ Links ]
4. Thomson HL, Basmadjian AJ, Rainbird AJ, Razavi M, Avierinos JF, Pellikka PA, et al. Contrast echocardiography improves the accuracy and reproducibility of left ventricular remodeling measurements: a prospective, randomly assigned, blinded study. J Am Coll Cardiol. 2001;38:867-75. https://doi.org/10.1016/s0735-1097(01)01416-4 [ Links ]
5. Baker G, Flack E, Hlavacek A, Chessa K, Fleming D, Scheurer M, et al. Variability and resource utilization of bedside three-dimensional echocardiographic quantitative measurements of left ventricular volume in congenital heart disease. Congenit Heart Dis. 2006;1:309- 14. https://doi.org/10.1111/j.1747-0803.2006.00053.x [ Links ]
6. Moura LM, Ramos SF, Pinto FJ, Barros IM, Rocha-Gonçalves F. Analysis of variability and reproducibility of echocardiography measurements in valvular aortic valve stenosis. Rev Port Cardiol. 2011;30:25-33. [ Links ]
7. Colan SD, Shirali G, Margossian R, Gallagher D, Altmann K, Canter C, et al; Pediatric Heart Network Investigators. The ventricular volume variability study of the Pediatric Heart Network: study design and impact of beat averaging and variable type on the reproducibility of echocardiographic measurements in children with chronic dilated cardiomyopathy. J Am Soc Echocardiogr. 2012;25:842-54. https://doi.org/10.1016/j.echo.2012.05.004 [ Links ]
8. Lee CK, Margossian R, Sleeper LA, Canter CE, Chen S, Tani LY, et al; Pediatric Heart Network Investigators. Variability of M-mode versus two-dimensional echocardiography measurements in children with dilated cardiomyopathy. Pediatr Cardiol. 2014;35:658-67. https://doi.org/10.1007/s00246-013-0835-9 [ Links ]
9. Madani A, Arnaout R, Mofrad M, Arnaout R. Fast and accurate view classification of echocardiograms using deep learning. NPJ Digit Med. 2018;1:6. https://doi.org/10.1038/s41746-017-0013-1 [ Links ]
10. Zhang J, Gajjala S, Agrawal P, Tison GH, Hallock LA, Beussink- Nelson L, et al. Fully Automated Echocardiogram Interpretation in Clinical Practice. Circulation. 2018;138:1623-35. https://doi.org/10.1161/CIRCULATIONAHA.118.034338 [ Links ]
11. Howard JP, Tan J, Shun-Shin MJ, Mahdi D, Nowbar AN, Arnold AD, et al. Improving ultrasound video classification: an evaluation of novel deep learning methods in echocardiography. J Med Artif Intell. 2020;3:4. https://doi.org/10.21037/jmai.2019.10.03 [ Links ]
12. Asch FM, Banchs J, Price R, Rigolin V, Thomas JD, Weissman NJ, et al. Need for a Global Definition of Normative Echo Values- Rationale and Design of the World Alliance of Societies of Echocardiography Normal Values Study (WASE). J Am Soc Echocardiogr. 2019;32:157-62. https://doi.org/10.1016/j.echo.2018.10.006 [ Links ]
13. Mitchell C, Rahko PS, Blauwet LA, Canaday B, Finstuen JA, Foster MC, et al. Guidelines for Performing a Comprehensive Transthoracic Echocardiographic Examination in Adults: Recommendations from the American Society of Echocardiography. J Am Soc Echocardiogr. 2019;32:1-64. https://doi.org/10.1016/j.echo.2018.06.004 [ Links ]
14. Lang RM, Badano LP, Mor-Avi V, Afilalo J, Armstrong A, Ernande L, et al. Recommendations for cardiac chamber quantification by echocardiography in adults: an update from the American Society of Echocardiography and the European Association of Cardiovascular Imaging. J Am Soc Echocardiogr. 2015;28:1-39 https://doi.org/10.1016/j.echo.2014.10.003 [ Links ]
15. Nabi W, Bansal A, Xu B. Applications of artificial intelligence and machine learning approaches in echocardiography. Echocardiography. 2021;38:982-92. https://doi.org/10.1111/echo.15048 [ Links ]
16. Gandhi S, Mosleh W, Shen J, Chow CM. Automation, machine learning, and artificial intelligence in echocardiography: A brave new world. Echocardiography. 2018;35:1402-18. https://doi.org/10.1111/echo.14086 [ Links ]
17. Tromp J, Bauer D, Claggett BL, Frost M, Iversen MB, Prasad N, et al. A formal validation of a deep learning-based automated workflow for the interpretation of the echocardiogram. Nat Commun. 2022;13:6776. https://doi.org/10.1038/s41467-022-34245-1 [ Links ]
18. Tromp J, Seekings PJ, Hung CL, Iversen MB, Frost MJ, Ouwerkerk W, et al. Automated interpretation of systolic and diastolic function on the echocardiogram: a multicohort study. Lancet Digit Health. 2022;4:46-54. https://doi.org/10.1016/S2589-7500(21)00235-1 [ Links ]
19. Mor-Avi V, Khandheria B, Klempfner R, Cotella JI, Moreno M, Ignatowski D, et al. Real-Time Artificial Intelligence-Based Guidance of Echocardiographic Imaging by Novices: Image Quality and Suitability for Diagnostic Interpretation and Quantitative Analysis. Circ Cardiovasc Imaging. 2023;16:e015569. https://doi.org/10.1161/CIRCIMAGING.123.015569 [ Links ]
20. Cotella JI, Slivnick JA, Sanderson E, Singulane C, O'Driscoll J, Asch FM, et al. Artificial intelligence based left ventricular ejection fraction and global longitudinal strain in cardiac amyloidosis. Echocardiography. 2023;40:188-95. https://doi.org/10.1111/echo.15516 [ Links ]
21. Gruca MM, Slivnick JA, Singh A, Cotella JI, Subashchandran V, Prabhu D, et al. Noninvasive assessment of left ventricular enddiastolic pressure using machine learning-derived phasic left atrial strain. Eur Heart J Cardiovasc Imaging. 2023;25:18-26. https://doi.org/10.1093/ehjci/jead231 [ Links ]
Appendix
PRINCIPAL INVESTIGATORS IN THE WASE STUDY
Ricardo Ronderos, MD, FASE, Instituto Cardiovascular de Buenos Aires, Buenos Aires, Argentina; Gregory Scalia, MD, FASE, GenesisCare, Brisbane, Australia; Ana Clara Tude Rodrigues, MD, Hospital Israelita Albert Einstein, Sao Paulo, Brazil; Wendy Tsang, MD, Toronto General Hospital, University of Toronto, Toronto, ON, Canada; Mei Zhang, PhD, Qilu Hospital of Shandong University, Jinan, China; V. Amuthan, MD, DM, Jeyalakshmi Heart Center, Madurai, India; Ravi Kasliwal, MD, FASE, Medanta Heart Institute, Medanta, India; Anita Sadeghpour, MD, FASE, Rajaie Cardiovascular Medical and Research Center, Tehran, Iran; Eduardo Bossone MD, FASE, University of Salerno, Salerno, Italy; Denisa Muraru, MD, University of Padua, Padua, Italy; Masao Daimon, MD, PhD, The University of Tokyo, Tokyo, Japan; Masaaki Takeuchi, MD, PhD, FASE, University of Occupational and Environmental Health, Kitakyushu, Japan; Pedro Gutierrez-Fajardo, MD, FASE, Hospital Bernardette, Guadalajara, Mexico; Kofo O. Ogunyankin, MD, FASE, First Cardiology Consultants Hospital Ikoyi, Lagos, Nigeria; Edwin S. Tucay, MD, FASE, Philippine Heart Center, Quezon City, Philippines; Seung Woo Park, MD, Samsung Medical Center, Seoul, Korea; Mark J. Monaghan, PhD, King’s College Hospital, United Kingdom; Karima Addetia, MD, University of Chicago, Chicago, IL; James Kirkpatrick, MD, FASE, University of Washington, Seattle, WA.
ADDITIONAL INVESTIGATORS IN THE WASE STUDY (in country alphabetical order)
Argentina : Aldo D. Prado, Centro Privado de Cardiología, Tucumán; Eduardo Filipini, Instituto Cardiovascular de Buenos Aires, Buenos Aires.
Australia : Agatha Kwon and Samantha Hoschke-Edwards, GenesisCare, Brisbane.
Brazil : Tania Regina Afonso, Hospital Israelita Albert Einstein, Sao Paulo.
Canada : Babitha Thampinathan and Maala Sooriyakanthan, Toronto General Hospital, University of Toronto, Toronto, Ontario.
China : Tiangang Zhu and ZhilongWang, Peking University People’s Hospital, Beijing; Yingbin Wang, Mei Zhang, and Yu Zhang, Qilu Hospital of Shandong University, Jinan; Lixue Yin and Shuang Li, Sichuan Provincial People’s Hospital, Sichuan.
India: R. Alagesan, Madras Medical College, Chennai; S. Balasubramanian, Madurai Medical College, Madurai; R.V.A. Ananth, Jeyalakshmi Heart Center, Madurai; Manish Bansal, Medanta Heart Institute, Medanta, Haryana.
Italy: Luigi P. Badano (currently at the University of Milano-Bicocca and Istituto Auxologico Italiano, IRCCS, Milano) and Chiara Palermo, University of Padua, Padua; Eduardo Bossone (currently at Antonio Cardarelli Hospital, Naples), Davide DiVece, and Michele Bellino, University of Salerno, Salerno.
Japan: Tomoko Nakao, Takayuki Kawata, Megumi Hirokawa, and Naoko Sawada, University of Tokyo, Tokyo; Yousuke Nabeshima, University of Occupational and Environmental Health, Kitakyushu.
Korea: Hye Rim Yun and Ji-won Hwang, Samsung Medical Center, Seoul.
Nigeria: Dolapo Fasawe, First Cardiology Consultants Hospital Ikoyi, Lagos.
Received: September 25, 2023; Accepted: November 29, 2023
 This is an open-access article distributed under the terms of the Creative Commons Attribution License
