


 Inglês (pdf)
 Artigo em XML
 Referências do artigo
 Enviar este artigo por email
 Citado por SciELO
  Similares em
SciELO
Similares em
SciELO 
 Permalink
Introduction
Sugar cane has a high capacity for biomass production because it efficiently converts energy into carbohydrates and stores sucrose in its stalk 26. Sugar cane is easy to produce, contributes food for both livestock and humans, and is an important industrial input 14,30. Mexico is the sixth largest producer of sugar cane worldwide, contributing about 3.5% of total sugar cane production, and about 48% of the sugar cane produced in Mexico is from the southeastern region of the country, with an average yield of 74 t ha-1 (33. Like any monoculture, sugar cane production is affected by phytosanitary problems that decrease yield, juice purity, and the industrial quality of the product. Control measures include using more tolerant varieties and thermally or chemically disinfecting seeds 15. Despite these measures, there has been a persistent increase in the incidence of diseases, especially mottled stripe disease.
Mottled stripe disease (also known as “chlorotic spotting”) causes the appearance of chlorotic spots over the surface of the leaf blade, which join together to form lines or streaks. Over time, the streaks change color to red-orange and eventually cover the entire leaf, reducing the plant’s photosynthetic capacity 34. The causal organism of mottled stripe disease is Herbaspirillum rubrisubalbicans (=Pseudomonas rubrisubalbicans), which was first isolated from diseased sugar cane leaves by Hale and Wilke (1972). Baldani et al. (1996) later confirmed that H. rubrisubalbicans is an endophytic diazotroph that colonizes the roots, stalks, and especially leaves of sugar cane plants (Saccharum spp. Hybrids), leading to chlorotic spotting.
Chlorotic spotting is currently found in 30 countries, mainly in Africa and the Americas 5,33. Given the diversity of varieties cultivated in different regions, some sugar cane genotypes are apparently more susceptible to the disease, which is mostly expressed in young plants 5. In Mexico, chlorotic spotting is considered a re-emerging disease; it was first reported in the country in 1996 in some sugar cane, maize, and sorghum plots 5. Initially, no crop damage was reported, but chlorotic spotting currently leads to considerable losses in southeastern Mexico 34.
More information on the location of the disease and the ability to predict its occurrence over time is necessary to prevent future infections. Geostatistics and geographical information systems have been used as tools in integrated disease management. These tools can help determine the spatial and temporal distribution of a pathogen or insect pest, estimate the percentage of infection or infestation, and make decisions on specific control measures to reduce costs 9,31. Maps of the spatial distribution and percentages of infection/infestation can also be used to guide control measures to reduce contaminating particles and economic losses 9,23.
Spatial modeling and digital mapping use computational algorithms and predictors that represent the variables to map 11,24. In addition to their use in the management of diseases from a site-specific perspective, these models have research applications in biology, the potential impacts of climate change, epidemiology, biogeography, and geographic regions that require study 25. In recent years, understanding the spatial distribution of diseases within the production area has been considered essential for efficient disease management. This contributes to the development of a sustainable production system by focusing on control options that decrease damage, reduce costs, and yield a high-quality product 12. In this study, we aimed to determine the spatial patterns of incidence of mottled stripe disease in sugar cane in southeastern Mexico.
Materials and methods
The study area included the commercial sugar cane production area between the coordinates 18°23’55” North and 95°46’47” West in the gulf region of southeastern Mexico. In the years 2016 and 2017, we sampled plants with symptoms of mottled stripe disease ten months after harvest (plant crop, first stubble crop or second stubble crop). For each sampling, we considered 80 points that were randomly generated by the program QGis. Each point was located in the study area using a Global Positioning System (model Garmin-GPSmap USA) and georeferenced in the field. At each point, the percent incidence of mottled stripe was determined over 10 linear m using the formula: % I = ΣPA/ΣPT · 100, where: % I is the percent incidence of disease symptoms, PA is the number of plants with symptoms of mottled stripe, and PT is the total number of plants sampled along 10 linear m from the georeferenced point. Chemical control measures were not applied in any of the plots sampled. Monthly minimum and maximum temperature and precipitation were obtained from the Mexican agencies 8 for the 2015-2016 and 2016-2017 growing seasons.
Leaves exhibiting typical chlorotic mottling symptoms were collected at each point to determine the causal agent using molecular testing at the Seed Pathology Laboratory at the College of Postgraduates, Montecillo Campus in Texcoco, Mexico State. The sampled leaves were disinfected externally with a 1% (v/v) sodium hypochlorite solution for 1 min, rinsed three times with sterile distilled water, then placed on absorbent paper to remove excess moisture. Leaf tissue sections measuring 0.5 × 0.5 mm were transferred to Petri dishes containing King’s B medium then incubated at 28°C for 48 h. Whitish-colored colonies developed, which were then cultured to obtain pure cultures. Bacterial isolates underwent molecular characterization using DNA extracted from the pure cultures of each isolate under the cetyltrimethylammonium bromide (2%) buffer (CTAB) protocol 13. The DNA was quantified by spectrophotometry in a Nanodrop 2000 (Thermo Scientific, USA) and considered to have adequate quality for PCR analyses when the A260/280 and A260/230 ratios were between 1.8 and 2.2.
The 16S rDNA was amplified via PCR using the universal primers 8F (5-AGAGTTT GATCCTGGCTCAG-3’) and 1492R (5´-GGTTACCTTGTTACGACTT-3’). The PCR reactions were carried out in a total volume of 15 μL containing 100 ng DNA, 0.8 mM of dNTP, 0.3 U of Go Taq DNA polymerase (Invitrogen Carlsbad, CA, USA), 5x Go Taq reaction buffer (Promega, Fitchburg, WI, USA), and 10 pmol of each primer. The PCR parameters were as follows: single preheating step at 95°C for 2 min; 35 cycles of 95°C for 2 min, 59°C for 1 min, and 72°C for 1.5 min; and a final extension at 72°C for 5 min 26. All PCR reactions were done in a DNA Engine thermal cycler (BioRad, CA, USA), and the PCR products were verified by loading 5 μL into a 1.5% agarose gel in 1x Tris Acetate-EDTA buffer electrophoresed at 111 Volts for 1 h. The amplicons were visualized using an Infinity-3026 WL/LC/ 26MX transilluminator (Vilber Lourmat, Germany). The remaining volume of PCR product was cleaned with the Exosap-IT enzyme protocol (Affymetrix, USA) following the manufacturer’s instructions. To ensure that there were no misreadings, the PCR products were sequenced in both directions with primers 514F (5’- GTGCCAGCMGCCGCGG-3’) and 800R (CTACCAGGGTATCTAAT-3) in a genetic analyzer (Applied Biosystems, CA, USA), using a Big Dye Terminator V.3.1 Cycle Sequencing kit standard (Applied Biosystem, CA, USA).
The sequences corresponding to both strands of the 16S rDNA were assembled and edited using BioEdit v7.0.5 19, generating a consensus sequence of each isolate. Since the basic local alignment search tool from NCBI finds regions of local similarity between sequences with significant alignments, the consensus sequences of each isolate were submitted to BLASTN 2.10.0 3. Sequences obtained in this study were deposited in the GenBank database.
The geostatistical analysis of the incidence data consisted of estimating a semivariogram and the parameters of the model as well as generating maps using Kriging interpolation. The incidence data were transformed prior to analysis using the inverse-logarithm to homogenize variance. The experimental semivariogram value was calculated based on the equations established by Goovaerts (1999) and Isaaks and Srivastava (1989):

where
y*(h) = the experimental value of the semivariogram for the distance interval h;
N(h) = the number of pairs of samples separated by distance interval h;
z(xᵢ) = the value of the variable of interest at the sampling point xᵢ;
z(xᵢ+h) = the value of interest at the sampling point xᵢ+h.
The experimental semivariogram was fit to a predetermined theoretical semivariogram. The degree of spatial dependence was calculated to determine the relationships among the data. The experimental semivariogram and the values from the theoretical model were obtained using the program R 7,29, using the gstat library 24.
Seven theoretical models (spherical, exponential, gaussian, linear, matern, bessel, and pentaspherical) were tested to select the one that best fit the experimental semivariogram of disease incidence. The best model was the one with the lowest error 9,10 based on the following formula
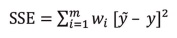
where
m = the lag number (points separated by a given distance);
ỹ = the semivariance values for each distance; y is the semivariance values from the prediction model;
wi = the semivariance factors obtained from the equation: wi=N/ ỹ 2
where
N = the number of pairs of points used to calculate ỹ for each distance 9,10.
Kriging 27 was then done using the model with the lowest error. Three types of kriging were evaluated (simple, ordinary, and universal) using the cross-validation technique. For interpolation, the kriging with the lowest precision error was selected based on the lowest mean error 11; root mean square error 1,23,35 and mean standardized prediction error 11, which should all have values close to zero. The result of kriging was a spatial layer in Geotiff format generated using the rgdal package for R. Finally, the map was edited using the program Surfer 15 (Surface Mapping System, Golden Software Inc. 809, 14th Street Golden, CO, 804011866, USA) to visualize the spatial pattern of H. rubrisubalbicans.
Results
The average incidence of chlorotic mottling symptoms was 2.93% in the 2016 season and 5.36% in 2017 (Table 1, page 130).
Table 1: Incidence of mottled stripe (Herbaspirillum rubrisubalbicans) in different varieties of sugar cane in commercial plots in southeastern Mexico in the 2016 and 2017 seasons. Tabla 1: Incidencia del moteado clorótico (Herbaspirillum rubrisubalbicans) en diferentes variedades de caña de azúcar de parcelas comeciales del sureste de México durante los ciclos 2016 y 2017.

Molecular characterization 5,34 confirmed that the bacterium Herbaspirillum rubrisubalbicans was present in all the samples tested.
The mean maximum temperature was 30°C, the mean annual temperature was 23.5°C, and mean annual precipitation was 127.8 mm in 2016, while in 2017 the mean annual precipitation was 144.3 mm and the mean annual temperature was 23.2°C (Figure 1) 8.

Figure 1: Precipitation (right axis) and minimum and maximum monthly temperatures (left axis) from November 2015 through October 2016 (2016 season; a) and from November 2016 through October 2017 (2017 season; b), in southeastern Mexico. Figura 1: Precipitación y temperaturas máximas y mínimas mensuales durante el ciclo de noviembre de 2015 a octubre de 2016 (a) y de noviembre de 2016 a octubre 2017 (b) en el sureste de México.
Higher precipitation and temperature were associated with a higher percent incidence of mottled stripe in 2017.
The overall incidence of mottled stripe increased by 2.7% from 2016 to 2017. The ICP-MEX-92-1420 variety had the highest percent incidence, followed by COLMEX-95-27 and CP-72-2086, which had the largest affected area. The CP-72-2086 variety was the most preferred by producers and had the largest cultivation area in the region. In 2017, the mottled stripe incidence in this genotype doubled. The COLMEX-9527 variety had the second highest incidence in 2016, and in the MEX 69-290 variety, the incidence quadrupled from 2016 to 2017 (Table 1, page 130).
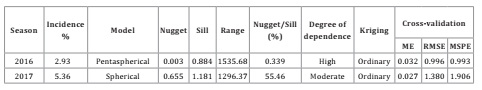
The geostatistical analysis showed that the disease had an aggregate distribution in both years of the study. The pentaspherical model was the model that best fit the data on disease incidence in 2016 (Figure 1a, page 130), while in 2017 (Figure 1b, page 130) the incidence data were better described by the spherical model. This shows a pattern of behavior with strongly defined points in both years. In 2016, the disease was expressed in more of the varieties but at a lower percent incidence. In 2017, fewer of the varieties were affected by the bacteria, but there was an increase in the percent incidence; in other words, the disease was apparently more aggressive.
In the semivariogram for 2016, there was spatial autocorrelation of the presence of mottled stripe in the sugar cane crop at distances up to 1535.68 m (range), beyond which the correlation among points decreased. This suggests that future sampling should consider this distance between points for regional-level studies. In addition, there was high degree of spatial dependence. In 2017, the range of correlation was 1296.37 m, with moderate spatial structure or degree of spatial dependence (Table 2).
Table 2: Incidence and parameters from the fitted semivariogram models based on sampling of mottled stripe disease in sugar cane (Herbaspirillum rubrisubalbicans) in commercial plots in southeastern Mexico during the 2016 and 2017 growing seasons. Tabla 2: Incidencia y parámetros de los semivariogramas ajustados a modelos del moteado clorótico de la caña de azúcar (Herbaspirillum rubrisubalbicans) en plantaciones comerciales del sureste de México, durante los ciclos 2016 y 2017.
The maps of the presence of the disease in southeastern Mexico and its pattern of behavior (Figure 2, page 132) indicate that in 2016 the bacterium was distributed in practically the entire region, except for the northeast, while in 2017 the disease was less dispersed, with a more focused presence in the southeast and northeast of the map of the study region.

Figure 2: Spatial distribution maps of incidence of symptoms of mottled stripe caused by Herbaspirillum rubrisubalbicans in southeastern Mexico in 2016 (a) and 2017 (b). Figura 2: Mapas de la distribución espacial de la incidencia del moteado clorótico causada por Herbaspirillum rubrisubalbicans en el sureste de México durante 2016 (a) y 2017 (b).
In 2016, the bacterium was found from the central zone through the southern part of the sugar cane region, while in 2017 it was distributed in the northeastern region of the study area.
Discussion
The bacterium H. rubrisubalbicans was present throughout the study region and during both years of the study (2016-2017), indicating that this pathogen can persist from one growing season to the next and spread from one plot to another by different mechanisms 2. It was also apparently well adapted to the climatic conditions in this sugar cane producing region, as well as the ICP-MEX-92-1420, CP-72-2086, ITV-92-373, MEX-79-434, and MEX-69-290 genotypes, which had the highest incidence of mottled stripe during both years of the study. The average temperature was similar between the two years of the study, but there was higher average annual precipitation in 2017, which was associated with a higher percent incidence of the bacterium H. rubrisubalbicans. In other words, when precipitation increased there was increased spread of the bacteria.
The spatial patterns expressed by diseases of bacterial origin can be influenced by a variety of factors, including climate, soil characteristics, and progression of the epidemic throughout the zone 22, as well as sampling protocols 6. Patterns of bacterial infection may also be influenced by host susceptibility 17. This is consistent with findings of different spatial patterns among different varieties of sugar cane that have different levels of susceptibility by Belan et al. (2018) and in the 2017 season in this study. The differences in spatial patterns between the 2016 and 2017 seasons show the dispersion potential of the disease in this crop system, as well as a latent infestation in the area, which means that the disease may be expressed whenever more susceptible genotypes are planted 6. In addition, the increase in incidence could have been due to means of dispersal such as the sowing or propagation of infected stalks, working with contaminated equipment or tools, or growing more susceptible cultivars or genotypes that are less tolerant to the pathogen.
Though we lack concrete data on the economic losses cause by the bacterium, it is evident that the leaf lesions affect the photosynthetic capacity and development of the plant. 5 indicate that the strain NCPPB 1027 (= LMG 2286) of H. rubrisubalbicans is considered a mild plant pathogen, which is found in sugar cane crops and only affects susceptible cultivars. However, our results show that the incidence, and thus potential damage to production, increases substantially from one cycle to the next, reducing the quality of sugar cane production in this region.
The semivariograms and maps show aggregate behavior of this disease, expressed as different spatial patterns given by the spatial dependence among points and the severity of the effects in each plot. In this sense, Contreras-Rendón et al. (2014) report spatially aggregated behavior of the bacterium Candidatus Liberibacter solanacearum, as has also been reported for Xanthomonas arboricola pv. corylina 22 in hazelnuts and Xanthomonas campestris pv. musasearum 32 in banana.
The differences in the spatial patterns found in the distribution of H. rubrisubalbicans, both in physical space in the region and between the two years of the study are similar to those reported by Contreras-Rendón et al. (2014) for Candidatus Liberibacter solanacearum in potato crops. The spatial distribution fit the pentaspherical model in 2016, which indicates that the aggregations are found in specific points but at low incidences in eight genotypes. On the other hand, the spatial distribution in 2017 was best fit by the spherical model, indicating the existence of focalized aggregations 4 with a higher percent incidence. Our maps based on the spatial distribution of mottled stripe over a continuous space help detect the areas that are most severely affected and require immediate control measures 29. These maps can also be useful to associate particular environmental characteristics with patterns of disease distribution, which can point to possible preferences in the aggregation structure of the bacteria in the study region 21. Here, changes in the spatial distribution of the disease from one year to the next and the greater number of new outbreaks of the bacteria in 2017 are likely due to the presence of susceptible genotypes and a favorable environment.
Conclusion
The chlorotic mottling of sugar cane showed an aggregate type spatial behavior at the regional level. There was some difference in spatial patterns between years, which corresponded with an increase in precipitation and more susceptible sugar cane genotypes. However, the patterns in both years showed consistently focalized points.

