


 Articulo en XML
 Referencias del artículo
 Enviar articulo por email
 Citado por SciELO
  Similares en
SciELO
Similares en
SciELO 
 Permalink
INTRODUCTION
The Pampas region of Argentina concentrates the largest production of bovine milk (96.4%), with the highest number of establishments (91.8%), according to the Observatorio de la Cadena Láctea Argentina - OCLA (2023). If we analyse this activity from a macroeconomic perspective, the sector is well positioned as an export complex, below the soybean, corn, petroleum-petrochemical, automotive, wheat, beef and cattle hides, gold and silver, sunflower, fishing, and barley, representing 1.6% of total exports in millions of dollars (USD 1,436) and which in 2022 presented a variation of 23.4% compared to 2021 (Instituto Nacional de Estadísticas y Censos - INDEC, 2023). The main exportable products are whole milk powder with different variations (granules, with and without sugar, different fat content, etc.), mozzarella, semi-hard cheese, whey, and butter, with the main destinations being Brazil, Algeria, Chile, Russia, Peru, and China (INDEC, 2023), in order of importance. These figures show the importance of bovine milk production in Argentina as a promoter of genuine employment, especially in the interior of the country, regional economies, and as an undeniable component of national economic development.
This raises questions for the sector on how to overcome the current stability in the volume of national milk production, at around 10-11 billion litres per year. This is presented in terms of decreasing herd size (Lazzarini et al., 2019) and number of farms, supported by the improvement of production efficiency indicators, as evidenced by Engler et al. (2020) and Gastaldi et al. (2020).
Despite efforts to increase the productivity of the systems, in many cases they present low levels of profitability (Baudracco et al., 2017; Engler et. al, 2022; Cuatrin et al., 2022) and their economic performance (EP) may not reflect good productive performance (PP), as reported byCenteno (2015) in dairy farms in the province of Córdoba during the 2011-2012 financial year; this situation being part of the context of the stability.
The main determinant of entrepreneurial EP, from a classical approach, is associated with profitability, widely studied in the theory of firms, although there may be other criteria or approaches to determine it (Samuelson and Nordhaus, 2006; Villegas, 2013).
Profitability is a variable that, together with others, contributes to the evaluation of the competitiveness of companies that aim to maximise profit by obtaining profits to sustain themselves over time (Baker et al., 2002).
In primary milk production companies, the EP can be analysed in an integral way together with the PP, environmental, organisational and/or innovative due to the complexity of the sector as Cabrera (2018) has done in support of producers for decision-making in their dairy farms. In this study, performance will be approached individually to determine the factors that affect them. Productivity, on the other hand, is the ratio between the system's output per unit of factor, such as capital or labour (Samuelson and Nordhaus, 2006). This indicator of productive efficiency is directly associated with the PP and is widely used to evaluate systems in the region (Engler et al., 2022; Centeno, 2015; CREA, 2023).
The aim of the paper is to evaluate variables that are directly associated with the EP and PP of dairy farms, such as profitability, production costs and production efficiency. This evaluation is based on a typology found in previous studies1 of the author, which is taken into account for the analysis. Finally, performance models are constructed and evaluated using flexible econometric models.
This work derives from the author's doctoral thesis and contributes with background information to determine the performance of dairy farms where the methodologies for the models are diverse as well as the criteria to define the concept of performance. Some researchers use stochastic models such as Atzori et al. (2013), who sought to find an integral indicator of profitability from farm-specific variables; or Alem (2020) who used the generalised method of moments to construct the dynamic stochastic production frontier to finally measure performance on Norwegian dairy farms. Angon et. al (2013) modelled a Cubb-Douglas function to evaluate technical efficiency and viability of dairy cow grazing systems in La Pampa.
This work could be continued by assessing how the performance of dairy farms affects their competitive development, at regional and international level, as a contribution to sectoral policies.
METHODOLOGY
Source of information
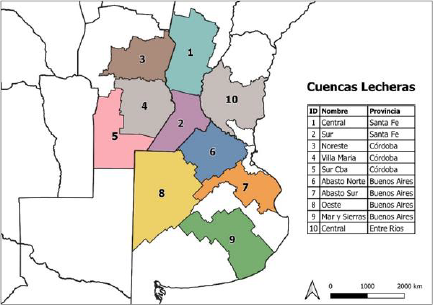
The sample under study belonged to 635 dairy farms, better known as “tambos”, within the main dairy basins of Argentina (Figure 1), taken from different editions of the Dairy Sector Survey (DSS) carried out by the Instituto Nacional de Tecnología Agropecuaria (INTA), since the 2000s, and in this specific case we worked with 4 editions 2012/2013, 2014/2015, 2016/2017 and 2020/2021.
The selection of dairy farms was representative of the national dairy based on productive strata. The survey involved a personal interview with producers or managers, where data related to structural aspects, organisation, management, technological level, and results obtained during each production year were collected (Gastaldi et al., 2020). The sample and the variables selected for this study converged in a panel database with subsequent statistical analysis.
Typology of dairy farms
In previous analyses, 3 types of dairy farms (clusters) were identified from a multivariate analysis that included Principal Component Analysis (PCA) and Cluster Analysis (CA). These studies are relevant to identify inwardly homogeneous and outwardly heterogeneous groups, according to Valerio Cabrera et al. (2004), with proven methodological experience to characterize and typify agricultural establishments according to multiple aspects as shown in several studies (Apez, García Arancibia and Engler, 2020; Cuatrin et al., 2022; Giorgis et al., 2011; Gregoretti et al., 2020). Based on the typology (Table 1), made from variables that provided information on different aspects of the dairy farms, the competitive performance of each type (cluster), its representation and characterisation was determined.
This contribution allows the interpretation of both the EP and the PP and how some factors impact them.
Table 1 Characteristics of the typology of dairy farms in the Pampean Region.
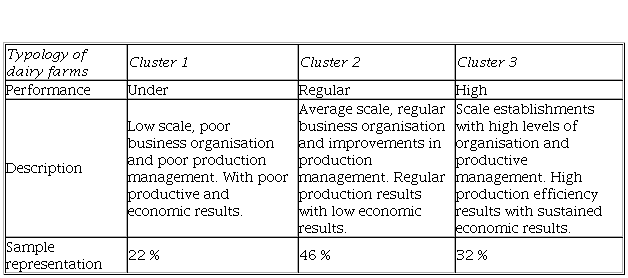
Note. Preliminary results of own elaboration (unpublished) from the panel database compiled from the 2012/2013, 2014/2015, 2016/2017 and 2020/2021 editions of the DSS.
Performance models
There are several extensions of microeconomic theory to model specifically the activity of dairy farms and other agricultural activities, either to study the supply and demand behaviours of inputs, as well as the determinants of productivity, costs, and profits (Prišenk et al., 2018). In this paper, flexible models were adopted to study the economic and productive performance of firms (dairy farms), where, assuming the technological, productive, and organisational heterogeneity of firms, we sought to understand performance based on the ability to generate a profitable activity in the long term (Michaličková et al., 2014). Based on the literature reviewed, the following assumptions were made assumptions for the models to be evaluated:
Profitability is the variable that best reflects the EP, understanding that EPi = Profitability (%).
Profitability is inversely related to production costs2: Profitability∝ (-Costs/Sale).
Productivity3 is the variable that best reflects the PP of the dairy farms, and in this case with respect to the land factor occupied for production, so that: PPi = Profitability (liters/haVT).
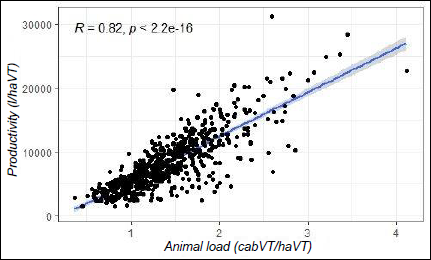
Productivity is highly related to animal load4: Profitability ∝ Animal load (cabVT/haVT).
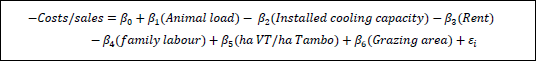
Given the relationship between profitability and costs, and how productivity influences profitability, it can be said that there are many cost drivers associated with productivity. Costs were estimated for each farm, including in direct expenses: feeding, feed supplies and pasture maintenance, labour, milking expenses, herd care, health, and artificial insemination, and breeding and rearing. Leasing was included in the structural costs. By evaluating some factors such as productivity (in this case the land factor), stocking rate, installed cooling capacity (days), rent, family labour, the ratio between total cow area (ha VT) and dairy area (ha Tambo), and grazing area (ha), a model could be obtained to estimate costs and evaluate their effects following:
Likewise, the PP and SD are feasible to obtain from the conformation of a multivariate linear regression model (LRM), where the factors would be determined by the principal components (PCi) of the dimensions that brought together the original variables, from the information they provide, and from which the typology was obtained, where:
The use of multiple linear regression is justified to fit linear or linearizable models between a dependent variable and more than one independent variable. In this type of model, it was important to test for heteroscedasticity, multicollinearity, and specification (Montero Granados, 2016). The use of PCi as factors or dependent variables helps to solve the problem of multicollinearity present in many variables of the production system under study.
RESULTS AND DISCUSSION
Behaviour of variables with respect to typology
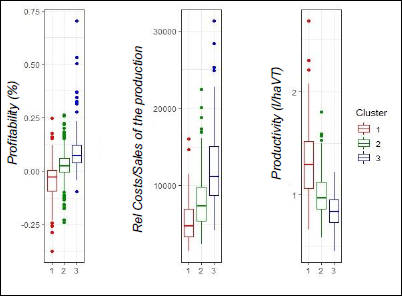
The behaviour of the variable’s profitability, production costs (ratio of costs to sales price per litre of milk), and land productivity were analysed. Figure 2 shows how the variables are distributed according to the 3 types of dairy farms found.
According to the typology of dairy farms, it was noticeable that those with lower profitability were less efficient in the use of the land factor (productivity) and at the same time those with higher production costs. The behaviour of each cluster was observed with respect to the variables profitability, land productivity and the cost/sales ratio of production (litre of milk), showing clear difficulties in the low performing dairy farms (cluster 1) to obtain profitability. The consequence of this result coincided with the lowest productivity values in the sample and high production costs, which were not covered by the prices received for milk sales. Cluster 2, a poor performer, showed clear signs of improvement in its results, both by increasing productivity and decreasing production costs. However, these results were not sufficient to generate profitability, which could later be translated into new investments in the activity, quality of life of the producers, etc. Cluster 3, with high performance, obtained the best results in terms of production efficiency, achieved with the lowest production costs, and generating profitability in the activity. Therefore, we can affirm that the higher the scale of the typology, the better the indicators of productive performance (higher productivity) and economic performance (higher profitability and lower production costs), following the law of returns to scale.
Relationship between variables
It is important, to contribute to the understanding of the performance of dairy farms, to assess how these variables of interest are related, also by assessing since typology. The following relationships were then analysed:
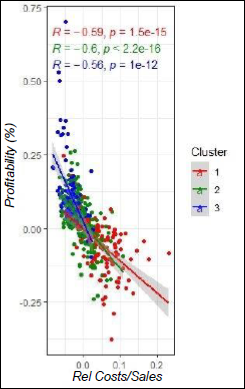
-Economic performance (profitability) ~ production costs (cost/sales ratio of production) - Figure 3
-Economic performance ~ productive performance (productivity) - Figure 4
-Production performance ~ production costs - Figure 5
The result is detailed below:
1.Profitability (EP) and production costs have a similar relationship, regardless of the cluster analysed. It follows a linear decreasing function (Figure 3) where profitability has an inverse relationship to production costs, therefore, as production costs increase, firms' profitability falls.
Costs are affected by the direct expenses produced by the activity itself, i.e., those expenses on inputs and resources necessary to carry out the production process (Ghida Daza et al., 2009).
In Figure 3 it was observed that as the ratio of cost to selling price approaches 1, i.e., they equalise, the regular and good performing clusters are less resilient to low or negative returns; and conversely the low performing dairy farms have more flexibility to withstand zero and
negative returns with the highest costs (higher variability function). This can be seen from the characteristics of the group where many estimated costs are computed as opportunity costs (family labour, family management, contingency fees).
The relationship between EP and production costs has already been indirectly supported by Ramirez et al. (2007), who concluded that the greatest impact on profitability is given by Net Income, strongly affected by costs, when they comparatively analysed the evolution of profitability in dairy farming and agriculture in the south of Santa Fe. This is also periodically accredited in Entre Ríos by Engler, Mancuso and Cancio (2022), monitoring these indicators, although in none of the cases cited is the evolution of the curve pursued by the parameters tracked.
Note. Prepared by the authors based on the panel database compiled for the 2012/2013, 2014/2015, 2016/2017 and 2020/2021 editions of the DSS.
Figure 3 Relationship between profitability and production
2.Regarding the relationship between profitability (EP) and productivity (PP), it could be stated that this relationship is not linear in any of the cases (clusters) and is instead represented by a quadratic function. The particularity that emerged is the presence of a concave quadratic fit function for the low and regular performance clusters, but convex for the high-performance cluster 3 (Figure 4).
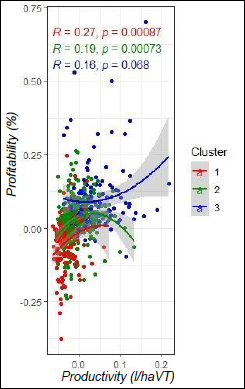
Note. Prepared by the authors based on the panel database compiled for the 2012/2013, 2014/2015, 2016/2017 and 2020/2021 editions of the DSS.
Figure 4 Relationship between profitability and productivity
Analysing the case of the concave quadratic function, when reaching a maximum point, productivity and profitability start a decreasing relationship. At these points there is a "constraint on the factors of production that hinders productivity" (Samuelson and Nordhaus, 2006. p-113), which we could consider as a "ceiling" of the factors of production. This is evident for low and regular performing clusters, where scale compromises productivity and thus the EP. It happens that as productivity grows, so does profitability, although not in a linear fashion, and profitability would need other factors and inputs of production to ensure it is greater than zero. This evidence is supported by the law of diminishing returns to scale; in other words, productivity managed to reach maximums that do not allow profitability to follow in the same way, so the latter should be analysed based on other factors that also affect it. Thus, Chimicz and Gambuzzi (2007), and Centeno (2015), studied the impact of stocking rate on productivity in dairy production systems, which was corroborated in this study (Figure 5), so the stocking rate factor should be included in the PP model.
It is important to observe the behaviour of the good performance cluster (convex quadratic function), which is different and is at a "floor" of growth in both the PP and the EP, so the capacity of this group to reach the maximum level of PP is high. As this group shows better performance, it would be able to be more flexible in the face of adverse situations inherent to the activity (herd mortality, inclement weather and/or assuming price adversity).
Note. Prepared by the authors based on the panel database compiled for the 2012/2013, 2014/2015, 2016/2017 and 2020/2021 editions of the DSS.
Figure 5 Relationship between productivity and animal load in milk production systems
3.Finally, a similarity to the previous case occurs in the relationship between PP and production costs, where the good performing cluster differs from the inferior ones. While the latter follow a concave quadratic function, the former follow a cubic or polynomial function (Figure 6).
Dairy farms with more difficulties in performance show high production costs, without achieving productivity or production efficiency reversals. High-performing dairy farms obtain a function where they go through three stages: a first stage with low production costs and high productivity, a second stage where they sustain productivity with cost increases, and a third stage of high productivity with high costs, where possibly the income of these farms falls given the productive dynamics and the complexity in the management of the processes that must be attended to.
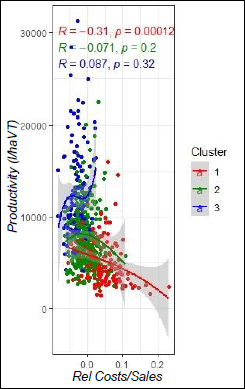
Note. Prepared by the authors based on the panel database compiled for the 2012/2013, 2014/2015, 2016/2017 and 2020/2021 editions of the DSS.
Figure 6 Relationship between productivity and production costs
Performance models
Six models were estimated at six models were estimated, three to model the EP, two for PP and one for the Cost/Sales ratio of production, which affects the EP, and which is understood to be another good indicator.
Mod_1, simple linear regression (LSR), where Y = EP, and X = rel. Costs/Sales.
Mod_2, polynomial function of degree 2, where Y = EP; and = PP .
Mod_3, multivariate linear regression (LMR), where Y = rel. Costs/Sales; X1 = Animal load; X2 = Installed cooling capacity; X3 = Rent; X4 = Family labour; X5 = haVT/haTAMBO; X6 = Grazing area.
Mod_4, of LSR, where y = PP; and X = Animal load.
Mod_5, of LMR where in two models the performance can be determined:
Model “a”, where y = EP; Xi = PCi , obtained from the variables analysed in dimensions (scale, business organization, productive management, economic and productive results).
Model “b”, y = PP; Xi = PCi , obtained from the same variables analysed for case “a”.
Table 2 expresses the results obtained for Mod_1, Mod_2, Mod_3 and Mod_4 with their corresponding components and statistics, while Table 3 expresses the Mod_5_a, and Mod_5_b.
Table 2 Economics and productive performance approximation models based on variables specific to production systems.
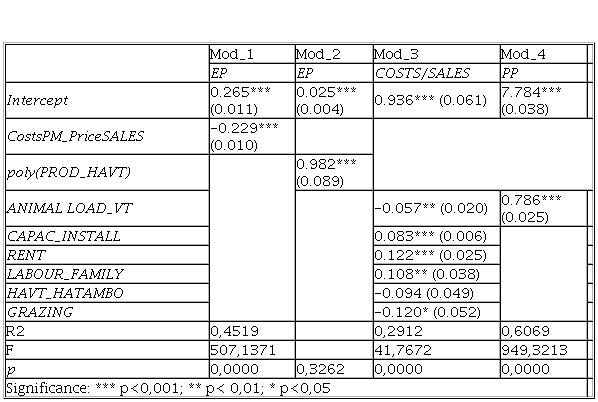
Note. Prepared by the authors based on the panel database compiled for the 2012/2013, 2014/2015, 2016/2017 and 2020/2021 editions of the DSS.
Table 3 Economic and productive performance approximation models based on synthetic variables or principal components.
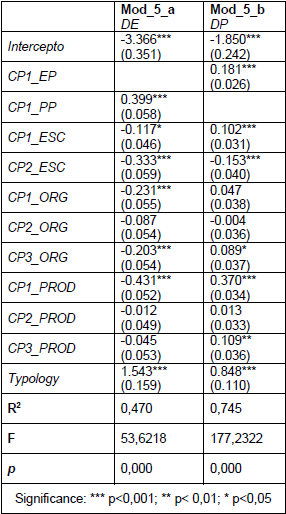
Note. Prepared by the authors based on the panel database compiled for the 2012/2013, 2014/2015, 2016/2017 and 2020/2021 editions of the DSS.
Of the models that estimate the EP, except for Mod_2, the rest are significant in approximating the factors that determine it. Mod_5_a could be selected as outstanding as it has more system factors (principal components of the dimensions addressed), with more information on the effect that could be expected to have on the EP. could The second option could be selected as the one with the highest system factors (principal components of the dimensions addressed), with more information on the effect they could cause, assuming that there is no two-way relationship between the variables, and finally with sustainable statistics.
Secondly, Mod_1 could be considered, which revealed a significant (negative) effect of costs on EP, although it proved not to be the only determinant of EP, since the error term of the model was large, i.e. there are factors that have not been taken into account. Finally, Mod_2 was not statistically significant in determining the EP even though productivity influences it. This model should be discarded or reformulated.
As for the models that defined the PP, both were statistically significant for their estimation, but Mod_5_b could be selected first. were statistically significant for its estimation, but Mod_5_b, which followed the same structure as Mod_5_a, could be selected first, giving the best statistical results. Mod_4, on the other hand, registered good results (significant) although it expressed little information to determine the PP; although the stocking rate influences it, it is insufficient to determine it, so other factors of the system should be analysed.
Finally, Mod_3 is significant for estimating the cost/sales ratio of production, an important factor in the EP, but it is insufficient to explain it, yielding a high estimation error. This indicates that there is a lack of information to improve this assessment of the model.
CONCLUSIONS
There is a typology of dairy farms in the Pampas Region that differs in terms of scale, business management, management of the production system and, therefore, in production and economic results. It is characterised by a smaller, low-performing group, a dominant, regular performing group, and a third, high-performing group. This last group of establishments is the one that is currently strongly consolidated and is growing steadily in the concentration of activity. This trend is taking hold in Argentina and those countries with dairy activity of global importance (Shields, 2010; Ministry of Economy, 2022). It is of interest to continue with the study of the behaviour of the PP and the production costs of this group, which presents a polynomial function that shows stages in the relationship. However, the group with regular competitive performance is the one that should be addressed in a sectoral manner, with strong public policies to enable the growth that the dairy chain can sustain (Baudracco et al., 2022) and given that it is predominant. The paper confirmed the findings of other authors regarding the relationships between variables, where costs directly affect profitability. Productivity affects profitability following a quadratic function, reaching a maximum, after which productivity will not maximise profitability in the case of low and regular performance clusters. In contrast, the high-performance cluster presents a quadratic but convex function, showing a productive floor that is minimising its profitability. Recognising this dynamic between the relationships between variables and typology could allow for better management of the systems' resources. The approximations achieved in the estimations account for key factors in the production system where the modelling of both economic and production performance yielded good estimators based on synthetic variables obtained from Principal Component Analysis, which made it possible to reduce variables and sustain the information, clustering and comparing the performance of conformed models with other more flexible models. It is suggested to continue with the deepening of the analysis following other theoretical frameworks that allow a better approach of the models to identify the factors that disrupt competitiveness in bovine milk production systems, in terms of costs, such as the use of the instrumental variables methodology.
Acknowledgements
To INTA, which enables exchange within the Socioeconomics and Impact Assessment Group at the EEA Paraná through the portfolio of ongoing projects, and which, together with CONICET5, finances this stage of doctoral training and research.

