


 Inglés (pdf)
 Articulo en XML
 Referencias del artículo
 Enviar articulo por email
 Citado por SciELO
  Similares en
SciELO
Similares en
SciELO 
 Permalink
Introduction
Brazilian population has a habit of consuming beans (Phaseolus vulgaris L.), which is produced in all regions of the country and destined almost entirely to domestic consumption. The crop has a short cycle, which represents a great advantage for farmers, as it is possible to sow two crops (corn or soybeans) followed by beans in the same area and agricultural year. Thus, in Brazil, beans can be sown in three different seasons, known as the water, drought, and winter seasons, thus providing a constant supply to the domestic market throughout the year 4.
The average production of Brazilian bean grains in the 2020/21 harvest was 1.1 t ha-1 (4. Among the factors that may explain this low productivity, one is the negative interference of weeds 24, which can cause losses in bean grain yields that can exceed 82% when control measures are not adopted 11,17,23.
Weeds reduce bean grain yields due to competition for environmental resources, such as nutrients, light, and water; in addition, they can release allelopathic compounds to the soil, resulting in qualitative and quantitative losses. They can also be responsible for indirect damage, hosting diseases and insects 10,11,16,21. Weeds at the end of the cycle can also interfere with the quality by depreciating the harvested product and making it difficult to harvest, either manual or mechanical 11,14,24.
Among the weeds infesting bean fields, it is worth mentioning that the Alexandergrass (Urochloa plantaginea (Link) R.D. Webster.) is one of the main weeds in the South, Southeast, and Midwest regions of Brazil, and in many cases, it is responsible for a high degree of damage 14. Alexandergrass is a C4 annual grass reproduced by seeds and is one of the main weeds competing directly for environmental resources 24. These plants grow quickly and infest large tracts of land easily and quickly, consequently shading the crops 10,13,14.
Weed management in bean fields is performed through chemical control in most cases due to its efficiency and lower cost when compared to other control methods. However, when used continuously, it can cause problems to the environment and to the applicator, leaving residues in grains and, in several cases, causing phytotoxicity to the crop 3. Thus, there is an increasing demand for more sustainable production models. For the development of weed control strategies in agricultural crops, it is necessary to know their traits.
The determination of competitive interactions between crops and weeds requires experimental designs and appropriate analysis methods. One of the most used is the substitutive series, where different densities of weed and crop plants are used 1,10,12,14. Because weed density is variable according to environmental conditions and the initial soil seed bank, the degree of infestation can be changed 2. The greater competitiveness of one species in relation to another indicates that it will have a greater capacity to assimilate resources and, therefore, have a greater potential to grow and develop 1,2,12. Choosing more competitive cultivars gives an advantage to the crop over the weeds. The rapid initial growth of crop plants supresses weed growth 2,9.
Thus, the development of strategies that will minimize the effects of weed competitiveness with crops, for example, most competitive bean cultivars, will greatly contribute to superior grain yields. Therefore, the objective of this work was to evaluate the competitive ability of carioca type bean cultivars BRS FC104, BRS FC402, IAC Imperador, IAC Milênio, IPR Tangará, and SCS Riqueza in the presence of Alexandergrass as a function of plant proportion.
Material and methods
The experiments were conducted in a greenhouse at the Federal University of Fronteira Sul (UFFS), Campus Erechim, RS, Brazil, in the 2019/20 cropping season. Experimental units consisted of plastic pots with a capacity of 8 dm3 filled with soil from an arable area, characterized as humic Oxisol 22. Correction of pH and soil fertilization were carried out according to soil analysis and following the technical recommendations for common beans 19. The chemical and physical soil characteristics were: pHwater= 4.8; organic matter (OM)= 3.5%; P= 4.0 mg dm-3; K= 117.0 mg dm-3; Al3+ = 0.6 cmolc dm-3; Ca2+= 4.7 cmolc dm-3; Mg2+ = 1.8 cmolc dm-3; effective cation exchange capacity (CEC)= 7.4 cmolc dm-3; CEC at pH7= 16.5 cmolc dm-3; H + Al = 9.7 cmolc dm-3; sum of bases (SB)= 6.8 cmolc dm-3; aluminum saturation (V)= 41% and Clay= 60%.
The experimental design was completely randomized with four replications. Tested competitors included the bean (Phaseolus vulgaris) cultivars BRS FC104, BRS FC402, IAC Imperador, IAC Milênio, IPR Tangará, and SCS Riqueza Wealth, which competed with Alexandergrass (Urochloa plantaginea). Preliminary experiments were carried out for both beans and Alexandergrass growing single, with the objective of determining the density of plants in which the final production becomes constant. For this, populations of 1, 2, 4, 8, 16, 24, 32, 40, 48, 56, and 64 plants per pot were used (equivalent to 25, 49, 98, 196, 392, 587, 784, 980, 1,176, 1,372, and 1,568 plants m-2). Twenty five days after emergence, the aboveground masses of beans and Alexandergrass were collected to determine the aboveground dry mass (DM), which was quantified by weighing after being dried in a forced air circulation at a temperature of 60 ± 5°C until reaching constant mass. Through the average DM values of the species, the constant DM production was obtained with densities of 40 plants per pot for Alexandergrass and all bean cultivars, which was equivalent to 650 plants m-2 (data not shown).
After the identification of the constant final density, six other experiments were installed to evaluate the competitiveness of the bean cultivars BRS FC104, BRS FC402, IAC Imperador, IAC Milênio, IPR Tangará, and SCS Riqueza with Alexandergrass. All experimens were conducted in substitutive series in different combinations of cultivars and weeds, varying the relative proportions of plants per pot (40:0; 30:10; 20:20; 10:30, and 0:40) while maintaining a constant total plant density (40 plants per pot). In order to establish the desired densities in each treatment and to obtain uniform seedlings, the seeds were previously sown in trays and later transplanted to the pots.
Thirty five days after the emergency (DAE), plant height (EP), stem diameter (DP), leaf area (AF), and aboveground dry mass (DM) were measured. The plant height (cm) was determined with a ruler from the soil surface to the apex meristem of the plants. The stem diameter (mm) was measured with the aid of a digital caliper, 5 cm above soil surface. For the determination of the AF, a portable leaf area meter model CI-203 (BioScience Inc.) was used. After determining the AF, the plants were packed in paper bags and put into an oven for dry mass determination.
Thirty DAE, the plant physiology of the bean cultivars was measured. The CO2 concentration in the substomatal chamber (Ci - μmol mol 1), photosynthetic rate (A - μmol m 2 s 1), stomatal conductance (Gs - mol m 2 s 1) and transpiration rate (E - molH2O m 2 s 1), carboxylation efficiency (EC - molCO2 m 2 s 1), and water use efficiency (WUE - molCO2 molH2O -1) were assessed.
These variables were determined in the canopy of the bean plants in the first fully expanded leaf. To assess the physiological variables, an infrared gas analyzer (IRGA) ADC LCA PRO (Analytical Development Co. Ltd, Hoddesdon, UK) was used between 8 and 11 hours in the morning. One experiment was assessed per day.
Data were analyzed by the method of graphical analysis of variation or relative productivity 1,2,5. This procedure, also known as the conventional method for substitutive experiments, consists of the construction of diagrams based on the relative (PR) or total (PRT) productivities. When PR is a straight line, it means that the ability of the species is equivalent. If PR results in a concave line, it indicates that there is a loss in the growth of one or both species. On the contrary, if the PR shows a convex line, there is a benefit in the growth of one or both species. When PRT is equal to 1 (straight line), competition for the same resources occurs; if it is greater than 1 (convex line), competition is avoided. If PRT is less than 1 (concave line), there is mutual harm in growth 5. The relative competitiveness indexes (CR), relative clustering coefficient (K), and aggressiveness (A) of the species were also calculated. CR represents the comparative growth of common bean cultivars (X) in relation to the competitor Alexandergrass (Y). K indicates the relative dominance of one species over the other, and A indicates which species is more aggressive. Thus, CR, K, and A indicate which species is most competitive, and their joint interpretation determines with greater certainty the competitiveness of the species 5. Common bean cultivars X are more competitive than Alexandergrass Y when CR > 1, Kx > Ky, and A > 0. On the other hand, Alexandergrass Y is more competitive than bean cultivars X when CR < 1, Kx < Ky, and A < 0 2. To calculate these indices, the 50:50 proportions of the species involved in the experiments were used, using the equations: CR = Prx/Pry; Kx = Prx/(1 Prx); Ky = Pry/(1-Pry); A = Prx PRy, according to Cousens and O’Neill (1993).
The procedure of the statistical analysis of productivity or relative variation included the calculation of the differences for the PR (DPR) values, obtained in the proportions 25, 50, and 75% in relation to the values belonging to the hypothetical line in the respective proportions 2,5. The t-test was used to test the differences related to DPR, PRT, CR, K, and A 2,5. To test the differences of DPR and A, it was considered a null hypothesis when the averages are equal to zero (Ho = 0). For PRT and CR, the null hypothesis is when the averages are equal to one (Ho = 1), and for K, the null hypothesis is if the averages of the differences between Kx and Ky are equal to zero [Ho = (Kx Ky) = 0]. The criterion for considering the PR and PRT curves to be different from the hypothetical lines was that, at least in two proportions, significant differences occurred by the t-test 2. Likewise, for CR, K, and A, differences in the competitiveness were considered when there was a significant difference by the t-test in at least two of them.
The results obtained for EP, DC, AF, MS, and the physiological variables, expressed as mean values per treatment, were subjected to analysis of variance by the F-test; when significant, the means were compared by Dunnett’s test. Monocultures were considered the control in these comparisons. In all the statistical analyses, a significance of p ≤ 0.05 was adopted. All graphics and coefficients were obtained using the statistical environment “R” 18.
Results and discussion
All carioca bean cultivars showed similarities regarding the competition. They were all harmed by Alexandergrass with significant differences for the height, diameter, dry weight, and leaf area for all plant proportions (Figure 1, page 121; Figure 2, page 122; Figure 3, page 123, Figure 4, page 124).

Figura 1: Productividad relativa (PR) para la altura de planta de frijol (●) y Urochloa plantaginea (o), y productividad relativa total (PRT) de la comunidad de plantas (▼) en función de la proporción de plantas.

Figura 2: Productividad relativa (PR) para el diámetro del tallo de frijol (●) y Urochloa plantaginea (o), y productividad relativa total (PRT) de la comunidad vegetal (▼) en función de la proporción de plantas.
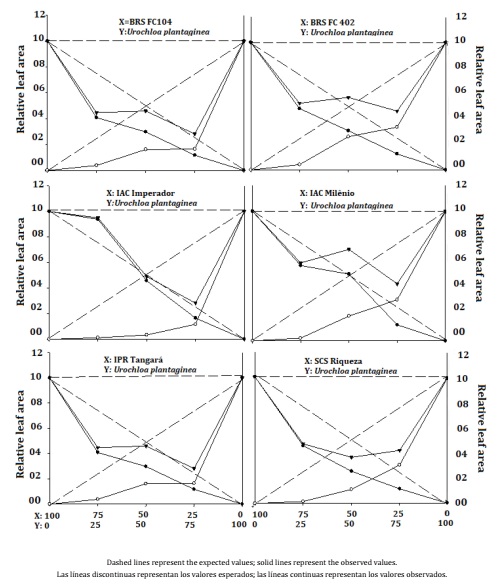
Figura 3: Productividad relativa (PR) para el área foliar de frijol (●) y Urochloa plantaginea (o), y productividad relativa total (PRT) de la comunidad vegetal (▼) en función de la proporción de plantas.

Figura 4: Productividad relativa (PR) para la masa seca aérea de frijol (●) y Urochloa plantaginea (o), y productividad relativa total (PRT) de la comunidad vegetal (▼) en función de la proporción de plantas.
With regard to PRT, there were no statistical differences between the expected and estimated values only for the plant height, where it presented average values close to 1 in all combinations (Figure 1, page 121; Table 1, page 125), demonstrating that the bean and Alexandergrass compete for the same environmental resources.
Table 1: Relative differences for carioca bean cultivars against the competitor Urochloa plantaginea, available 30 days after crop emergence. UFFS, Campus Erechim, RS, 2019/2020.

* Significant difference against the competitor, according to the t test (p ≤ 0.05). Values into brackets represent the mean standard error.
* Diferencia significativa frente al competidor, según la prueba t (p ≤ 0,05). Los valores entre paréntesis representan el error estándar medio.
For the plant diameter (Figure 2, page 122), the expected and estimated values of PRT were higher and lower than 1, respectively, and for leaf area and aboveground dry mass (Figures 3 , page 123 and Figure 4, page 124), the values were all less than 1. When the PRT has concave lines and values less than 1, it is possible to infer that there was competition between crop and weed for the same environmental resources. Rubin et al. (2014) and Galon et al. (2017) reported that when PRT is less than 1, there is mutual antagonism.
The stem diameter of BRS FC 104, BRS FC 402, IAC Imperador, IAC Milênio, IPR Tangará, and SCS 205 Riqueza showed deviations from the PR lines in relation to the expected lines, indicating that the crop was more damaged than the weed (Figure 2, page 122).
The PRT values were less than 1 for BRS FC 104, IAC Imperador, IAC Milenio, and IPR Tangará, demonstrating damage to both crop and weed, whereas BRS FC 402 and SCS 205 Riqueza showed deviations in only one point. In order to be considered significant, they must differ in at least two plant proportions 2.
The decreases in stem diameter occurred when the crop and weed were in the proportion of 50:50; BRS FC 104, IAC Imperador, and IAC Milênio showed a decrease in the stem diameter of 2.09, 12.29, and 2.92%, respectively (Figure 2, page 122; Table 2, page 126).
Table 2: Differences between carioca bean cultivars and the competitor Urochloa plantaginea available 30 days after emergence. UFFS, Campus Erechim-RS, 2019/20.

* Mean differ from the respective control treatment (100:0 bean:Alexandergrass) according to Dunnett’s (p ≤ 0.05).
* La media difiere del tratamiento de control respectivo (100: 0 frijol: Alexandergrass) según Dunnett (p ≤ 0,05).
BRS FC 402, IPR Tangará, and SCS 205 Riqueza had an increase in diameter of 17.49, 4.05, and 21.56%, respectively.
The leaf area of cultivars BRS FC 104, BRS FC 402, IAC Imperador, IAC Milênio, IPR Tangará, and SCS 205 Riqueza (Figure 3, page 123; Table 1, page 125) showed deviations from the PR lines in relation to the expected lines, indicating that the crop was more damaged than the weed.
The PRT values (Figure 3, page 123) were all lower than 1 with concave lines, indicating that both the crop and the weed were harmed. When studying the effect of weeds on soybean 9 and black beans 12, these studies reported that there were concave lines for the crop and competitor for the leaf area and dry mass, which corroborates our findings. These same authors, assessing the competitive ability of transgenic soybean cultivars with weeds, also reported similar findings for both the leaf area and dry mass. The leaf area showed decreases of up to 48.67% when the crop competed in the proportion of 50:50 with the weed (Table 2), demonstrating that the crop and weed compete for the same environmental resources. Forte et al. (2017) also found similar results.
In the proportion 50:50 (Table 2, page 126), there were decreases of 17.30, 9.74, 14.68, 11.80, 30.15, and 27.32% in the dry mass of BRS FC 104, BRS FC 402, IAC Imperador, IAC Milênio, IAC Tangará, and SCS Riqueza, respectively. Franceschetti et al. (2019) reported that for the black beans cultivar IPR Uirapuru, when Alexandergrass is not controlled, dry mass losses may be of the order of 48.79%.
The dry mass was reduced most significantly when the competitor was present in greater proportions than the crop. Passini et al. (2002) reported that 25 plants m-2 of Alexandergrass may cause up to 70% grain yield losses in beans. This crop, when in an equidistant plant arrangement, is most prone to suppress the weed population as well as to increase productivity 7,13. Parreira et al. (2014) reported that, depending on the species, one may be more competitive than the other; however, weeds usually have a competitive advantage on resource acquisition 1,2,11.
The relative dominance of beans over weeds, expressed by the K indexes (K bean > K weed), shows that the crop is more competitive than Alexandergrass (Table 3, page 128), which is also reflected in the aggressiveness index (A).
Table 3: Competitiveness indexes between carioca bean cultivars and the competitor Urochloa plantaginea, expressed as relative competitiveness (CR), relative clustering coefficients (K) and aggressivity (A), from replacement series experiments. UFFS, Campus Erechim-RS, 2019/2020.

* Significant difference against the competitor, according to the t test (p ≤ 0.05). Values into brackets represent the mean standard error.
* Diferencia significativa frente al competidor, según la prueba t (p ≤ 0,05). Los valores entre paréntesis representan el error estándar medio.
In all comparisons, significant differences can be seen in at least two indices between bean cultivars and the competitor, showing that the crop is more competitive than the weed.
It was found that there were differences in relation to CR, K, and A when beans coexisted with Alexandergrass. Only in one situation did the weed show a higher CR, K, and A than the crop, and only for stem diameter (Table 3, page 128). When placed in competition with wild genotypes, domesticated species tend to have a higher relative productivity 12,20.
There were increases or decreases in plant physiology as a function of plant proportion. These factors may be related to the bean canopy architecture, as it can interfere with the distribution of light as well as air circulation, thus affecting CO2 transfer and evapotranspiration. According to Ferreira et al. (2015), the increase in plant density causes a scarcity of resources. In other words, the yield becomes independent of the plant density after a certain level of infestation.
Bean cultivars increased the internal CO2 concentration (Ci) when plant density increased (Table 4, page 129).
Table 4: Physiological parameters of carioca bean cultivars against the competitor Urochloa plantaginea, 30 days after crop emergence. UFFS, Campus Erechim, RS, 2019/2020.

* Significant difference against the competitor, according to the Dunnett’s (p ≤ 0.05). Values into brackets represent the mean standard error. Ci (CO2 concentration), A (Photosynthetic activity) Gs (stomatal conductance), E (Transpiration rate), CE (carboxylation efficiency) and WUE (efficiency in the use of water).
* Diferencia significativa frente al competidor, según Dunnett’s (p ≤ 0,05). Los valores entre paréntesis representan el error estándar medio. Ci (concentración de CO2), A (actividad fotosintética) Gs (conductancia estomática), E (tasa de transpiración), CE (eficiencia de carboxilación) y WUE (eficiencia en el uso del agua).
Ci is considered a physiological variable influenced by environmental factors such as water availability, light, and energy, among others 8. The increase in Ci for the crop may indicate an attempt to escape the stress generated by the competition but leads to remarkable harm for the physiological status of the bean plants.
The photosynthetic activity (A) as well as stomatal conductance (Gs) varied with the cultivar (Table 4, page 129), showing remarkable differences among them in competition with the weed. Nascimento et al. (2011) reported that, as a way to avoid water stress, plants tend to close the stomata, leading to a decrease in gas exchange and, consequently, in the photosynthetic rate.
Santos et al. (2018b) reported that the photosynthetic rate is directly related to photosynthetically active radiation as well as to water availability and is highly dependent on stomatal opening; thus, it is a good indicator of the response of the crop to competition with weeds. The transpiration rate (E) and carboxylation efficiency (CE) varied according to the cultivar and plant proportion. Santos et al. (2018b) also stated that stomatal closure causes a drop in transpiration, and variations in stomata opening cause changes in water potential, as they act on the transpiration rate.
Santos et al. (2008b) reported that transpiration is a primary determinant of the energy balance and water status of the plant; it is mainly determined by Gs, radiation, and the deficit of atmospheric saturation, where all these variables together determine the photosynthetic capacity of the plants.
The water use efficiency (WUE) also presented different values according to the cultivar (Table 4, page 129). There was a considerable decrease in the dry mass, on the other hand, for all bean cultivars, and these values are related to other physiological variables because all variables are closely linked. According to Ferreira et al. (2015), soybean competition with Urochloa brizantha and Bidens pilosa caused a decrease in the photosynthetic rate, transpiration, stomatal conductance, efficiency in the use of water, and aboveground dry mass of soybean, with U. brizantha being the most harmful to the crop.
In general terms (Table 4), most bean cultivars tended to increase the photosynthesis rate as the proportion of the competitior was also increased. Although this is a sign of a superior competitive ability, it is not the determing factor in choosing carioca bean cultivars with a superior competitive ability against Alexandergrass. Superior water conductance was reported for IAC Imperador, IPR Tangará, and SCS 205 Riqueza. Cultivars IAC Imperador and SCS 205 Riqueza tended to have an overall superior physiological performance in the competition with Alexandergrass. On the down side, IAC Milênio tended to present a lower photosynthetic rate coupled to a superior internal CO2 as well as a lower carboxilative efficiency (Table 4), making it the worst performing cultivar with regard to the physiological aspects.
Conclusions
There is competition between carioca bean cultivars and the weed Alexandergrass for the same environmental resources. From the physiological point of view, the best performing cultivars in the competition with Alexandergrass were IAC Imperador and SCS 205 Riqueza, while the worst was IAC Milênio. The adoption of an ecophysiological strategy of escape to competition when growing carioca beans in Alexandergrass-infested areas is recommended. In other words, the weed should be controlled earlier in the crop cycle, and competitive cultivars such as IAC Imperador and SCS 205 Riqueza should be preferred to reduce losses by competition.

