


Servicios Personalizados
Revista

Articulo
 Inglés (pdf)
 Articulo en XML
 Referencias del artículo
 Enviar articulo por email
Indicadores
-
 Citado por SciELO
Links relacionados
-
 Similares en
SciELO
Similares en
SciELO
Compartir

 Permalink
Revista de nefrologia, dialisis y trasplante
versión On-line ISSN 2346-8548
Rev. nefrol. dial. traspl. vol.42 no.3 Ciudad Autónoma de Buenos Aires set. 2022
Artículo Original
How can we predict the kidney graft failure of Portuguese patients?
¿ Cómo predecir el fallo del injerto renal de los pacientes portugueses?
Sofia Cerqueira
Maria R. Campelos
Argentina Leite
E.J. Solteiro Pires
Luís Torres Pereira
Hugo Diniz
Susana Sampaio
Arnaldo Figueiredo
Rui Alves
1Nephrology Department, Centro Hospitalar Universitario de Coimbra, Coimbra, Portugal
2Science and Technology School, Trás-os-Montes e Alto Douro University, Vila Real, Portugal
3Nephrology Department and Kidney Transplant Unit, Centro Hospitalar Universitario Sao Joáo, Porto, Portugal
4Nephrology Department, Centro Hospitalar Universitario de Coimbra, Coimbra, Portugal
5Faculty of Medicine, University of Coimbra, Portugal
6Department of Urology and Kidney Transplantation, Centro Hospitalar Universitario de Coimbra, Coimbra, Portugal
ABSTRACT
Background: The gap between offer and need for a kidney transplant (KT) has been increasing. The Kidney Donor Profile Index (KDPI) is a measure of "organ quality" and allows estimation of graft survival, but could not apply to all populations. Knowledge of our kidney donor and recipient population is vital to adjust transplant strategies. Methods: We performed a retrospective evaluation of donors and recipients of KT regarding two kidney transplant units: Centro Hospitalar Universitário de Coimbra, CHUC (Coimbra, Portugal) and Centro Hospitalar Universitario de Sao Joáo, CHUSJ (Porto, Portugal), between 2013 and 2018. We then did statistical analysis and modeling, correlating these KT outcomes with donor and recipient characteristics, including KDPI. Artificial intelligence methods were performed to determine the best predictors of graft survival. Results: We analyzed a total of 808 kidney donors and 829 recipients of KT. The association between KDPI and graft dysfunction was only moderate.
The decision tree machine learning algorithm proved to be better at predicting graft failure than artificial neural networks. Multinomial logistic regression revealed recipient age as an important prognostic factor for graft loss. Conclusions: In this Portuguese cohort, KDPI was not a good measure of KT survival, although it correlated with GFR 1 year post-transplant. The decision tree proved to be the best algorithm to predict graft failure. Age of the recipient was the most important predictor of graft dysfunction.
KEYWORDS: graft failure; kidney transplantation.
RESUMEN
Introducción: La diferencia entre la oferta y necesidad de un trasplante de riñón (TR) ha aumentado. El Kidney Donor Profile Index (KDPI) es una medida de la "calidad del órgano" y permite estimar la supervivencia del injerto, pero quizás no puede aplicarse a todas las poblaciones. El conocimiento de nuestra población de donantes y receptores de riñón es vital para ajustar las estrategias de trasplante. Objetivo: Evaluar predictores de fallo del injerto renal en una población receptora de trasplante de riñón en dos centros portugueses. Material y métodos: Realizamos una evaluación retrospectiva de donantes y receptores de TR en dos unidades de trasplante renal: Centro Hospitalar Universitário de Coimbra, CHUC (Coimbra, Portugal) y Centro Hospitalar Universitário de Sao Joao, CHUSJ (Porto, Portugal), entre 2013 y 2018. Luego hicimos un análisis estadístico, correlacionando estos resultados de TR con las características del donante y el receptor, incluido el KDPI. Se utilizaron métodos de inteligencia artificial para determinar los mejores predictores de la supervivencia del injerto. Resultados: Analizamos un total de 808 donantes de riñón y 829 receptores de TR. La asociación entre KDPI y disfunción del injerto fue solo moderada. El algoritmo de aprendizaje automático del árbol de decisiones demostró ser mejor para predecir fallas de injerto que las redes neuronales artificiales. La regresión logística multinomial reveló que la edad del receptor es un factor pronóstico importante para el fallo del injerto. Conclusión: En esta cohorte portuguesa, el score KDPI no fue una buena medida de la supervivencia del TR, aunque se correlacionó con la TFG 1 año después del trasplante. El árbol de decisiones demostró ser el mejor algoritmo para predecir la falla del injerto. La edad del receptor fue el predictor más importante de fallo del injerto renal.
PALABRAS CLAVE: fallo del injerto renal; trasplante renal.
INTRODUCTION
In recent years, the kidney transplantation population has changed. The demographics of our population are changing, with both donors' and recipients' age steadily increasing. This has led to frequent use of suboptimal donors and to new challenges: how to wisely use kidneys from older donors, and how to evaluate their expected graft survival?
Kidney Donor Profile Index was developed in 2009 in the USA to help kidney organ allocation. This score's was based on the statistical analysis of 70000 donors from 1995 to 2005 and aimed at predicting graft survival. Kidneys with higher scores have a lower predicted graft survival, with donors with KDPI >85% being considered expanded criteria donors. However, recent studies have shown that this score may not be applicable in other populations outside the USA (eg: Ireland, Spain, Norway, and Germany).(1-3) Also, recent studies show that this score may lead to a higher kidney discard rate than necessary.(4)
Our study aimed to characterize a Portuguese cohort of KT recipients and donors and investigate the adequacy of the KDPI and its correlation with outcomes. We also searched for significant predictors of graft outcomes and for algorithms to predict kidney graft failure.
METHODS
Study subjects
This is a retrospective study of KT donor and recipient population in two Portuguese centers, between 2013 and 2018. In total, we gathered information from a total of 808 kidney donors and 829 recipients of KT. The latter were analyzed regarding clinical and immunological aspects. Graft outcomes were correlated with data from their corresponding donors.
Data were collected according to the confidential database of the Hospital's Cabinet for Coordination of Harvest and Transplantation and consultation of individual clinical files. Follow up 5 years (mean 2.85 years) post-transplant. Due to the retrospective, non-interventional nature of the study, and data anonymization, informed consent was waived by the Ethical Committee.
Calculation of KDPI
KDPI was calculated, when possible, using ten donor characteristics: age, height, weight, ethnicity, hypertension, diabetes, cause of death, serum creatinine, and hepatitis C status. Donation after circulatory death was only performed in one of the centers (CHUSJ), accounting for 4% of the analyzed center's donors (n=4/103).
Other definitionsExpanded criteria donors were defined as age >60 years, or between 50 and 59 years plus two of the following criteria: cerebrovascular accident as the cause of death, preexisting hypertension, or terminal serum creatinine greater than 1.5 mg/dl. Graft survival was defined as a functioning graft, even if with chronic dysfunction. Terminal graft dysfunction was defined as restarting dialysis after an initially good graft function. GFR was calculated according to the Modification of Diet in Renal Disease Formula. Finally, acute rejection was defined as acute cellular and/or humoral graft rejection (kidney biopsy-proven).
ImmunosuppressionMost patients initially received induction therapy with anti-interleukin-2 recipient antibody, calcineurin inhibitor, mycophenolate, and steroids. Steroid tapering was performed to achieve 5 mg at 6 months post-transplant if no major immunological event had occurred. Hyperimmunized patients, patients with preformed Donor-Specific Antibodies and recipients of Deceased after cardiac-death donors received anti-thymocyte globulin as induction therapy instead of anti-interleukin-2 recipient antibody.
Data analysisThe database collected at CHUC and CHUSJ contained information regarding kidney donors and recipients. We investigated associations between KDPI score, GFR at one-year post-transplant, terminal dysfunction, and graft survival in our population.
Sur vi val analysis was performed with the Kaplan-Meier method and log-rank test. The data were analyzed by the chi-square test and t-tests/ ANOVA for independent variables. In the case of a non-parametric distribution, the Kruskal-Wallis test was used. The significance level was set to <0.05. Univariate and multivariate analyses were conducted using the Cox proportional hazard models with a confidence interval of 95%. A stepwise backward elimination, including the recipient age, donor age, number of HLA mismatches, KDPI, donor hypertension, donor diabetes, and donor cerebrovascular death, was used for the multivariate analysis. The square of eta value was analyzed to determine dependence of graft dysfunction on the KDPI score. SPSS version 23 for Windows (IBM, Armonk, NY, USA) was used for statistical analysis.
To investigate which characteristics would have the greatest impact on graft survival, two machine learning methods (decision trees and artificial neural networks) were used to predict KT success.(5) The dataset of patients was reduced to 373 patients due to missing data. The variables used in this analysis were donor and recipient age, donor height, donor weight, donor's serum creatinine, donor's hypertension, donor's diabetes, cause of death of the donor, number of HLA-DR compatibilities between donor and recipient, and Panel Reactive Antibody (PRA) of the recipient.
A. Decisión treeA decision tree (DT) is an algorithm that uses a segmentation strategy and presents its results in the form of a tree. The discriminative capacity of the tree is related to the gradual segmentation according to the variable of interest or segmentation variable that will allow it to obtain classifications in homogeneous groups of the sample in question. In this analysis, we used the Gini index and the DecisionTreeClassifier (a class capable of performing multi-class classification on a dataset).
B. Artificial neural networkAn artificial neural network (ANN) is a model of regression or classification capable of establishing a relationship between input signals (variables or features) and an output signal (dependent variable, in our case dysfunction or non-dysfunction).
It is essential to highlight that, both in the DT method and in the application of ANNs, 80% of data were used to build the tree and train the network, respectively. These samples were selected homogeneously to keep this set balanced. The remaining 20% were used for testing.
The importance of the features was also studied using the ExtraTree Classifier. Knowing that the models used are intended to predict and/ or classify patients, it was necessary to carry out a statistical analysis of each one.
To determine the best model to predict kidney graft terminal dysfunction the accuracy, sensitivity, specificity, and their averages and respective standard deviation were evaluated.
RESULTS
Patient characteristics
Recipient and donor's characteristics obtained from the analysis of the two KT units' data are summarized in the Table 1. (Pág. 192)
Table 1. Kidney donor and recipient characteristics (CHUC and CHUSJ)
| DONOR AND RECIPIENT CHARACTERISTICS | |
| (total 808 donors; 829 recipients) | |
| Donor Age (n, %) <18 | 17 (2,0%) |
| 18-50 | 290 (35,9%) |
| >50 | 502 (62,1%) |
| ECD (n, %) Total 659 cases | 345 (52,4%) |
| KDPI (median, IQR), % | 65 % (41) |
| History of Donor Hypertension | 231/335 (68,9%) |
| History of Donor Diabetes | 52/185 (28%) |
| Cause of death (n, %) | Cerebrovascular accident: 367 (50,5%) |
| Trauma: 205 (28,2%) | |
| Total 727 cases | Anoxia: 45 (6,2%) |
| Others: 110 (15,1%) | |
| Donation after circulatory death status | 37/808 ( 4,6 %) |
| Recipient Age <18 | 7 (0,8%) |
| 18-50 | 317 (38,2%) |
| >50 | 493 (59,5%) |
| HLA-AB compatibility >3 (n, %) | 56 (6,8%) |
| HLA-DR compatibility >1 (n, %) Total 773 cases | 549 (71%) |
ECD- expanded criteria donor; KDPI - kidney donor profile index
| Patient and graft survival We analyzed the outcomes of 588 recipients of a kidney transplan t, as 241 patients were lost to follow-up. Graft survival was 92% in the first year. 21 patients (3,5% of the KT recipients) died during follow up. There were 17 acute KT rejections (2.8%) during our follow-up. Less than 10% of grafts (46/588; 7.8%) were lost due to terminal graft dysfunction. Mean graft survival for patients who received a kidney from a donor with KDPI >80% was 2.8 years [0.08- 5]. Prediction of survival According to the decision tree and the artificial neural network, the most important characteristics | for prediction of kidney graft failure were (from most to least important): age of the recipient, age of the donor, donor's serum creatinine, PRA of the recipient, HLA- DR compatibility between donor and recipient, cause of donor's death, presence of donor's hypertension and donor's diabetes. Boxplots were drawn, taking into account the cleaned dataset, covering the 373 patients involved in the first phase of data processing. (Figure 1) In Figure 1(a), it is intuitively recognized that terminal dysfunction is associated with a group of donors with advanced age since, in the corresponding boxplot, the first and third quartiles vary between 52 and 70 years old. On the other hand, in the boxplot with no dysfunction, the |
| 192 | ISSN 0326-3428 |
same quartíles show ages between 45 and 59.
Figure 1(b) shows that kidneys from donors with a higher serum creatinine at the time of death are assocíated wíth more líkely kídney graft dysfunction. Both diagrams have a close uniform distribution (there is no significant data variability).
Regarding the age of the receiver, in Figure 1(c), recipients with terminal kidney graft dysfunction tended to be slightly older compared to those who did not present dysfunction.
Hypertension, represented in Figure 1(e), assumes values of 0 and 1. It was necessary to calculate the quartile values due to the lack of graphic differentiation between them. The following results were obtained: the value of the second and the first quartile are zero, and the value of the third quartile is equal to one, either in the case of "without dysfunction" as in the case of "with dysfunction".
According to the list of features, the presence of donor's diabetes had the least impact on the prediction of kidney transplantation, consistent with the data observed in the boxplot (d).
PRA occupies the sixth position on the same list. The greater number of outliers in PRA (most of the patients had a PRA of 0%), reveals that it may be of greater importance than that demonstrated by the boxplot, Figure 1(g).
Figure 1. Boxplots with the features of the two groups, "without terminal graft dysfunction"(black) and "terminal graft dysfunction"(grey)
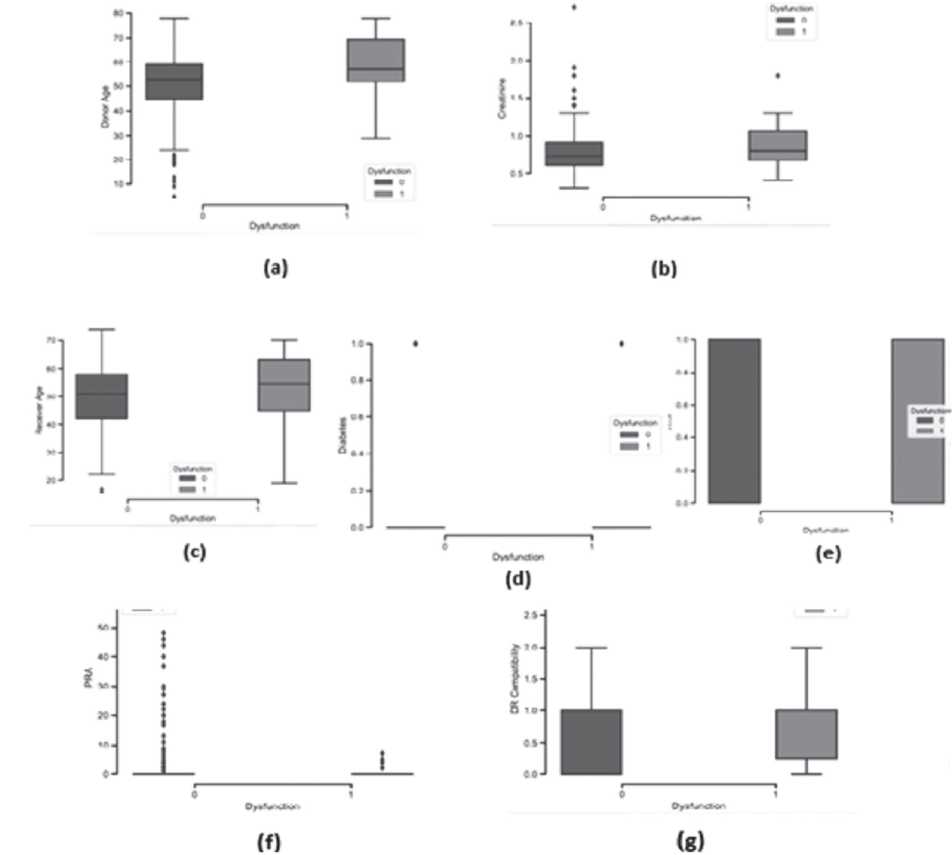
(a) Donor Age; (b) Donor's Serum Creatinine; (c) Receiver's Age; (d) Presence of Diabetes; (e) Presence of hypertension; (f) PRA; (g) DR Compatibility
In Figure 1(g), the first or second boxplot has an average of 1. As expected, individuáis with graft dysfunction had lower HLA-DR compatibility. On the other hand, individuals with higher graft survival showed a higher degree of HLA-DR compatibility.
Regarding the statistical analysis of the two machine learning models, the DT proved to be a better predictor than ANNs because, on average, it presented higher accuracy and sensitivity values. Regarding the average specificity, in both studies, it is 0.60, but the standard deviation varies being higher in the DT. This can be a problem because, as all statistical analysis parameters vary between 0 and 1 (0% -100%), a variation of 0.23 implies that there may be cases in which the probability of predicting non-dysfunction drops to 37% or lower. On the other hand, for an ANN, the same probability would drop to 49% or lower.
The low number of patients with graft dysfunction in this dataset was a limitation for statistical analysis and power of data. In our population, there was no difference in graft survival between strata of KDPI (p>0.05). (Table 2)
Table 2. Mean graft survival according to strata of KDPI
| KDPI score | N | Mean graft survival | Standard-error | 95% Confidence Interval | p-value |
| 1 | 52 | 2,869 | 0,206 | 2,45 to 3,28 | p > 0.05 |
| 2 | 70 | 2,764 | 0,172 | 2,42 to 3,11 | |
| 3 | 120 | 2,794 | 0,124 | 2,55 to 3,04 | |
| 4 | 171 | 2,726 | 0,107 | 2,51 to 2,94 | |
| 5 | 163 | 2,776 | 0,119 | 2,54 to 3,01 | |
| total | 576 |
There was a significant correlation between recipient-donor HLA-AB mismatch and graft survival (p=0.048), and there was also a significant negative correlation between recipient - donor HLA-DR mismatch and graft survival (correlation coefficient - 0.03, p=0.00).
In this cohort, we couldn't find a significant correlation between recipient's percentage PRA and graft survival. There also was not a significant correlation between recipient's age, donor's age, and graft survival in our cohort (p >0.05). In our population, the donor's cause of death also did not significantly affect graft survival (p >0.05).
Prediction of graft lossWhen analyzing both KT units' data, we conclude that the association between KDPI and graft dysfunction was only moderate (eta value= 0,437, meaning that only 19% of the terminal graft dysfunctions could be accounted for the value of KDPI).
Graft dysfunction was not higher when using kidneys from expanded criteria donors (p >0.05). While kidneys from Expanded Criteria Donors showed a trend toward a lower GFR one year after kidney transplantation (51.2 ± 20 ml/min vs 56.5 ± 25 ml/min), this did not reach statistical significance.
A multinomial logistic regression was performed to assess the ability of recipient age, donor age, KDPI, hypertension of donor, diabetes of donor, or donor meeting expanded criteria to predict terminal dysfunction of the graft.
Only recipient age was statistically significant (P = -0.051, s.e. 0.018, p <0.05), as seen on Table 3. This meant that the odds of terminal
dysfunction changed by 0.951 for each year means of age between the group of patients with
older a recipient was. The other variables tested graft dysfunction and those without it were not
proved not to be significant predictors of terminal statistically significant (U=10712, p >0.05). dysfunction in our population. However, the
Table 3. Multinomial logistic regression analysis
| Model | Unstandardized coefficients | Sig | Exp (B) | 95% Confidence Interval Exp (B) | ||
| Variables | Beta | Standard error | Inferior limit | Superior limit | ||
| Age of donor | 0.029 | 0.036 | 0.419 | 1.029 | 0.96 | 1.104 |
| Age of recipient | -0.051 | 0.018 | 0.005 | 0.951 | 0.918 | 0.985 |
| KDPI | 0.006 | 0.018 | 0.734 | 1.006 | 0.972 | 1.041 |
| Hypertension | -0.687 | 0.464 | 0.139 | 0.503 | 0.203 | 1.249 |
| Diabetes | 0.056 | 0.517 | 0.899 | 1.068 | 0.388 | 2.939 |
| Cause of death | -0.036 | 0.212 | 0.859 | 0.965 | 0.650 | 1.432 |
| ECD | -0.148 | 0.561 | 0.792 | 0.863 | 0.287 | 2.592 |
ECD: expanded criteria donor; KDPI: kidney donor profile index
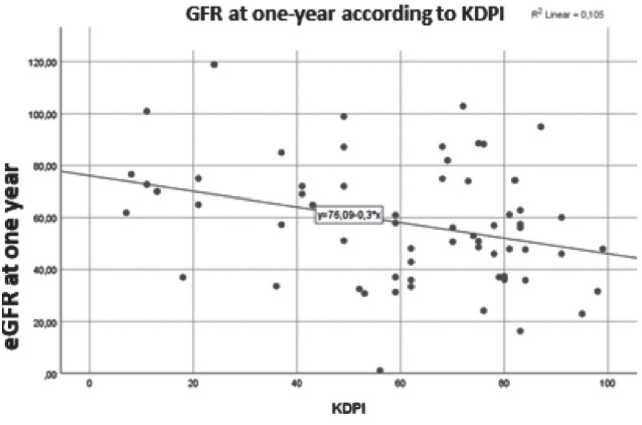
Other correlationsThere was a statistically significant negative correlation between KDPI and GFR at 1-year post-transplant (correlation coefficient -0,324, p =0,009). (Figure 2) There was a statistically significant negative correlation between the
recipient's age and GFR one year after transplant, as depicted on figure 2 (correlation coefficient -0.26, p <0.05). There was also a significant correlation between the number of donor-recipient HLA-DR compatibilities and GFR one year after transplant (Z(3, 465) = 3.1, p=0.027).
Figure 2. Correlation between KDPI and GFR one year post-transplant
DISCUSSION
Our pool of Portuguese donors had a significantly higher value of KDPI than the USA cohort (26% had a KDPI > 85% vs 9.2% in the USA).(5)
Our cohort had a median KDPI of 65%, similar to that described by other European groups (Germany with 66%,(1) Spain with 69.4%,(2) and Ireland with 51%.(3) The number of patients in the high range of KDPI was also noteworthy. (Figure 3)
Figure 3. Distribution of donor KDPI of transplanted kidneys and comparison with other cohorts
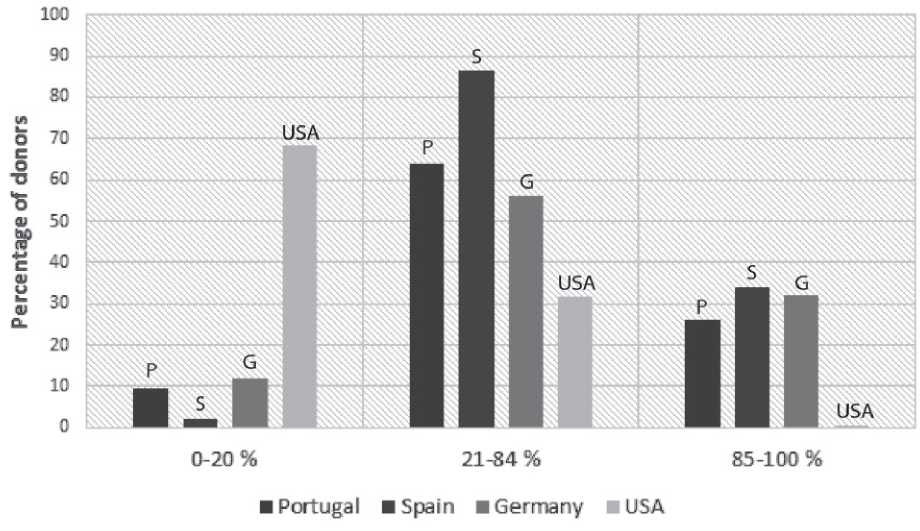
Adapted from data from Lehner LJ et al.,(1) Carlos Arias-Cabrales et al.,(3) OPTN(5)
Despite this fact, our survival rate at five years post-transplant was superior to the one reported by the OPTN (according to data of February 8th, 2019): 93% vs 74.4%.
Our number of graft dysfunctions and acute rejections was low. However, our short follow-up time and the number of patients lost to follow-up most likely contributed to these results.
In our cohort, there was no association between the incidence of graft dysfunction and transplant using kidneys from expanded criteria donors, a finding similar to what Arias-Cabrales C et a/.(3) had found. One explanation for this could be that the majority of data linking ECD to lower graft survival are based on data from the US population, which shows different demographics and characteristics from the European population and possibly limits external validation of this data.
The medium age of donors of kidneys used for transplant in our cohort was 51.6 years ± 14.5 (Figure 4). Donors over 60 years represented less than a third of the total population of kidney donors (26.4%).
Figure 4. Histogram showing distribution of age of donors

In our study, although KDPI correlated with eGFR post-transplant, there wasn't a statistically significant correlation between donor KDPI and graft survival. Hence, we could not consider KDPI a good prognostic test to determine graft survival in the Portuguese population, in contrast to other European cohorts.(1, 3) This could be due to our short follow-up, and hence the low number of graft failures, which could have reduced the power of data. The low number of kidney graft failures may also have led to a lower discriminatory power for identifying factors associated with graft dysfunction or rejection. Another bias for this study is the retrospective nature of this analysis.
Multinomial logistic regression results indicated that recipient age was a significant predictor for graft loss (approximately 5% less likely to occur for each year older a recipient was at the time of transplant). This finding is in line with the study from Lehner et al, which found that in their cohort older recipient age prevented death-censored graft loss.(1)
Regarding machine learning methods used as algorithms to predict kidney graft failure, the DT showed to be a better predictor than ANNs with higher accuracy and sensitivity values. The recipient and donor's age showed the highest discriminatory power for predicting graft dysfunction.
Recipient's PRA, HLA-DR compatibility, and donor's cause of death showed lower discriminatory power than expected. Regarding PRA, this can be due to a variable degree of sensitivity in immunological analysis over the years. Older immunological methods had a lower degree of sensitivity for detecting allosensitization than standard current ones. This could have led to an erroneously higher number of patients categorized as "PRA of 0%". The lower discriminatory power of "cause of death" may be related to the high proportion of patients admitted with a cerebrovascular cause of death in our dataset.
As for machine learning methods, DTs showed better accuracy than ANNs. However, for these classifiers' application on a large scale in the health area, it is necessary to use other balancing sets or to create a Portuguese database containing the data of all patients involved in kidney transplantation (donors and recipients). In that way, ANNs and DTs will have a higher training set that will improve the algorithm performance (hence with greater precision in prediction).
In conclusion, in this study, although KDPI correlated with eGFR 1 year post-transplant, it couldn't accurately predict graft failure. Hence, we could not consider it as a good criteria for accepting an organ or not. On multinomial logistic regression, only age of the recipient proved to be a good prognostic factor. Regarding the use of artificial intelligence methods on the field of kidney transplant, DTs showed a good accuracy.
We believe that this study provides an important reflection about our kidney donor and recipient population, and paves the way for future work. As the worldwide debate about data protection and its legislation continues, it seems clear that wide and detailed database records could be a valuable asset to fully characterize KT donor and recipient population and establish which factors influence kidney graft survival in the long term.
This knowledge is critical for us to be able to select the best organ for each proponent recipient and ultimately provide better care to our population rooted in the values of equity, efficiency, and fairness.
Acknowledgements: The authors would like to thank the Kidney Transplant Unit and Coordination Cabinet of Centro Hospitalar Universitário de Coimbra and Centro Hospitalar Universitário de Sao Joao for providing the data of patients.
BIBIOGRAPHY
1) Lehner LK, Kleinsteuber A, Halleck F, et al. Assessment of the Kidney Donor Profile Index in a European cohort. NephrolDial Transplant (2018) 33: 1465-1472
2) Sexton D, O'Kelly P, Kennedy C, et al. Assessing the discrimination of the Kidney Donor Risk Index/Kidney Donor Profile Index scores for allograft failure and estimated glomerular filtration rate in Ireland's National Kidney Transplant Programme. Clinical Kidney Journal 2019, 1-5
3) Arias-Cabrales C, Perez-Saez MJ, Redondo-Pachon D, et al. Usefulness of the KDPI in Spain: a comparison with donor age and definition of standard/expanded criteria donor. Nefrología, 2018; 38(5):503-513
4) Gandolfini I, Buzio C, Zanelli P, et al. The Kidney Donor Profile Index (KDPI) of Marginal Donors Allocated by Standardized Pretransplant Donor Biopsy Assessment: Distribution and Association With Graft Outcomes. American Journal of Transplantation. August 2014; 14(11)
5) C. Diez-Sanmart in and A. S. Cabezuelo, "Application of artificial intelligence techniques to predict survival in kidney transplantation: A review" Journal of Clinical Medicine, vol. 9, p. 572, 02 2020.
6) OPTN/SRTR 2017 Annual Data Report: Kidney, doi: https://srtr.transplant.hrsa.gov/ annualreports/2017Kindney.aspx#KI_21_char_ped_tx_tx

